BASIC PRINCIPAL AND APPLICATION OF CYTOFLEX FC 500

BASIC PRINCIPAL AND APPLICATION OF CYTOFLEX / FC 500 FLOW CYTOMETRY 美商貝克曼庫爾特 生命科學 產品專員 陳盈諭 Michelle Chen ychen 09@beckman. com

Basic Principle Flow Cytometry is Made of 4 Systems 1. Fluid system 2. Optical system 3. Electronic system 4. Computer system Current Applications of Flow Cytometry 2

Study the Cells: Microscopy True Profile of the Cell ● Labor-intensive ● Arbitrary results ● 3

Why Use Flow Cytometry ? Flow = Fluid Cyto = Cell Metry = Measurement 4

Characteristics of Flow Cytometry Ø High speed acquire : ~3, 300 ~30, 000 events per second Ø Up to 10, 000 of total events to be acquired Ø Simultaneous multicolor analysis (5 colors/10 colors) Ø Higher accuracy, objective and more sensitive 5

Basic Principle Flow Cytometry is Made of 4 Systems 1. Fluid system 2. Optical system 3. Electronic system 4. Computer system Current Applications of Flow Cytometry 6
 (dd. H 2 O) (sample tube) (2×")
1. Fluid System: Hydrodynamic Focusing (流體動力聚焦 ) (dd. H 2 O) (sample tube) (2× 10⁵~ 107 / m. L) Flow Cell 7
 Sheath Max. ~ 3, 300 events /")
1. Fluid System: Hydrodynamic Focusing (流體動力聚焦 ) Sheath Max. ~ 3, 300 events / second Sample 8

Cyto. FLEX Sample Fluidics 吸樣前會自動攪拌 可設定攪拌時間 • Accepts 12 x 75 mm and Eppendorf tubes • Minimum Sample Volume: 10 µL • 3 Pre-set Sample Rates • Slow : 10 µL/min • Medium : 30 µL/min • Fast : 60 µL/min • Adjustable Sample Rate: 10 µL - 240 µL/min Max. ~ 30, 000 events / second 9

Basic Principle Flow Cytometry is Made of 4 Systems 1. Fluid system 2. Optical system 3. Electronic system 4. Computer system Current Applications of Flow Cytometry 10
")
Principle of Flow Cytometry Sample Single cell suspension (2× 10⁵~ 107 / m. L) Flow Cell (流動室) Sheath Light Scatter 405 nm Violet Laser 488 nm Blue Laser 638 nm Red Laser Forward Scatter (FS、FSC) Side Scatter (SS、SSC) Fluorescence (FL) FL 1 – FL 5 (488 nm laser) Cross Section FL 6 – FL 8 (638 nm laser) sample FL 9 – FL 10 (405 nm laser) sheath Flow cell Orifice Waste 11
 vs. Side Scatter (SSC) Larger side scatter Larger forward scatter LASER")
Forward Scatter (FSC) vs. Side Scatter (SSC) Larger side scatter Larger forward scatter LASER Smaller side scatter LASER Smaller forward scatter Forward scatter size of cells Side scatter granularity of cells 12

SSC granularity Example 3 P 1 2 Grans 1 Whole blood sample RBC lysed Monos Lymphs Size: Grans > Monos > Lymphs Granularity: FSC Size Grans > Monos > Lymphs 13

FC 500 Dyes 使用 Channel FL 1, 525+15 nm 488 nm Blue Laser FITC, Alexa Flour 488 GFP FL 2, 575+15 nm FL 3, 620+15 nm FL 4, 675+15 nm FL 5, >755 nm PE ECD, PE-Texas Red, Per. CP PE-Cy 5, PE-Cy 5. 5 Per. CP-Cy 5. 5 PE-Cy 7 YFP PI (DNA) 7 -AAD (DNA) 633 nm Red Laser www. beckmancoulterreagents. com APC-e. Fluor® 647 Cy 5 APC-Cy 7 APC-e. Fluor® 780 14

FC 500 2. Optical System: Laser & Filter Set 635 nm He-Ne Laser 488 nm Argon Laser Side Scatter Forward Scatter Sample 15

FC 500 2. Optical System: Filter Set 16

FC 500 2. Optical System : Filter Set D D 55 D 755 BP LP 0 0 71 LP LP SP D 525 BP 575 BP 620 BP 5 64 0 60 500 LP FL 1 FL 3 675 BP Side Scatter FL 4 FL 5 FL 2 • Band. Pass (BP) • Dichroic Long. Pass (DLP) • Dichroic Short. Pass (DSP) 17

Cyto. FLEX Lasers & Dyes Laser 488 nm Channel Names 525/40 FITC, Alexa. Fluor. TM 488, CFSE, Fluo-3 585/42 PE PE, PI 690/50 PC 5. 5 Per. CP, Per. CP-Cy 5. 5, PE-Cy 5. 5 780/60 PC 7 PE-Cy 7 660/20 APC, Alexa. Fluor. TM 647, e. Fluor. TM 660 Filter 638 nm 712/25 APC-A 700 Dyes APC-A 700, Alexa. Fluor. TM 700 780/60 APC-A 750, APC-Cy 7, APC-H 7, APC-e. Fluor. TM 780 450/45 PB 450 Pacific Blue, V 450, e. Fluor. TM 450, BV 421, DAPI, Hoechst 405 nm 525/40 KO 525 610/20 Violet 610 Krome Orange, Am. Cyan, V 500, BV 510 BV 605, Qdot® 605, e. F 605 18

Cyto. FLEX 2. Optical System: Laser & Filter Set Optical Fiber 488 nm 638 nm 405 nm Side Scatter Flow Cell Forward Scatter Sample 19 13

Cyto. FLEX 2. Optical System: Filter 20
 多波長光分配模組 Bandpass filter")
Cyto. FLEX 2. Optical System: Filter Set Wavelength Division Multiplexor (WDM) 多波長光分配模組 Bandpass filter only 638 nm 488 nm 405 nm Bandpass Filter 21

Basic Principle Flow Cytometry is Made of 4 Systems 1. Fluid system 2. Optical system 3. Electronic system 4. Computer system Current Applications of Flow Cytometry 22
 & Avalanche Photo Diode (APD), 放大訊號(High Voltage) Detector")
3. Electronic System: 光電倍增管 (Photomultipliers, PMT) & Avalanche Photo Diode (APD), 放大訊號(High Voltage) Detector 23
 垃圾桶 24")
3. Electronic System: Discrimination or Threshold (排除雜訊) 垃圾桶 24

3. Electronic System: 將線性訊號轉換成對數訊號 FSC、SSC Lin FL 1 – FL 10 Log 25
 對數訊號(Log) Surface marker 例外: Cell Cycle Platelets 26")
線性訊號(Lin) 對數訊號(Log) Surface marker 例外: Cell Cycle Platelets 26

Basic Principle Flow Cytometry is Made of 4 Systems 1. Fluid system 2. Optical system 3. Electronic system 4. Computer system Current Applications of Flow Cytometry 27

Flow Raw Data: FSC SSC 28

Data Displaying FSC SSC 800 500 420 300 500 1000 Dot Plot 29

Data Displaying FSC SSC Histogram Plot 30

Gating P 2 P 1 Histogram Plot Dot Plot 31

Computer System : 多色實驗、多層次Gating 32

DATA ANALYSIS : PLOT &STATISTICS 33

Plots 1. Single parameter histogram 34

1. Single parameter histogram overlap 35
 Dot plot 36")
2. Dual parameter histogram – (1) Dot plot 36
 Contour plot (等高線圖) 37")
2. Dual parameter histogram – (2) Contour plot (等高線圖) 37
 Density plot 38")
2. Dual parameter histogram – (3) Density plot 38

Statistics 1. Percentage : % Total & %Gate 39

2. Mean : X-mean and Y-mean 40
 41")
3. Coefficient of Variant : CV (變異係數) 41

Flow Cytometer Experiment Settings 42

1. TWO COLOR EXPERIMENT SETTING Two color stain : FITC/PE Control Treat Flow Protocol Setting Sample Negative Positive Control FITC PE (Unstain) Control Treat (2 -color) 43

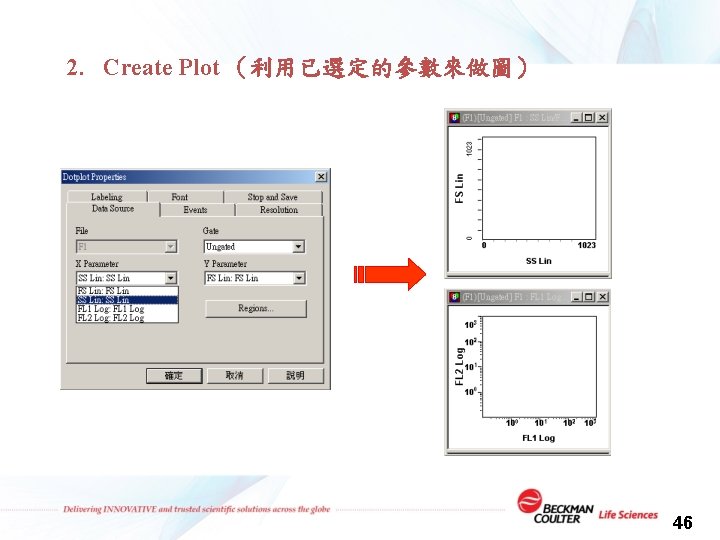
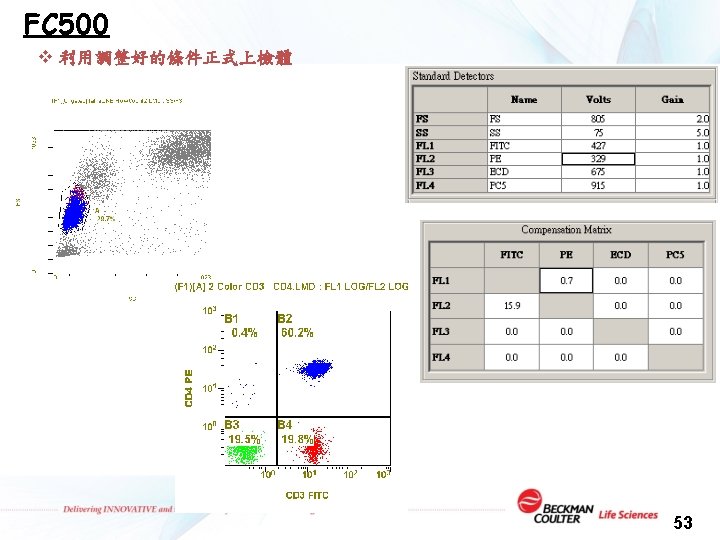
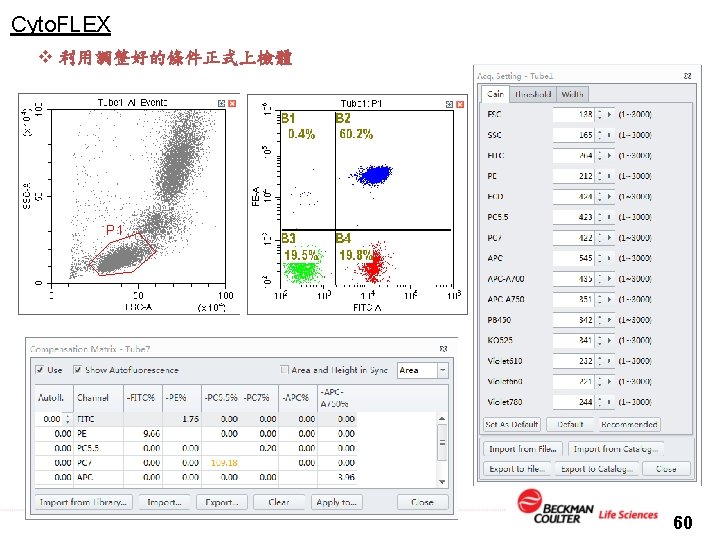
Protocol Setting - Lymphocyte Immunophenotyping v 上樣前: 1. Choose Parameter 2. Create Displaying Plot 3. Setting Discrimination/Threshold v 上檢體: 4. 利用Negative Control 調整Voltage、Gain 5. 利用單染檢體調整Compensation v All of the setting save in the Protocol v 利用調整好的條件正式上檢體 44
 45")
FC 500 1. Parameter Choice (選擇想要收取的參數) 45
 FS (size) = 100 47")
FC 500 3. Discrimination(設定雜訊排除的條件) FS (size) = 100 47

FC 500 4. 利用Negative Control 調整Voltage and Gain 48
 LASER 488 525 575 FL 1 FL 2 615 675 755")
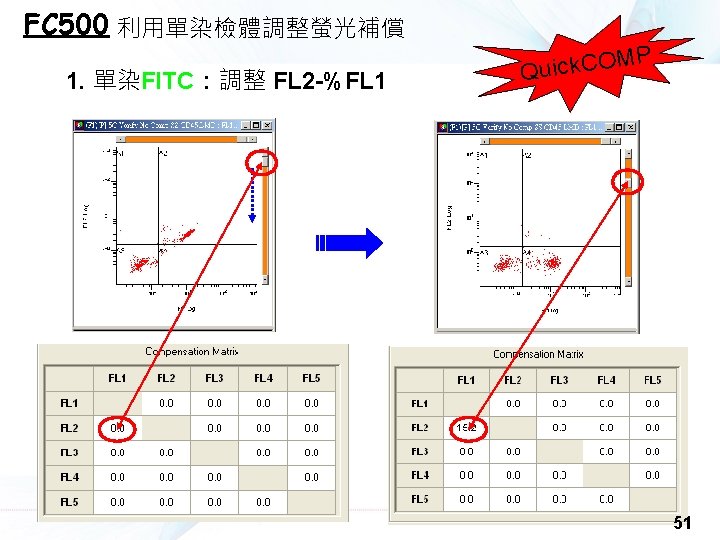
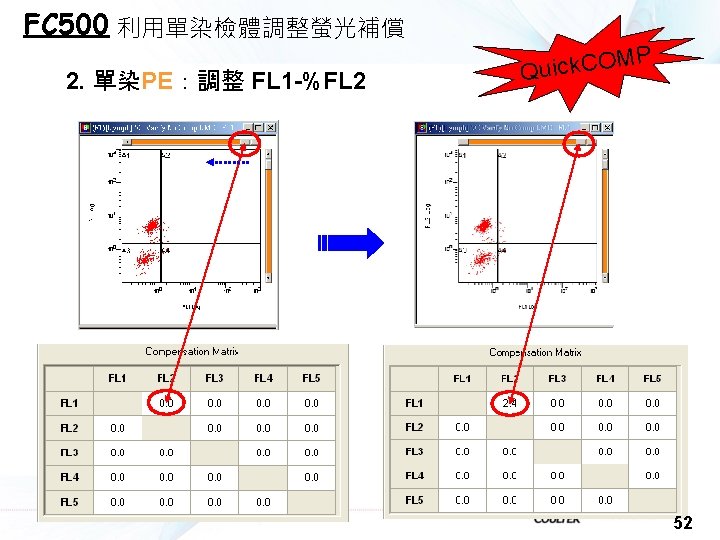
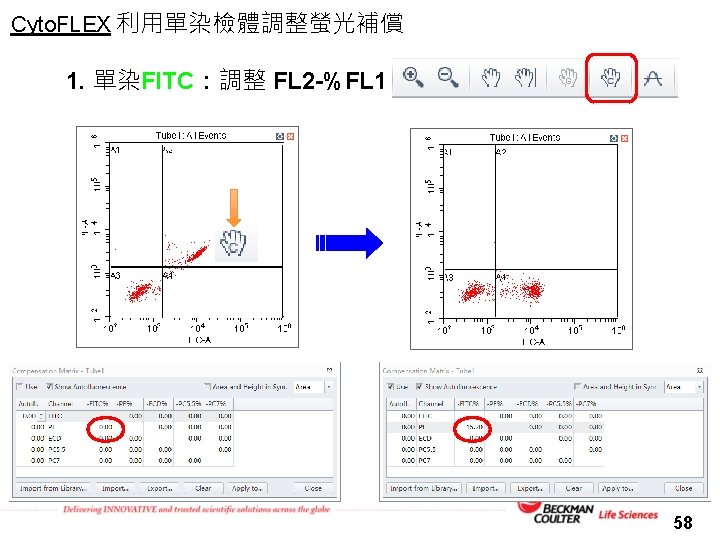
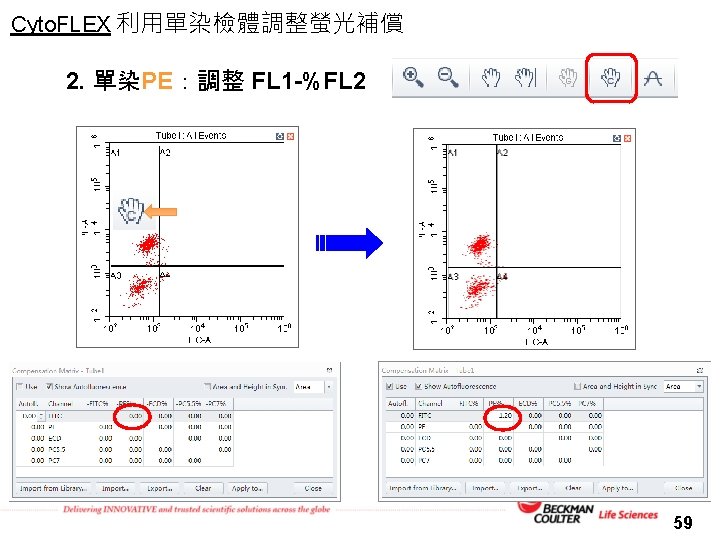
5. 利用單染檢體調整 Compensation(螢光補償) LASER 488 525 575 FL 1 FL 2 615 675 755 FL 3 FL 4 FL 5 49
 FL 1 PMT: 92= 90+2 FL 2 PMT: 100= 85+15 50")
Compensation (螢光補償) FL 1 PMT: 92= 90+2 FL 2 PMT: 100= 85+15 50
 54")
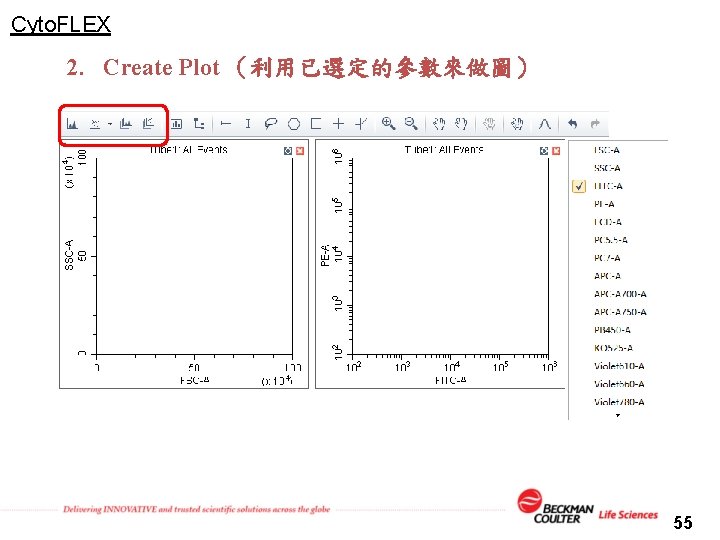
Cyto. FLEX 1. Parameter Choice (選擇想要收取的參數) 54
 56")
Cyto. FLEX 3. Threshold(設定雜訊排除的條件) 56

Cyto. FLEX 4. 利用Negative Control 調整 Gain 57

Basic Principle Flow Cytometry is Made of 4 Systems 1. Fluid system 2. Optical system 3. Electronic system 4. Computer system Current Applications of Flow Cytometry 61
 ▪ Stem cells tracking and")
Cell Surface Marker Immunofluoresecnce analysis ▪ Leukocyte Immunophenotyping (淋巴細胞免疫分型) ▪ Stem cells tracking and enumeration (幹細胞分析及計量) ▪ Analysis of platelets (血小板功能分析) Cell function assays ▪ Cell Cycle and Apoptosis ▪ Mitochondrial membrane potential analysis (Di. OC 6、JC-1) ▪ Calcium kinetic studies (Fluo-3) ▪ Cellular protein content measurements (GFP、YFP) ▪ NK cell cytotoxicity assay (CFSE+ PI ) ▪ Phagocytosis assay (FITC-E. coli Bio. Particles + PI) ▪ Extracellular cytokines detection (beads array) Microorganisms analysis 62

Lymphocyte Markers Antigen CD 3+CD 4 CD 3+CD 8 CD 16+CD 56 CD 19 or CD 20 CD 25 CD 38 CD 45 RO+CD 4 or CD 8 CD 45 RA+CD 62 L+CD 4 or CD 8 Target cell recognized Pan T cell T helper cells T cytotoxic cells NK cells B cells Activated cells Pan leukocyte Memory T cells Naïve T cells 63

Lymphocyte Immunophenotyping T cell / B cell Helper T cell NK cell / Suppressor T Cytotoxic T cell 64

Rare Events-Low Expressed Regulatory T cells Human PBMC- regulatory T cells 65
 identification and enumeration(幹細胞計數) CD 45 -FITC CD 34 -PE")
Hematopoietic /Progenitor Stem cell (HPC) identification and enumeration(幹細胞計數) CD 45 -FITC CD 34 -PE 7 -AAD 66
. 67")
Analysis of Platelets Platelet activation marker P-selectin (CD 62 P). 67
 68")
Mitochondrial membrane potential analysis (Di. OC 6) 68
 A fluorescent dye")
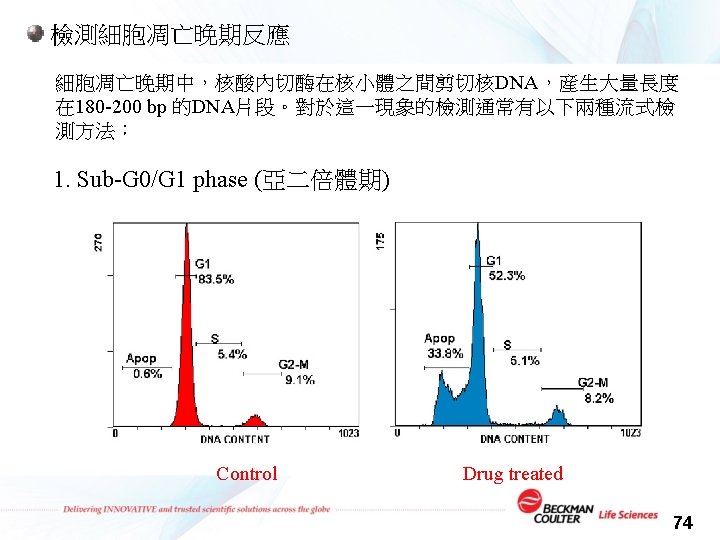
Cell cycle and DNA content analysis Propidium Iodide ( PI ) A fluorescent dye is bound directly to the DNA in the nucleus of cells. Measuring the fluorescence provides a measure of the amount of dye taken up by the cell and indirectly the amount of DNA content. Other DNA Dye : ◆ 7 -AAD ◆ Acridine Orange (AO) ◆ YOYO-1 PI – emits at 610 nm ( FL 3 ) 69

Cell Cycle Analysis with 488 nm Laser 2 C Drug Effect on Cell Cycle Control 4 C Colchicine Camptothecin Anti-CD 95 秋水仙素 抗癌藥物-抑制DNA複製 誘導apoptosis 70
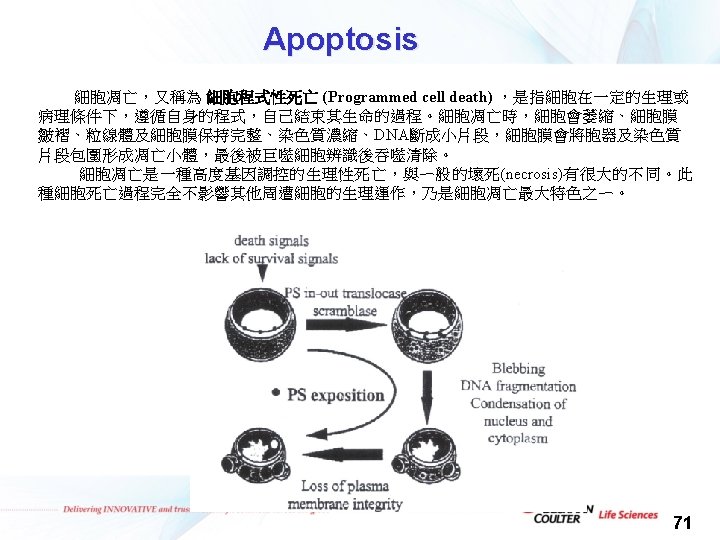
 Annexin V+ PI(early apoptotic)")
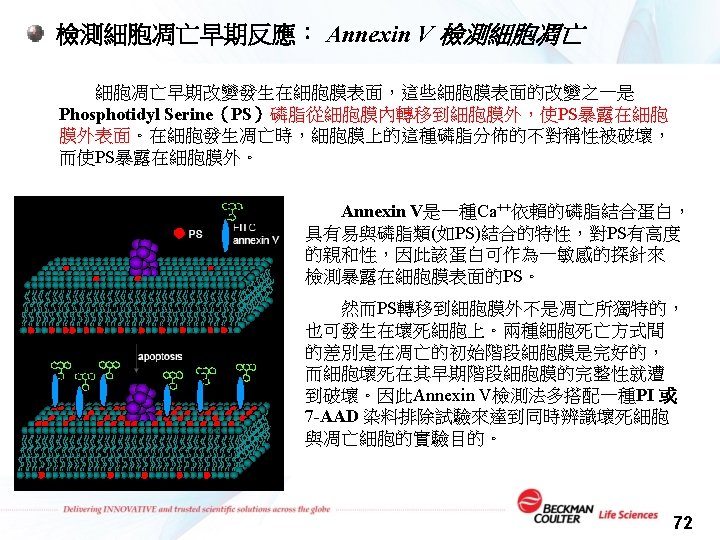
檢測細胞凋亡早期反應: Annexin V 檢測細胞凋亡 Apoptosis Annexin V+ PI+ (late apoptotic/necrotic) Annexin V+ PI(early apoptotic) • Jurkat Cells, induced with Camptothecin overnight at 37ºC (treated) 73
 of M. luteus (gram-positive cocci) and")
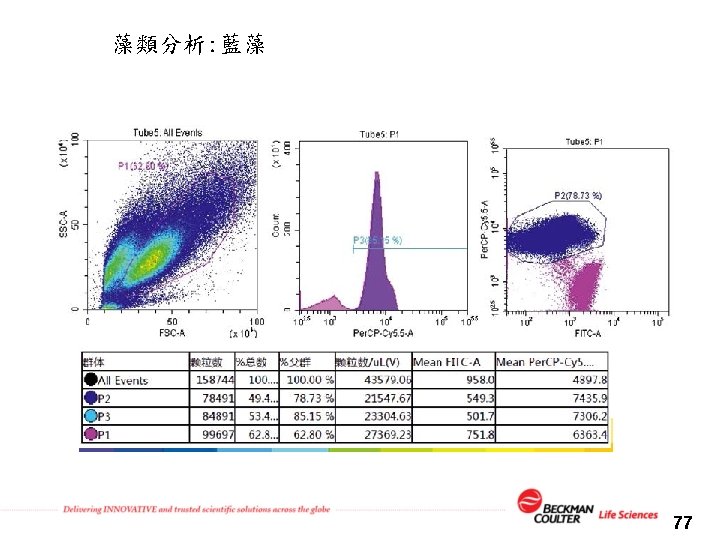
Flow analysis of bacteria Mixed culture (1: 1) of M. luteus (gram-positive cocci) and E. coli (gram-negative rods) Isometric flow-cytometric plots. (A) E. coli; (B) M. luteus; (C) mixed culture (1: 1) of E. coli and M. luteus. 75

Beadless volumetric counting for single platform enumeration Absolute Cell Counts 78

QUESTIONS 79

Cell Cycle Settings 80

Cell Cycle analysis - Gating Out Doublets The process: cell stained with PI, gating the major population from SS/FS plot and display gated cell on fluorescent (FL 2 or FL 3) histogram But………PI usually bring the doublet problem……. . Doublet Problem SS ? FL 2 or FL 3 FS How to gate out the doublet cell before FL plot display? ? 81

The signaling process by Flow There are 3 kinds of signals could be measured (H) A B C (A) Time of Flight (W) 82
 1 2 1")
To measure the signals between singlet and doublet : Peak (H) 1 2 1 Integral (A) 1 2 2 TOF (W) 1 1 2 83
 1 2 1 Integral")
Doublet discrimination: method 1, using H and A Peak (H) 1 2 1 Integral (A) 1 2 2 84
 Doublet discrimination: method 1, using H and A (A) 85")
(H) Doublet discrimination: method 1, using H and A (A) 85
 1 2 1")
Doublet discrimination: method 2, using H, A and H/A Peak (H) 1 2 1 Integral (A) 1 2 2 Ratio (H/A) 1 1 ½ or <1 86

Doublet discrimination: method 2, using H, A and H/A 87

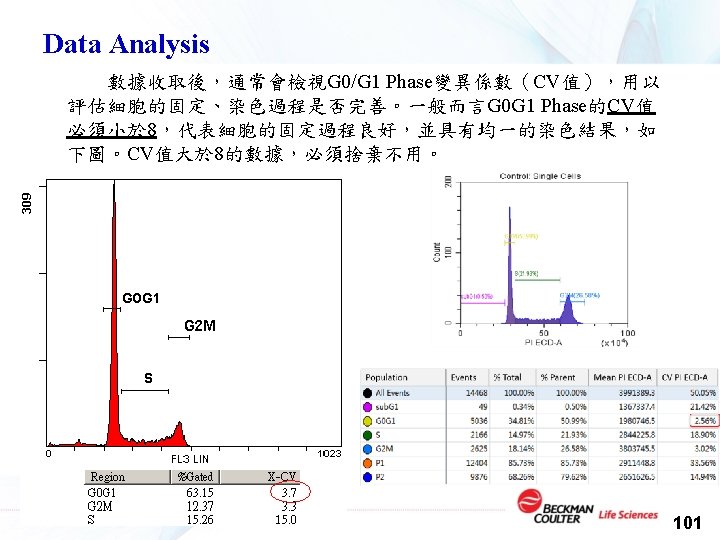
Gating strategy G 0 G 1 Phase S Phase G 0 G 1 Phase,一般常將 G 0 G 1 Phase調整至 Mean = 200~300間。 G 2 M Phase C 96. 5% 88

1. FC 500 Protocol Setting for Cell Cycle Analysis : v 上樣前: 1. Choice Parameter : FS、SS、FL 3 Lin(A)、 FL 3 Peak(H)、Ratio=H/A 2. Create Displaying Plot 3. Setting Discrimination (FS=100 or FL 3=20) v 上檢體: 4. 利用PI染色正常細胞調整偵測器訊號放大程度 (Voltage & Gain) v All of the setting save in the Protocol v 利用調整好的條件正式上檢體 89

FC 500 1. Parameter Selection AUX Peak 90

Ratio FC 500 2. Create Displaying Plot 91
 = 100 or FL 3=20 - 30 92")
FC 500 3. Discrimination FS (size) = 100 or FL 3=20 - 30 92

FC 500 4. 利用Normal Control 調整Voltage and Gain C 96. 5% 一般將G 0 G 1 Phase調 整至Mean =200~300 93

FC 500 5. Final Result G 0 G 1 Phase S Phase G 2 M Phase C 96. 5% 94

Cyto. FLEX 1. Parameter Selection 95

Cyto. FLEX 2. Create Displaying Plot 框選要觀察的細胞 Dot Plot 用以框選單顆細胞 PI X/Y軸勾選Linear Dot Plot 用以顯示Cell Cycle的直方圖 Histogram 96

Cyto. FLEX 2. Create Displaying Plot 滑鼠右鍵 勾選PI CV統計參數 97

Cyto. FLEX 3. Threshold 98

Cyto. FLEX 4. 利用Normal Control 調整Gain G 0 G 1 Phase,一般常將 G 0 G 1 Phase調整至 Mean = 200~300間。 99

Cyto. FLEX 5. Final Result G 0 G 1 Phase S Phase G 2 M Phase G 0 G 1 Phase,一般常將 G 0 G 1 Phase調整至 Mean = 200~300間。 100

THANKS FOR YOUR ATTENTION! 102
- Slides: 102