
Basic Macroeconomic Relationships and the Aggregate Expenditures Model

Basic Macroeconomic Relationships and the Aggregate Expenditures Model
Income Consumption and Saving • Consumption and saving • Primarily determined by DI • Direct relationship • Consumption schedule • Planned household spending (in our • LO 1 model) Saving schedule • DI minus C • Dissaving can occur 27 -2
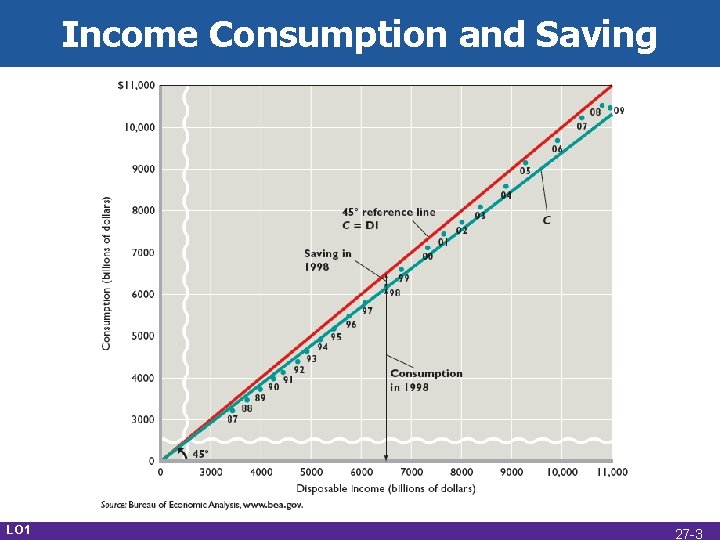
Income Consumption and Saving LO 1 27 -3
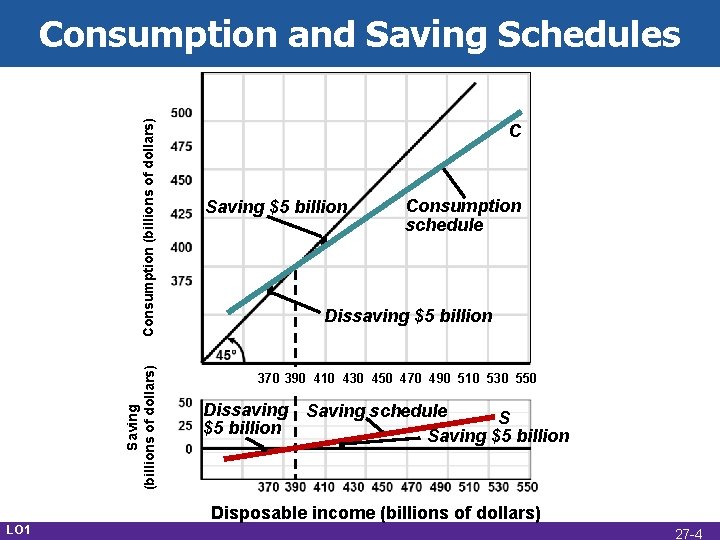
Saving (billions of dollars) Consumption and Saving Schedules LO 1 C Saving $5 billion Consumption schedule Dissaving $5 billion 370 390 410 430 450 470 490 510 530 550 Dissaving Saving schedule S $5 billion Saving $5 billion Disposable income (billions of dollars) 27 -4
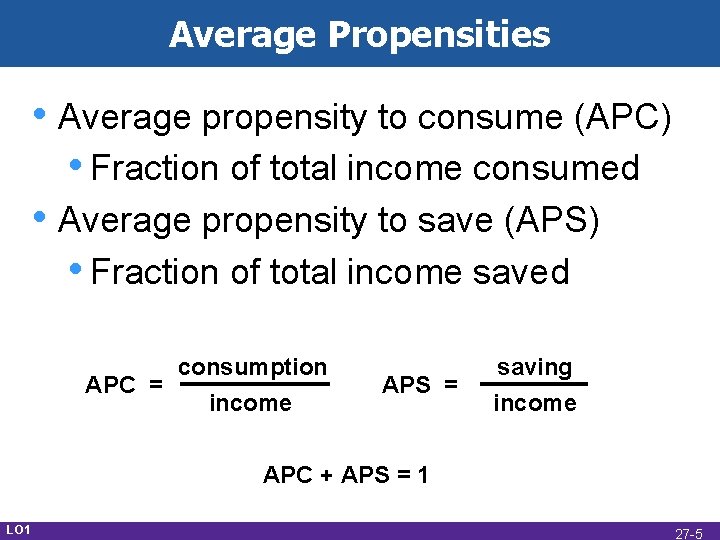
Average Propensities • Average propensity to consume (APC) • Fraction of total income consumed • Average propensity to save (APS) • Fraction of total income saved consumption APC = income APS = saving income APC + APS = 1 LO 1 27 -5
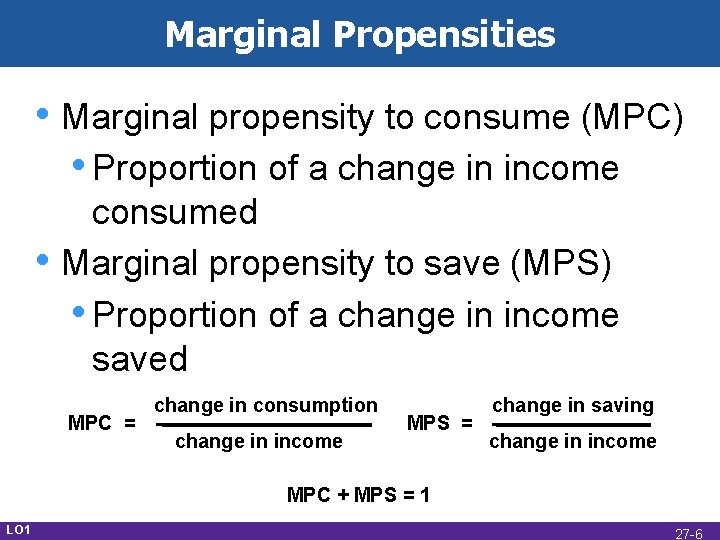
Marginal Propensities • Marginal propensity to consume (MPC) • Proportion of a change in income • consumed Marginal propensity to save (MPS) • Proportion of a change in income saved MPC = change in consumption change in income MPS = change in saving change in income MPC + MPS = 1 LO 1 27 -6
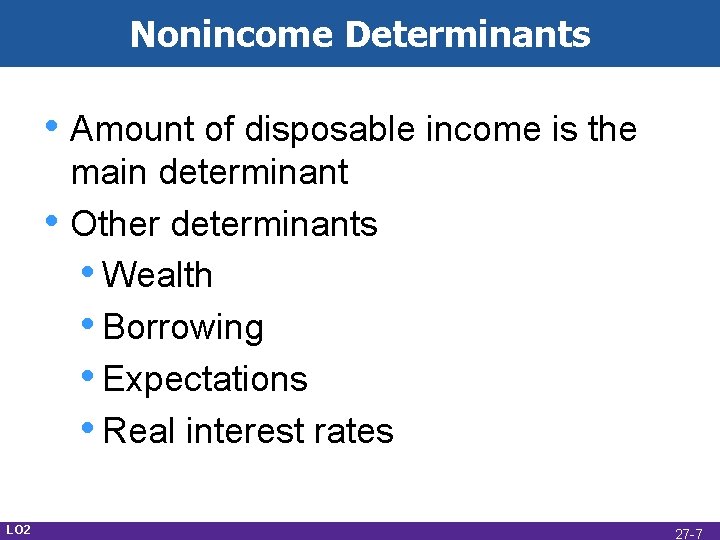
Nonincome Determinants • Amount of disposable income is the • LO 2 main determinant Other determinants • Wealth • Borrowing • Expectations • Real interest rates 27 -7
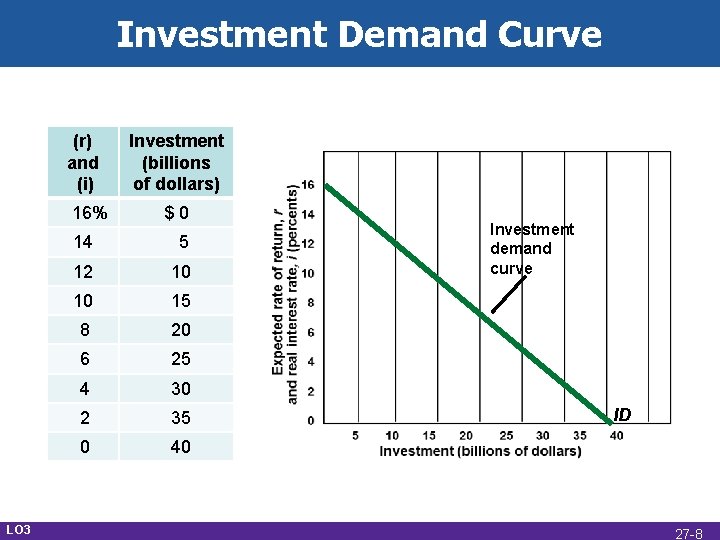
Investment Demand Curve (r) and (i) 16% LO 3 Investment (billions of dollars) $0 14 5 12 10 10 15 8 20 6 25 4 30 2 35 0 40 Investment demand curve ID 27 -8
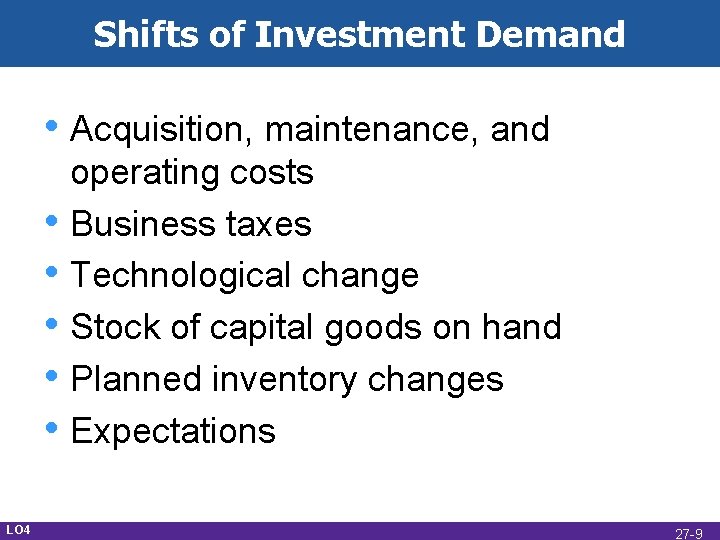
Shifts of Investment Demand • Acquisition, maintenance, and • • • LO 4 operating costs Business taxes Technological change Stock of capital goods on hand Planned inventory changes Expectations 27 -9
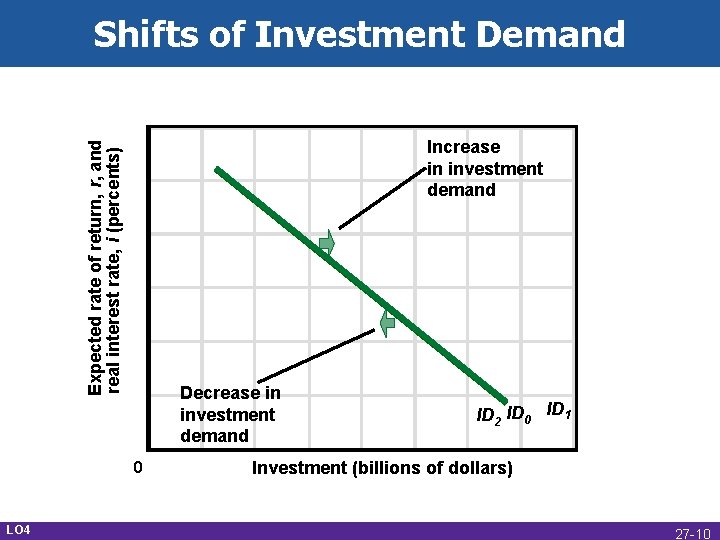
Shifts of Investment Demand Expected rate of return, r, and real interest rate, i (percents) Increase in investment demand Decrease in investment demand 0 LO 4 ID 2 ID 0 ID 1 Investment (billions of dollars) 27 -10
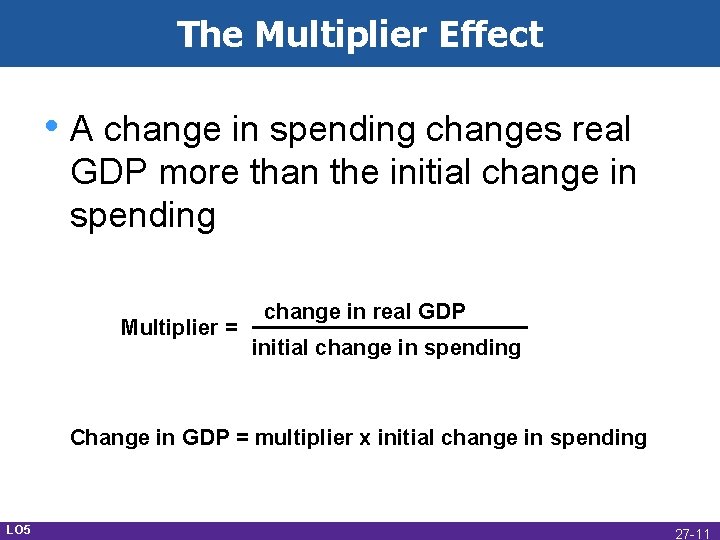
The Multiplier Effect • A change in spending changes real GDP more than the initial change in spending Multiplier = change in real GDP initial change in spending Change in GDP = multiplier x initial change in spending LO 5 27 -11
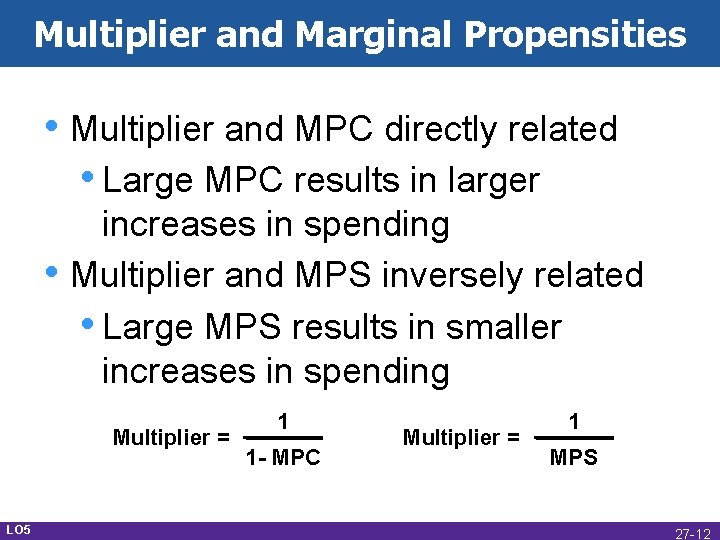
Multiplier and Marginal Propensities • Multiplier and MPC directly related • Large MPC results in larger • increases in spending Multiplier and MPS inversely related • Large MPS results in smaller increases in spending Multiplier = LO 5 1 1 - MPC Multiplier = 1 MPS 27 -12
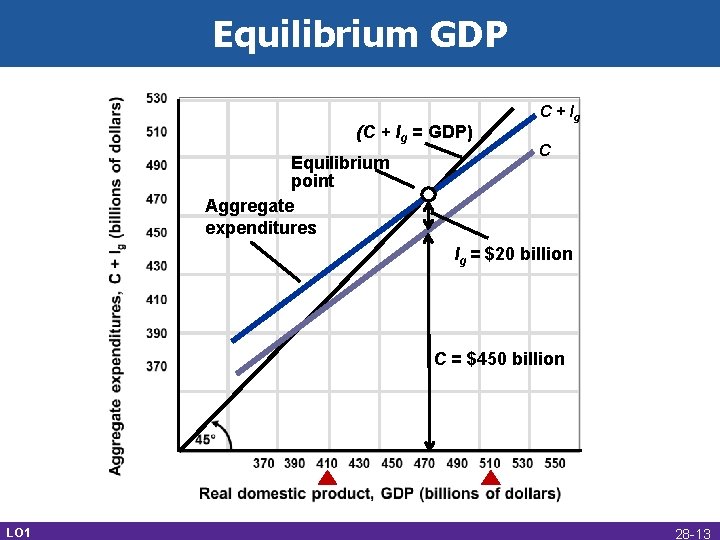
Equilibrium GDP (C + Ig = GDP) Equilibrium point Aggregate expenditures C + Ig C Ig = $20 billion C = $450 billion LO 1 28 -13
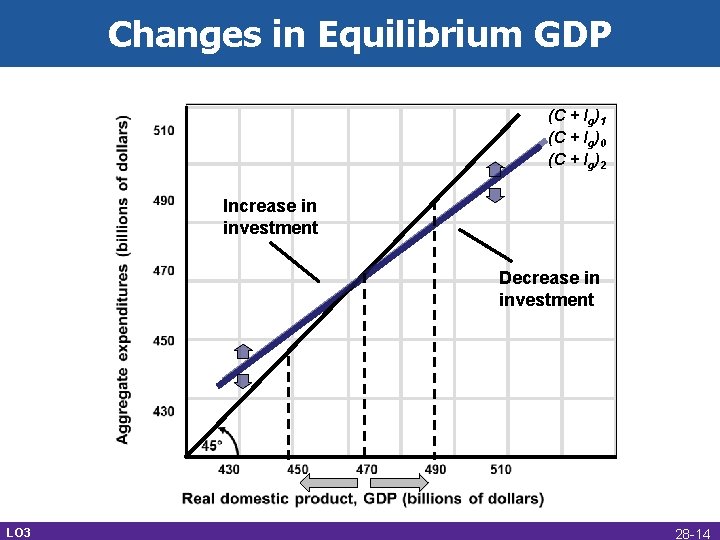
Changes in Equilibrium GDP (C + Ig)1 (C + Ig)0 (C + Ig)2 Increase in investment Decrease in investment LO 3 28 -14
Adding International Trade • Include net exports spending in • • • LO 4 aggregate expenditures • Private, open economy Exports create production, employment, and income Subtract spending on imports Xn can be positive or negative 28 -15
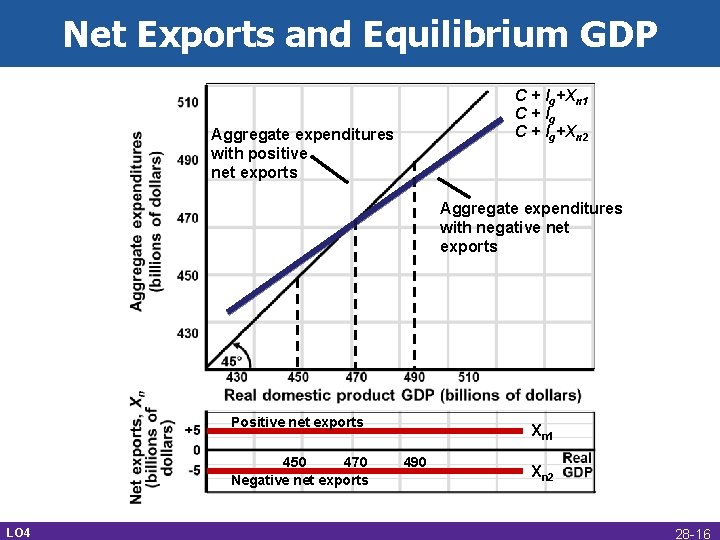
Net Exports and Equilibrium GDP C + Ig+Xn 1 C + Ig+Xn 2 Aggregate expenditures with positive net exports Aggregate expenditures with negative net exports Positive net exports 450 470 Negative net exports LO 4 Xn 1 490 Xn 2 28 -16
Adding the Public Sector • Government purchases and • LO 4 equilibrium GDP • Government spending is subject to the multiplier Taxation and equilibrium GDP • Lump sum tax • Taxes are subject to the multiplier • DI = GDP 28 -17
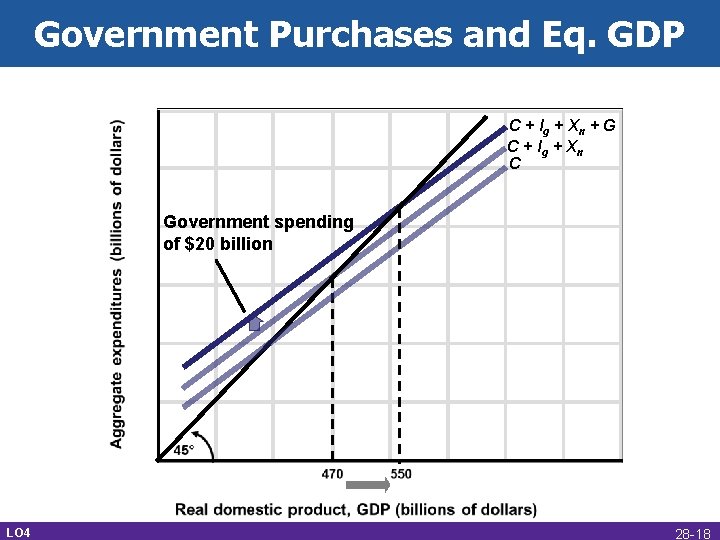
Government Purchases and Eq. GDP C + Ig + Xn + G C + Ig + Xn C Government spending of $20 billion LO 4 28 -18
Equilibrium versus Full-Employment • Recessionary expenditure gap • Insufficient aggregate spending • Spending below full-employment GDP • Increase G and/or decrease T • Inflationary expenditure gap • Too much aggregate spending • Spending exceeds full-employment GDP • Decrease G and/or increase T LO 5 28 -19
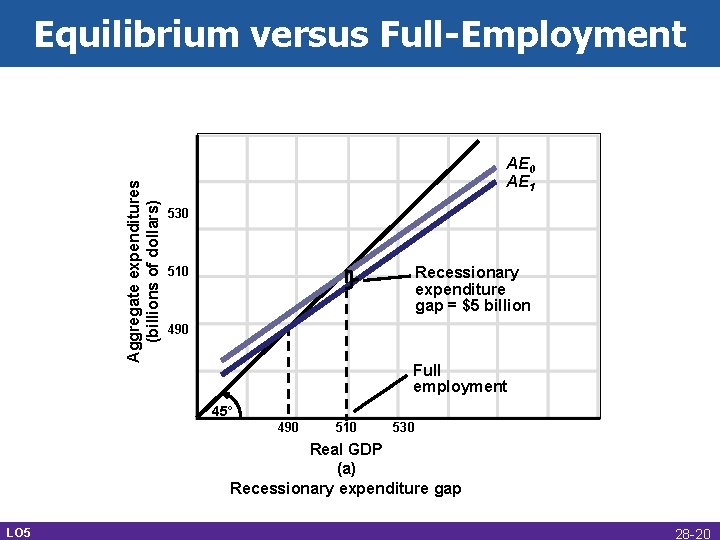
Aggregate expenditures (billions of dollars) Equilibrium versus Full-Employment AE 0 AE 1 530 Recessionary expenditure gap = $5 billion 510 490 Full employment 45° 490 510 530 Real GDP (a) Recessionary expenditure gap LO 5 28 -20
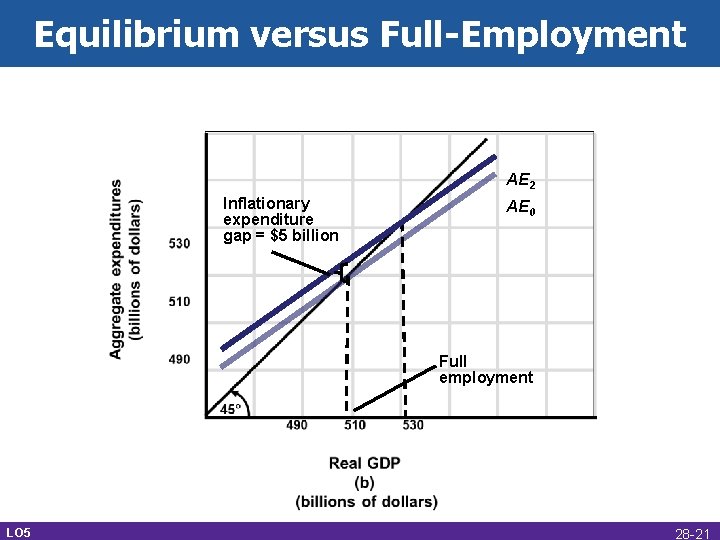
Equilibrium versus Full-Employment AE 2 Inflationary expenditure gap = $5 billion AE 0 Full employment LO 5 28 -21
- Slides: 21