BASIC ECG INTERPRETATION 2015 OBJECTIVES review the ECG

BASIC ECG INTERPRETATION 2015

OBJECTIVES § review the ECG waveform and intervals § Define myocardial ischemia, injury and infarction § Identify the 5 major infarct areas on the 12 lead § Name occluded arteries common to the area § Differentiate ECG changes reflecting ischemia, injury and infarction

CONDUCTION SYSTEM REVIEW

CARDIAC CELLS Action Potential Five Phase cycle reflecting the difference in concentration of electrolytes (Na+, K+, Ca++, Cl-) which are charged particles across a cell membrane The imbalance of these charged particles make the cells excitable

CARDIAC CELL ACTION POTENTIAL Phase 0 Depolarization Rapid Na+ entry into cell Phase 1 Early depolarization Ca++ slowly enters cell Phase 2 Plateau-continuation of repolarization Slow entry of Sodium and Calcium into cell

CARDIAC CELL ACTION POTENTIAL Phase 3 Potassium is moved out of the cell Phase 4 Return to resting membrane potential
 Primary pacemaker Intrinsic rate 60 -100/min Located in Rt.")
CONDUCTION SYSTEM Sinoatrial Node (SA) Primary pacemaker Intrinsic rate 60 -100/min Located in Rt. Atrium Supplied by sympathetic and para-sympathetic nerve fibers Blood from RCA-60% of people

CONDUCTION SYSTEM AV Node Supplied by RCA – 85%90% of people Left circumflex artery in rest of people Delay in conduction due to smaller fibers

CONDUCTION SYSTEM Bundle of His Located in upper portion of interventricular septum Intrinsic rate 4060/min Blood from LAD and Posterior Descending Less vulnerable to ischemia

CONDUCTION SYSTEM Purkinje Fibers Intrinsic pacemaker rate 20 -40/min Impulse spreads from endocardium to epicardium

NORMAL IMPULSE CONDUCTION Sinoatrial node AV node Bundle of His Bundle Branches Purkinje fibers

IMPULSE CONDUCTION & THE ECG Sinoatrial node AV node Bundle of His Bundle Branches Purkinje fibers

THE “PQRST” P wave - Atrial depolarization • QRS - Ventricular depolarization • T wave - Ventricular repolarization
")
THE PR INTERVAL Atrial depolarization + delay in AV junction (AV node/Bundle of His) (delay allows time for the atria to contract before the ventricles contract)

THE ECG

ECG Records electrical voltage of heart cells Orientation of heart Conduction disturbances Electrical effects of medications and electrolytes Cardiac muscle mass Ischemia / Infarction

UNIPOLAR AND BIPOLAR n Limb leads I, III are bipolar and have a negative and positive pole n n AVR, AVL and AVF are unipolar n n Electrical potential differences are measured between the poles No negative lead The heart is the negative pole Electrical potential difference is measured between the lead and the heart Chest leads are unipolar n The heart also is the negative pole � 2 0 0 4 A N N A S T O R Y 18

VIEWS FROM AUGMENTED AND LIMB LEADS- FRONTAL � 2004 Anna Story 19

PRECORDIAL LEAD SNAPSHOTS Think of each precordial lead as a horizontal view of the heart at the AV node With the limb leads and the precordial leads you have a snapshot of heart portions 20 � 2 0 0 4 A N N A S T O R Y

PRECORDIAL LEADS � 2004 Anna Story 21

ECG Lead I Negative electrode Right arm Positive electrode Left arm

ECG Lead II Negative Electrode Right Arm Positive Electrode Left Leg

ECG Lead III Negative Lead Left Arm Positive Lead Left Leg

ECG

THE ECG PAPER Horizontally One small box - 0. 04 s 1. One large box - 0. 20 s Vertically One large box - 0. 5 m. V
 3 sec • Every 3 seconds (15 large boxes) is")
THE ECG PAPER (CONT) 3 sec • Every 3 seconds (15 large boxes) is marked by a vertical line. • This helps when calculating the heart rate.
 Negative (downward) Isoelectric –along baseline Biphasic")
ECG PAPER Waveforms Movement from baseline Positive (upward) Negative (downward) Isoelectric –along baseline Biphasic - Both upward and downward

ECG P Wave First waveform Impulse begins in SA Node in Right Atrium Downslope of P wave –is stimulation of left atrium 2. 5 mm in height (max) O. 11 sec. duration (max) Positive in Lead II

ECG QRS Complex Electrical impulse through ventricules Larger than P wave due to larger muscle mass of ventricles Follows P wave Made up of a Q wave R wave S wave

ECG Q wave First negative deflection following P wave Represents depolarization of the interventricular septum activated from left to right

ECG S wave Negative waveform following the R wave Normal duration of QRS 0. 06 mm – 0. 10 mm Not all QRS Complexes have a Q, R and S

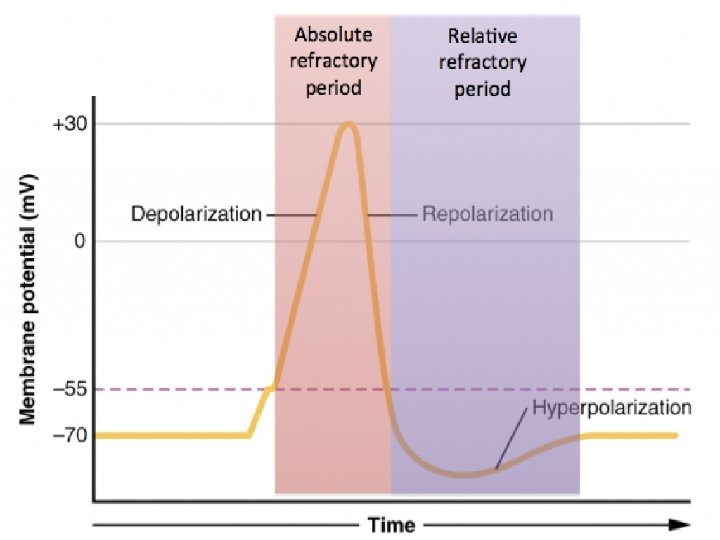
ECG T wave Represents ventricular repolarization Absolute refractory period present during beginning of T wave Relative refractory period at peak Usually 0. 5 mm or more in height Slightly rounded

ECG U wave Small waveform Follows T wave Less than 1. 5 mm in amplitude

A normal ECG waveform

ECG J Point where the QRS complex and ST-segment meet

ECG 1. PR Interval 1. Measurement where P wave leaves baseline to beginning of QRS complex 2. 0. 12 -. 20 sec. 3. QRS Interval 1. Measurement from beginning of the Q wave until the end of the S wave. 2. 0. 06 -. 12 sec.

ECG a. QT interval a. 0. 44 sec. b. Represents total ventricular activity c. Measured from beginning of QRS complex to end of T wave. d. Should not exceed ½ the length of the R-R

RHYTHM ANALYSIS Step 1: Calculate rate. Step 2: Determine regularity. Step 3: Assess the P waves. Step 4: Determine PR interval. Step 5: Determine QRS duration. Step 6: Determine QRS AXIS

STEP 1: CALCULATE RATE 3 sec Option 1 Count the # of R waves in a 6 second rhythm strip, then multiply by 10. 9 x 10 = 90 bpm

STEP 1: CALCULATE R wave Option 2 Find a R wave that lands on a bold line. Count the # of large boxes to the next R wave. If the second R wave is 1 large box away the rate is 300, 2 boxes - 150, 3 boxes - 100, 4 boxes - 75, etc. (cont)

For regular rhythms: Rate = 300 / number of large squares in between each consecutive R wave. For very fast rhythms: Rate = 1500 / number of small squares in between each consecutive R wave.

STEP 2: DETERMINE REGULARITY R R Look at the R-R distances (using a caliper or markings on a pen or paper). Regular (are they equidistant apart)? Occasionally irregular? Regularly irregular? Irregularly irregular? Interpretation? Regular

STEP 3: ASSESS THE P WAVES Are there P waves? Do the P waves all look alike? Do the P waves occur at a regular rate? Is there one P wave before each QRS? Interpretation? Normal P waves with 1 P wave for every QRS

STEP 4: DETERMINE PR INTERVAL Normal: 0. 12 - 0. 20 seconds. (3 - 5 boxes) Interpretation? 0. 12 seconds

STEP 5: QRS DURATION Normal: 0. 06 - 0. 12 seconds. (1 - 3 boxes) Interpretation? 0. 08 seconds
")
Step 6: Determine QRS AXIS Axis refers to the mean QRS axis (or vector) during ventricular depolarization. As you recall when the ventricles depolarize (in a normal heart) the direction of current flows leftward and downward because most of the ventricular mass is in the left ventricle. We like to know the QRS axis because an abnormal axis can suggest disease such as pulmonary hypertension from a pulmonary embolism.

STEP 6: DETERMINE QRS AXIS The normal QRS axis lies between -30 o and +90 o. A QRS axis that between -30 o and -90 o is abnormal and called left axis deviation. -90 o -120 o -150 o A QRS axis that falls between +90 o and +150 o is abnormal and called right axis deviation. A QRS axis that falls between +150 and -90 o is abnormal and called superior right axis deviation. -60 o o -30 o 180 o 0 o 30 o 150 o 120 o 90 o 60 o

Limb leads -90 o I = +0 o -120 o II = +60 o III = +120 o Augmented leads av. L = -30 o av. R -150 o -30 o 180 o 0 o 30 o 150 o av. F = +90 o av. R = -150 -60 o o III 120 o 90 o av. F 60 o II II av. L II

Now using what you just learned fill in the following table. For example, if the QRS is positive in lead I and negative in lead avf what is the QRS axis? (normal, left, right or right superior axis deviation) QRS Complexes I + + avf + - Axis normal left axis deviation -90 o -120 o -60 o -150 o -30 o 0 o I 180 o 30 o 150 o 120 o 90 o avf 60 o

… if the QRS is negative in lead I and positive in lead II what is the QRS axis? (normal, left, right or right superior axis deviation) QRS Complexes I + + avf + - - + Axis normal left axis deviation right axis deviation -90 o -120 o -60 o -150 o -30 o 0 o I 180 o 30 o 150 o 120 o 90 o avf 60 o

… if the QRS is negative in lead I and negative in lead II what is the QRS axis? (normal, left, right or right superior axis deviation) QRS Complexes I + + avf + - - Axis normal left axis deviation right superior axis deviation -90 o -120 o -60 o -150 o -30 o 0 o I 180 o 30 o 150 o 120 o 90 o Avf 60 o

NSR PARAMETERS Rate 60 - 100 bpm Regularity regular P waves normal PR interval 0. 12 - 0. 20 s QRS duration 0. 06 - 0. 12 s Any deviation from above is sinus tachycardia, sinus bradycardia or an arrhythmia

THE 12 -LEAD ECG • The 12 -Lead ECG sees the heart from 12 different views. • Therefore, the 12 -Lead ECG helps you see what is happening in different portions of the heart. • The rhythm strip is only 1 of these 12 views.
 –")
THE 12 -LEADS The 12 -leads include: – 3 Limb leads (I, III) – 3 Augmented leads (a. VR, a. VL, a. VF) – 6 Precordial leads (V 1 - V 6)

VIEWS OF THE HEART Some leads get a good view of the: Anterior portion of the heart Inferior portion of the heart Lateral portion of the heart

ECG CHANGES & THE EVOLVING MI There are two distinct patterns of ECG change depending if the infarction is: Non-ST Elevation –ST Elevation (Transmural or Q-wave), or –Non-ST Elevation (Subendocardial or non-Q-wave)

ST ELEVATION AND NON-ST ELEVATION MI When myocardial blood supply is abruptly reduced or cut off to a region of the heart, a sequence of injurious events occur beginning with ischemia (inadequate tissue perfusion), followed by necrosis (infarction), and eventual fibrosis (scarring) if the blood supply isn't restored in an appropriate period of time. The ECG changes over time with each of these events…

ECG CHANGES : ISCHEMIA • T-wave inversion • ST segment depression • T wave flattening Baseline � 2 0 0 4 A N N A S T O R Y 59

ST ELEVATION One way to diagnose an acute MI is to look for elevation of the ST segment.

ECG CHANGES: INJURY • ST segment elevation of greater than 1 mm in at least 2 contiguous leads • Heightened or peaked T waves Baseline � 2 0 0 4 A N N A S T O R Y 61

ST ELEVATION INFARCTION The ECG changes seen with a ST elevation infarction are: Before injury Normal ECG Ischemia ST depression, peaked T-waves, then Twave inversion Infarction ST elevation & appearance of Q -waves Fibrosis ST segments and T-waves return to normal, but Q-waves persist

NON-ST ELEVATION INFARCTION The ECG changes seen witah a non-ST elevation infarction are: Before injury Normal ECG Ischemia ST depression & T-wave inversion Infarction ST depression & T-wave inversion Fibrosis ST returns to baseline, but T-wave inversion persists

ECG CHANGES Ways the ECG can change include: ST elevation & depression T-waves peaked Appearance of pathologic Q-waves flattened inverted

ECG CHANGES: INFARCT • Significant Q-wave where none previously existed • Why? • Impulse traveling away from the positive lead • Necrotic tissue is electrically dead • No Q-wave in Subendocardial infarcts • Why? • Not full thickness dead tissue • But will see a ST depression • Often a precursor to full thickness MI • Criteria • Depth of Q wave should be 25% the height of the R wave

A NORMAL 12 LEAD ECG 66

ANTERIOR Ø Yellow indicates V 1, V 2, V 3, V 4 • Anterior infarct with ST elevation • Left Anterior Descending Artery (LAD) • V 1 and V 2 may also indicate septal involvement which extends from front to the back of the heart along the septum • Left bundle branch block • Right bundle branch block • 2 nd Degree Type 2 • Complete Heart Block � 2 0 0 4 A N N A S T O R Y 67

ANTERIOR MI � 2 0 0 4 A N N A S T O R Y 68

ECG- INFERIOR Ø Blue indicates leads II, III, AVF • Inferior Infarct with ST elevations • Right Coronary Artery (RCA) • 1 st degree Heart Block • 2 nd degree Type 1, 2 • 3 rd degree Block • Brady

INFERIOR MI � 2 0 0 4 A N N A S T O R Y 70

RIGHT SIDED EKG? ? • RVI occurs around 40% in inferior MI’s • Significance • Larger area of infarct • Both ventricles • Different treatment • Right leads “look” directly at Right Ventricle and can show ST elevations in leads II. III. AVF, V 4 R , V 5 R and V 6 R • Occlusion in RCA and proximal enough to involve The single most accurate tool used in the RV measuring RVI. 90% sensitive and specific

LATERAL Ø Red indicates leads I, AVL, V 5, V 6 • Lateral Infarct with ST elevations • Left Circumflex Artery • Rarely by itself • Usually in combo

LATERAL MI � 2 0 0 4 A N N A S T O R Y 73

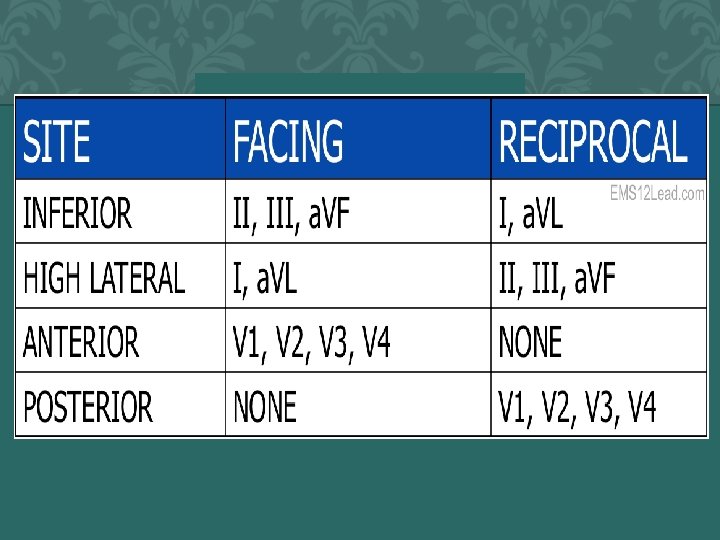
POSTERIOR Ø Green indicates leads V 1, V 2 • Posterior Infarct with ST • Depressions and/ tall R wave • RCA and/or LCX Artery • Understand Reciprocal changes • The posterior aspect of the heart is viewed as a mirror image and therefore depressions versus elevations indicate MI • Rarely by itself usually in combo 74 � 2 0 0 4 A N N A S T O R Y

POSTERIOR MI � 2 0 0 4 A N N A S T O R Y 75

SUBENDO • No color for Sub. Endocardial infarcts since they are not transmural • Look for diffuse or localized changes and non – Q wave abnormalities • T-wave inversions • ST segment depression 76 � 2 0 0 4 A N N A S T O R Y

SUBENDO MI � 2 0 0 4 A N N A S T O R Y 77

MORE THAN ONE COLOR SHOWS ABNORMALITY A combination of infarcts such as: • Anterolateral yellow and red • Inferoposterior blue and green • Anteroseptal yellow and green � 2 0 0 4 A N N A S T O R Y 78

PUTTING IT ALL TOGETHER � 2 0 0 4 A N N A S T O R Y 79

� 2004 Anna Story 80

Patients with the following symptoms and signs require immediate assessment for the initiation of the ACS protocol: • Chest pain or severe epigastric pain, non-traumatic in origin, with components typical of myocardial ischemia or AMI: • Central/substernal compression or crushing chest pain; • Pressure, tightness, heaviness, cramping, burning, aching sensation; • Unexplained indigestion, belching, epigastric pain; • Pain in neck, jaw, shoulders, back, or 1 or both arms; • Associated dyspnea; • Associated nausea and/or vomiting; • Associated diaphoresis; If these symptoms are present, obtain vital signs and a stat ECG and transmit immediately to physician on-call.

The triage nurse should take a brief, targeted, initial history with an assessment of current or past history of: • Coronary artery bypass graft (CABG), PCI, Coronary Artery Disease (CAD), angina on effort, or MI; • Nitroglycerin use to relieve chest discomfort; • Risk factors, including smoking, hyperlipidemia, hypertension, diabetes mellitus, family history of CAD, and cocaine or methamphetamine use; • Arrhythmia history should include utilization of permanent pacemaker or implantable cardioverter-defibrillator; • Regular and recent medication use.

Immediate General Treatments and Interventions The treatment of a patient with chest pain should focus on a rapid assessment, stabilization, diagnosis and if needed reperfusion therapy. Upon arrival to the nursing station, the patient should be connected to continuous cardiac monitoring. Initial physical assessment and a 12 lead ECG should be done within 10 minutes of patient’s arrival to the nursing station. Upon acquisition, all ECGs must be transmitted to the physician on-call for immediate interpretation.

Special Considerations • Patients with diabetes may have atypical presentations due to autonomic dysfunction. • Elderly patients may have atypical symptoms such as generalized weakness, stroke, syncope, or a change in mental status.

REFERENCES • • Twelve Lead Electrocardiography for ACLS Providers, D. Bruce Foster, D. O. W. B. Saunders Company Rapid Interpretation of EKG’s , Dale Dubin, M. D. , Cover Publishing Co. 1998 ECG’s Made Easy, Barbara Aehlert, RN, Mosby, 1995 The 12 Lead ECG in Acute Myocardial Infarction, Tim Phalen, Mosby, 1996 Color Coding EKG’s , Tim Carrick, RN, H &H Publishing, 1994 Drawings by Jill Gregory, Medical Illustrator, CGEY � 2 0 0 4 A N N A S T O R Y 86
- Slides: 86