Barometric Altimetry Using the Vernier Lab Pro Purpose

Barometric Altimetry Using the Vernier Lab. Pro

Purpose of Report • Improved altitude determination for Balloon Fest • and other activities Determine characteristics of Vernier Barometer sensor – Resolution – Uncertainty – Accuracy • Establish reliable procedures for testing and use.

Barometer Sensor Specs • Sensitivity: 13. 08 V/atm • Digital resolution: 0. 003 m. Bar (~0. 8 m)

Atmospheric Pressure Profile • Standard Atmosphere Model Near sea level, this exponential model yields almost identical results as the Adiabatic, Constant Temperature, and Meteorological models do. We can assume that over a small change of altitude (i. e. 1000 ft) this exponential curve approximates a straight line. However, the slope of this linear approximation changes significantly as one moves to higher ground altitudes (e. g. 15% difference in slope between 0 ft and 6000 ft)

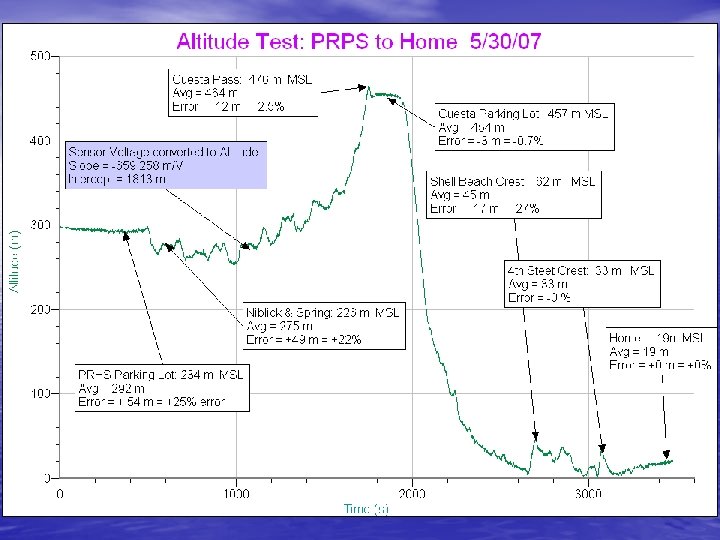
Converting Sensor output to Altitude Data Sensor Output Volts Slope Intercept -659. 3 m/V +1635 m k. Pa -84. 50 +8560 m m/k. Pa Atm -8562 +8560 m m/Atm In Hg -24. 96 +8560 Model m for elevations between Slope is calculated from US Standard Atmosphere 1000 and 2000 ft above sea level. m/in. Hg The Intercept is based on sea level pressure being 101. 3 k. Pa.
 on the leading edge of")
Dynamic Pressure Effects • Difference of pressure ( P) on the leading edge of a body moving through air with a relative velocity (v): P= ½ v 2 • Error in altitude determination due to dynamic pressure: H = P 84 m/k. Pa • At 10 MPH: H = 1 m • At 60 MPH: H = 36 m

Field Tests • USGS topo maps: typically 20 ft contours • Google Earth: appears good but has unknown accuracy • Weather services report three kinds of pressure: – Station, Barometric, Altimeter
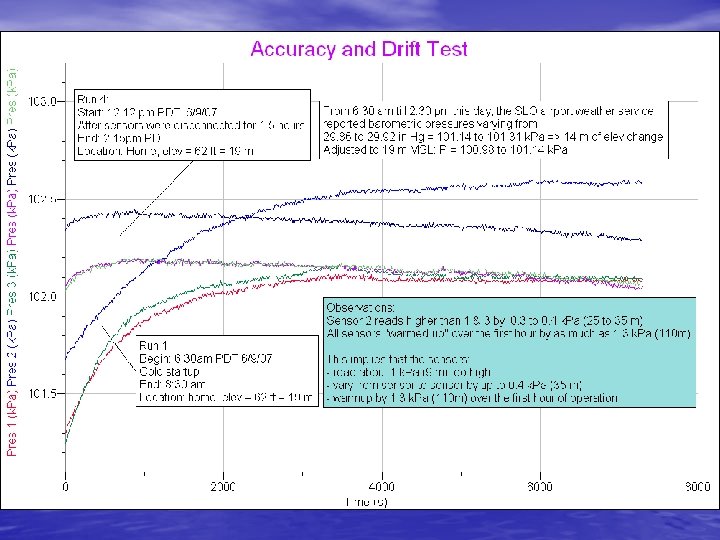

Barometric Pressure during the Accuracy and Drift Test as reported at SLO airport about 9 miles north of test location at an elevation of 212 ft MSL. This graph covers the time from 2 pm 6/8/07 thru 2: 30 pm 6/9/07

Summary of Observations • Warm up: • • • – Time: from 2 minutes to as much as 1 hour. – Increasing pressure: from 0. 1 k. Pa to as much as 1. 3 k. Pa – Decreasing error in altitude measurement: from 8 m to as much as 110 m. Sensors outputs vary by up to 0. 4 k. Pa (~35 m) Read about 1 k. Pa (9 m) higher than official sources. Have a digital resolution of about 0. 8 m. Random variations of about ± 2 steps Uncertainty (std deviation) of ± 1. 6 m.

Conclusion • Relative altimetry is possible to an accuracy of 2 or 3 meters if painstaking effort is taken to eliminate or mathematically remove: – “warm-up” drift – Pressure drift (weather changes) – Dynamic pressure effects (due to wind or motion)
- Slides: 12