Barbara G Schneider Kristan A Schneider Hi Im

Barbara G. Schneider & Kristan A. Schneider

Hi! I‘m Barbara…

… and I‘m Kristan

In the next 5 minutes we will guide you through our video poster „Visualizing Statistical Inference Using SAS® “


teaching statistics to medical students or physicians is demanding. The reason is that they are more firmly rooted in applications rather than in an abstract theoretical framework. Visualization is an excellent tool to improve comprehensibility when explaining dry concepts such as statistical inference.

If one desires to draw conclusion from data one has to be familiar with various statistical terms, e. g. , p-values, significance level, test statistics, power etc. , where at least an intuitive understanding is required. Our presentation suggests an approach for teaching statistical inference using simulated data together with animated graphics. .

In particular, the GIFANIM device driver that facilitates animated graphics is discussed and the respective SAS code is presented. We address to everyone who wants to use visualization as a didactical tool or is interested in the technical background itself. SAS software refers to Version 9. 1. 3.


Making medical students or physicians understand statistics is quite a challenge. They are typically not educated to think in abstract terms, so visualization is an excellent tool to obtain more insight on basic but abstract statistical concepts. Physicians want to draw conclusions from data.

Therefore, they have to understand statistical testing and should be able to interpret output from statistical software packages. In particular, the meaning of significance levels, and the differences between them and pvalues are essential. They must also be aware of power and the importance of sample size considerations.

mcvmf Bridging the gap between physicians’ “real world” and statisticians’ imaginations, simulations together with visualization are of great value. In the following, we demonstrate how to use visualizations Based on animated graphs to improve the understanding of the terms mentioned above.


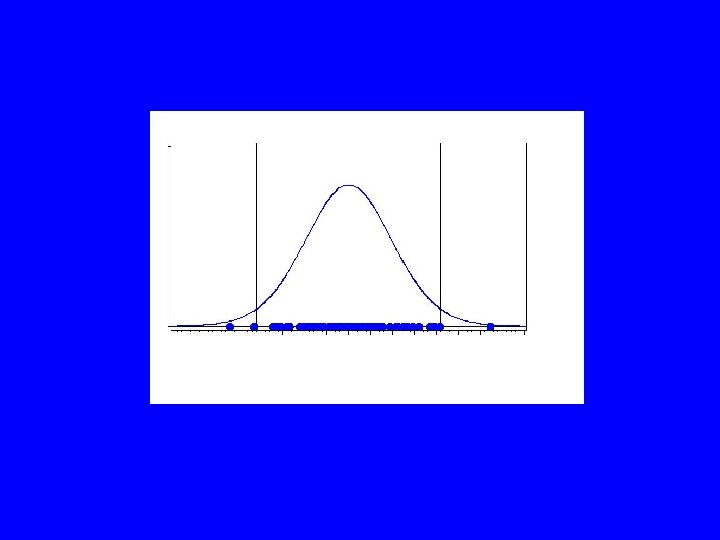
When performing any statistical test, all information of sample values is concentrated in a single value called realisation (value) of the test statistic. The test statistic is a random variable following a specific distribution. To explain significance level we use a two-sided onesample t-test at a significance level of 5%.

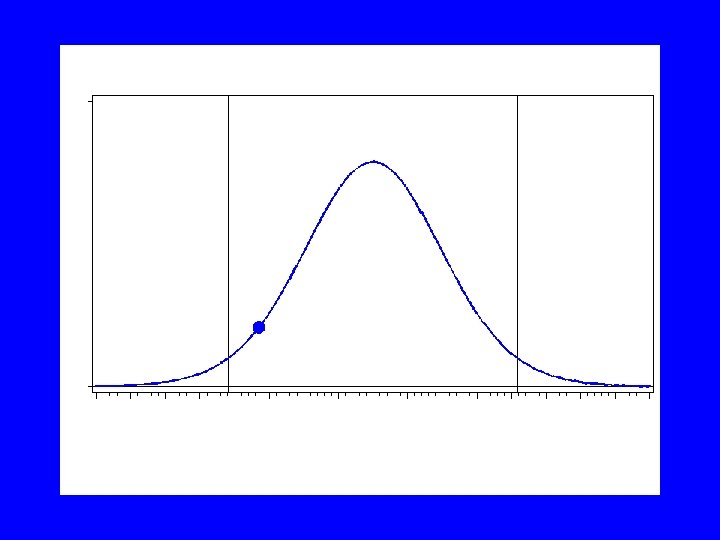
We assume that a study is repeated hundred times. Under the assumption that the null hypothesis holds, the values of the test statistic can be associated with dropping dots from the shape of the corresponding probability density. The next figures demonstrate this approach using a tdistribution with 19 degrees of freedom (20 observations per sample). Proc gplot is used to create the following sequence of images.

Finally this sequence of images has to be linked together to produce the animation. Later, we show to perform this task using the GIFANIM device driver.

But first watch the animation …

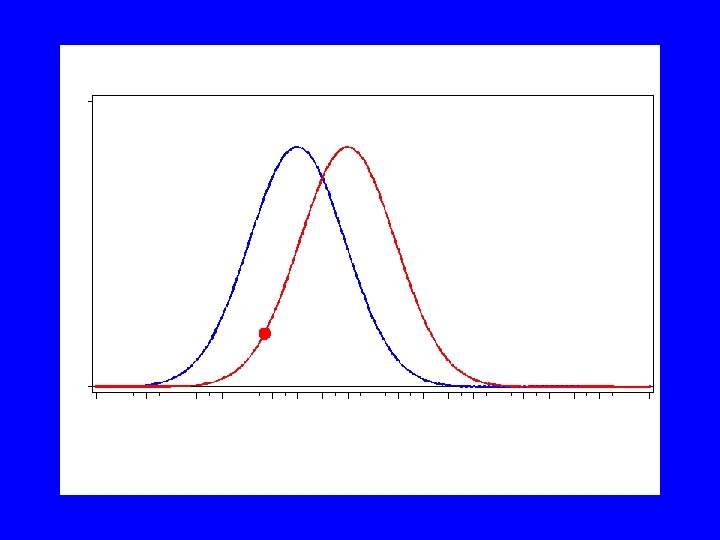
To demonstrate power and sample size considerations we use the one-sided onesample z-test. The test should detect a difference of one third of the standard deviation

Performing the test with a sample size of 10 and a significance level of 5% we get these simulations (blue: null hypothesis; red: alternative hypothesis).

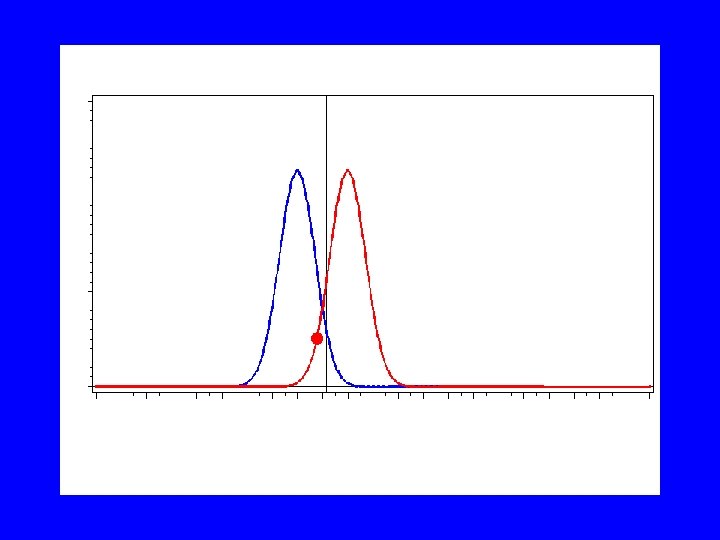
A sample size of 75 observations will result in the following pictures.


The GIFANIM driver creates GIF animations by combining images created using SAS/GRAPH. The driver is controlled by graphics options that enable you to specify, e. g. , delay time, iteration count, transparency, and disposal methods. .

The process involved with creating an animated GIF file requires control of the job sequence and ensures that the resulting data stream is constructed properly.

The GIFANIM data stream consists of three parts: Header, Body, and Trailer. Each of the equally important Ingredients must be present, to ensure a properly working animation sequence. For details we refer to our paper in the proceedings guide.


Next, We present the code for the animation. This is only one possibility, Take this code as a suggestion.


Assign the destination for the output file. Set the graphics environment and assign the appropriate graphics options for the animation.

number of studies These data steps create random numbers and data for the sequence of graphs

These data steps create information for the sequence of graphs

This data step creates coordinates for the density functions under both hypotheses These data steps create coordinates for the dots and the density function

The following code sets the symbol statements for the graphs and uses proc gplot to produce the series of plots that will be animated by the GIFANIM driver To end the animation. Disassociates the currently assigned filerefs.


The GIFANIM device driver is of great value for creating animated graphics in order to improve your presentations, and to achieve more attractiveness for the audience.

• REFERENCES • SAS/GRAPH 9. 1 Reference http: //support. sas. com/documentation/onlinedoc/sas 9 doc. html • CONTACT INFORMATION • • Barbara Schneider Medical University of Vienna Section for Medical Statistics Spitalgasse 23 A - 1090 Vienna Austria barbara. schneider@meduniwien. ac. at

The end
- Slides: 41