Bar Charts Single Demonstration This resource provides animated

Bar Charts – Single – Demonstration This resource provides animated demonstrations of the mathematical method. Check animations and delete slides not needed for your class.

In March, in a local school football tournament, Adam, Becka & Carla were the top scorers. Adam scored 4 goals. Becka scored 3 goals. Carla scored 5 goals. How could we represent this data?

What do we call this type of representation? Andy Becka Carla

A Bar Chart Goals scored in the March football tournament 6 5 4 Goals Scored 3 2 1 0 Andy Becka Student Carla

What are the advantages and disadvantages of each type of graph? Topic-related Standardised Visually interesting Better for large amounts of data. Difficult to draw Easy to draw

Goals scored in the March football tournament Title 6 Equal width bars 5 Equal width gaps 4 Goals Scored Axis Title 3 2 1 Numbered Frequency 0 Categories Andy Becka Student Carla Axis Title
, Edward (6)")
In a November football tournament, the top goals scorers were David (3), Edward (6) & Fred (4). Goals 8 What mistakes can you spot? 7 6 4 3 2 1 David Edwrd Student Fred
, Edward (6)")
In a November football tournament, the top goals scorers were David (3), Edward (6) & Fred (4). Goals scored in the November tournament 7 6 5 Goals Scored 4 3 2 1 0 David Edward Student Fred

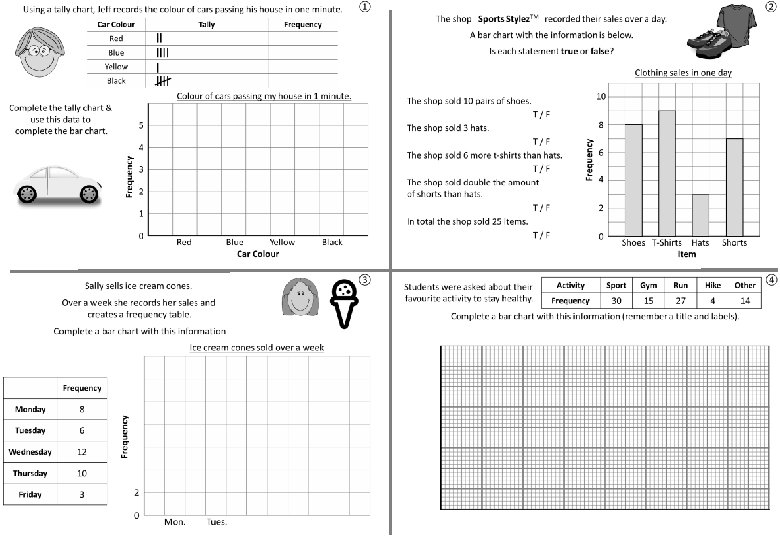
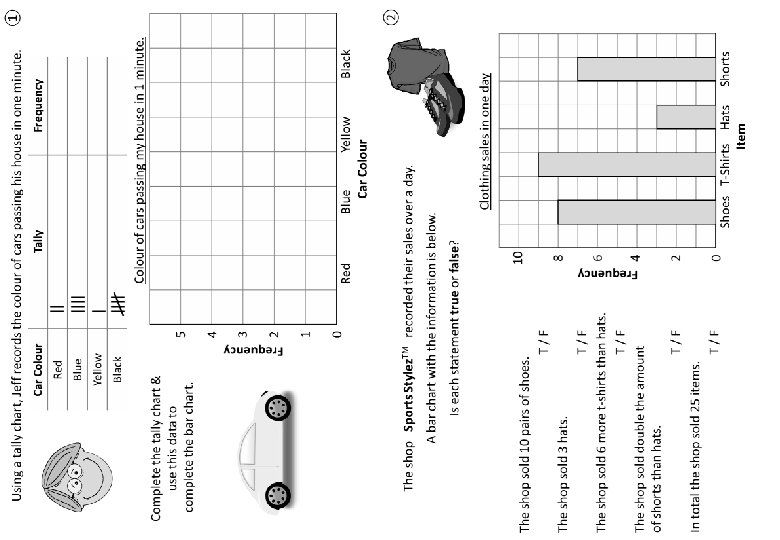
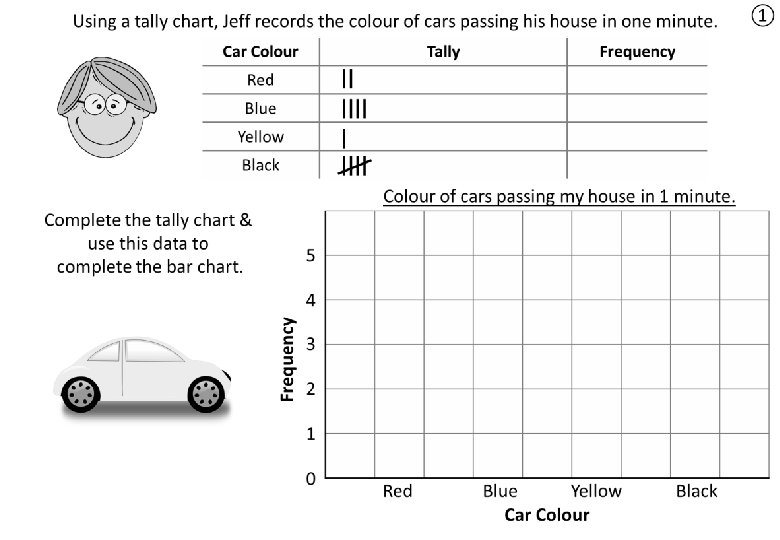
Using a tally chart, Jeff records the colour of cars passing his house in one minute. Car Colour Tally Frequency Red 2 Blue 4 Yellow 1 Black 5 Colour of cars passing my house in 1 minute. Complete the tally chart & use this data to complete the bar chart. 5 Frequency 4 3 2 1 0 Red Blue Yellow Car Colour Black ①

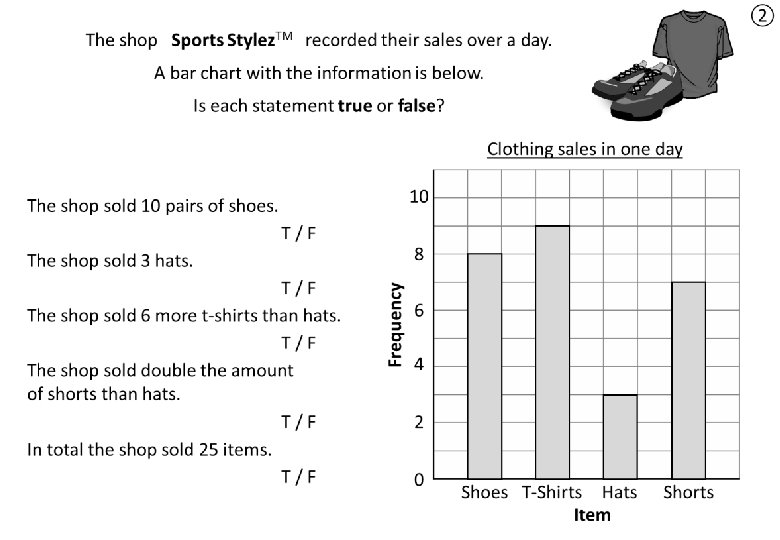
② The shop Sports Stylez TM recorded their sales over a day. A bar chart with the information is below. Is each statement true or false? Clothing sales in one day 10 The shop sold 10 pairs of shoes. T/F 8 T/F The shop sold 6 more t-shirts than hats. T/F The shop sold double the amount of shorts than hats. T/F In total the shop sold 25 items. T/F Frequency The shop sold 3 hats. 6 4 2 0 Shoes T-Shirts Hats Item Shorts

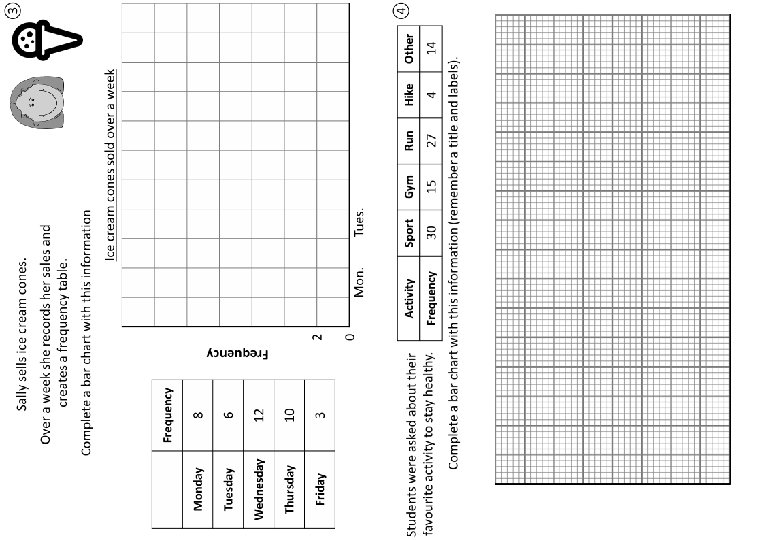
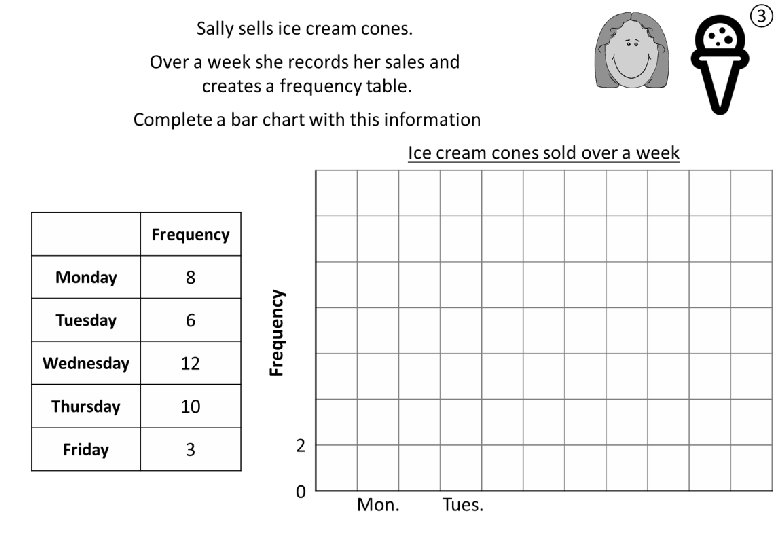
③ Sally sells ice cream cones. Over a week she records her sales and creates a frequency table. Complete a bar chart with this information Ice cream cones sold over a week 14 12 Frequency 10 8 Tuesday 6 Wednesday 12 Thursday 10 4 Friday 3 2 Frequency Monday 8 6 0 Mon. Tues. Weds. Day Thurs. Fri.

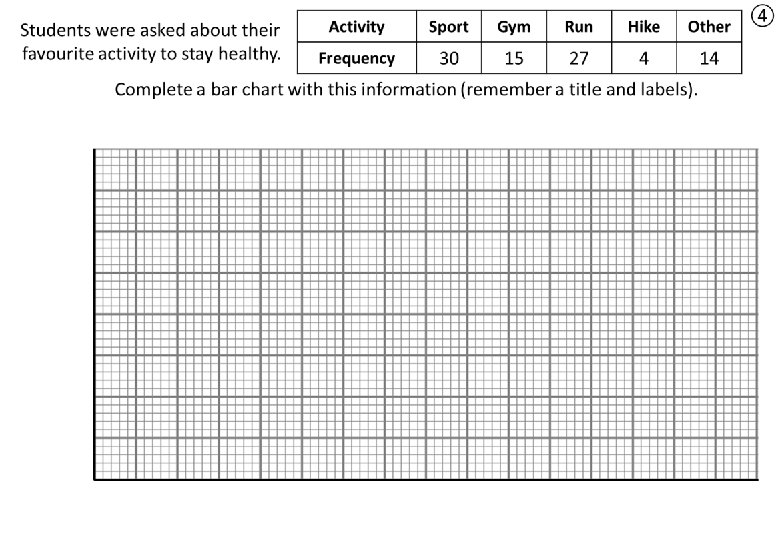
Students were asked about their favourite activity to stay healthy. Activity 60 Sport Frequency 30 Gym Run Hike Other 15 27 4 14 Complete a bar chart with this information (remember a title and labels). Students’ favourite activities to keep fit. 40 Frequency 30 20 10 0 Sport Gym Run Activity Hike Other ④

Answers

Questions? Comments? Suggestions? …or have you found a mistake!? Any feedback would be appreciated . Please feel free to email: tom@goteachmaths. co. uk
- Slides: 21