Bar Chart Histogram Line Graph Pie Chart Triangular
Sign up to view full document!
SIGN UP

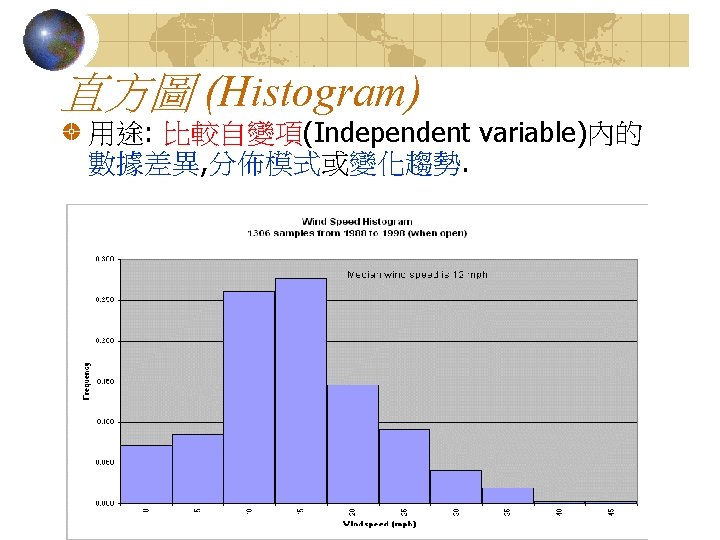
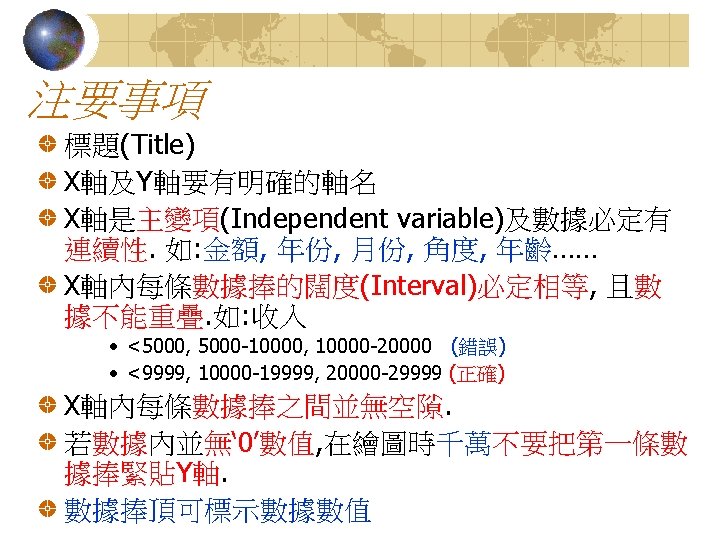
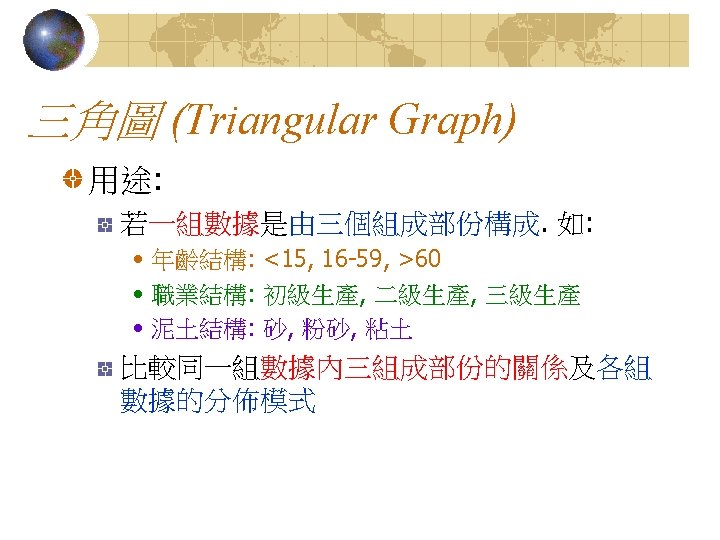
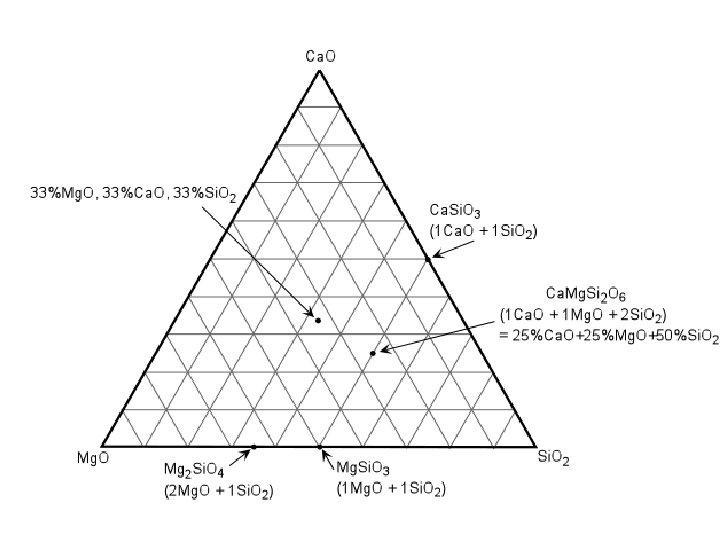
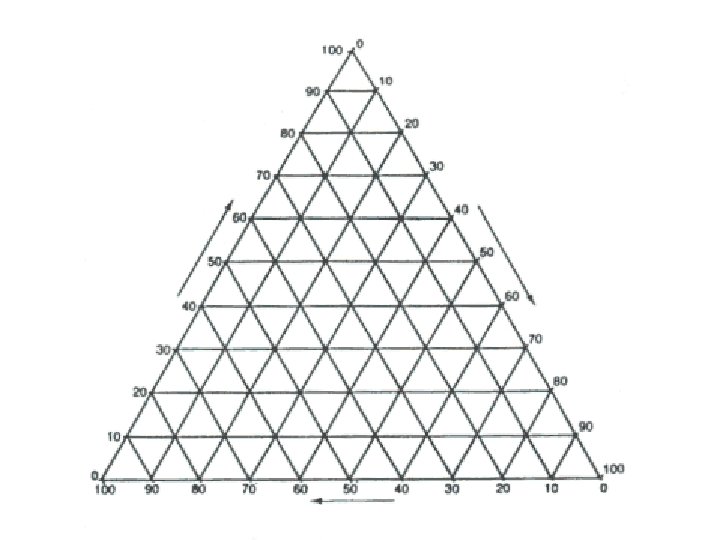
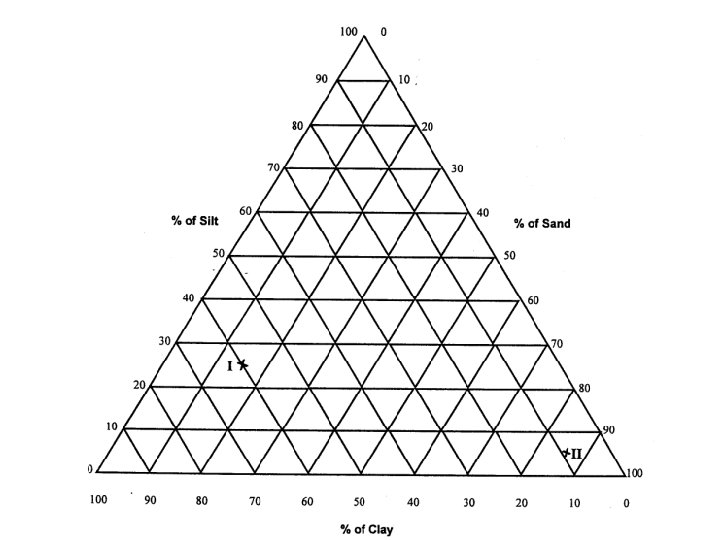
 直方圖 (Histogram) 折線圖 (Line Graph) 百分比圖 (Pie Chart) 三角圖 (Triangular")
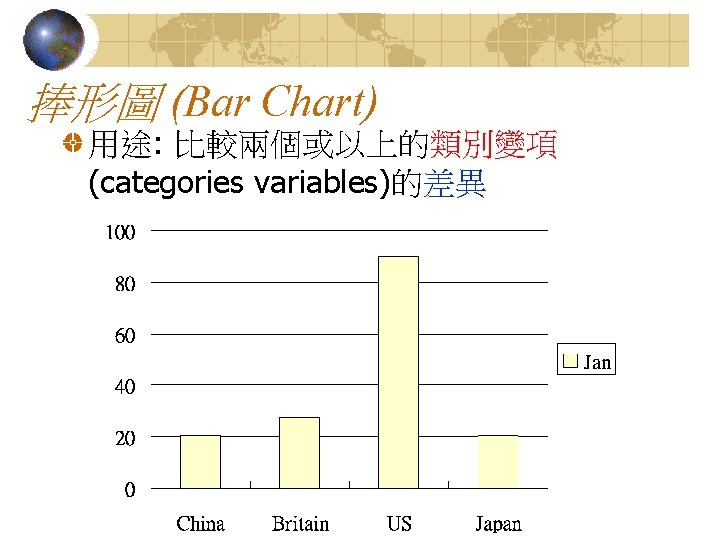
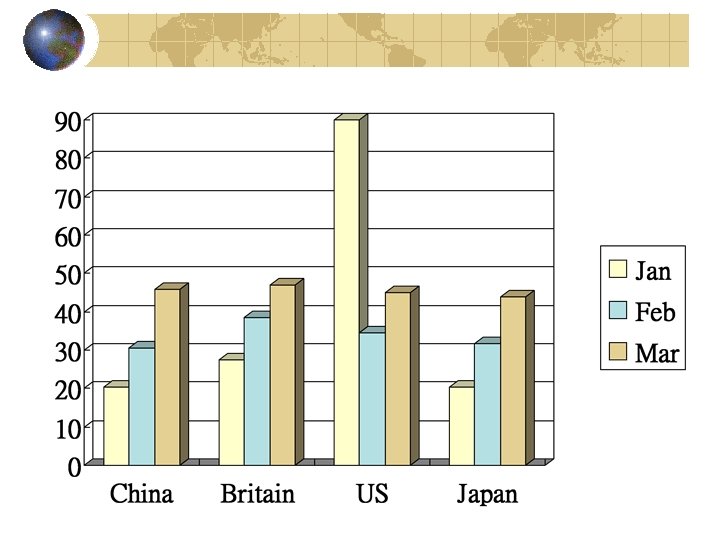
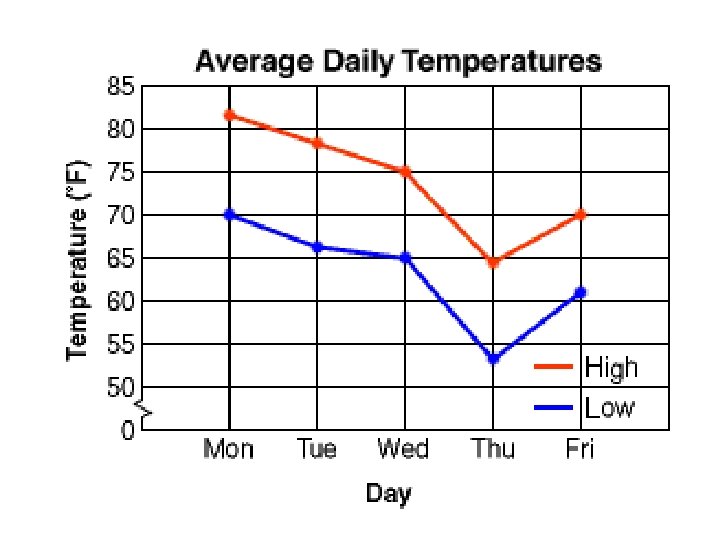
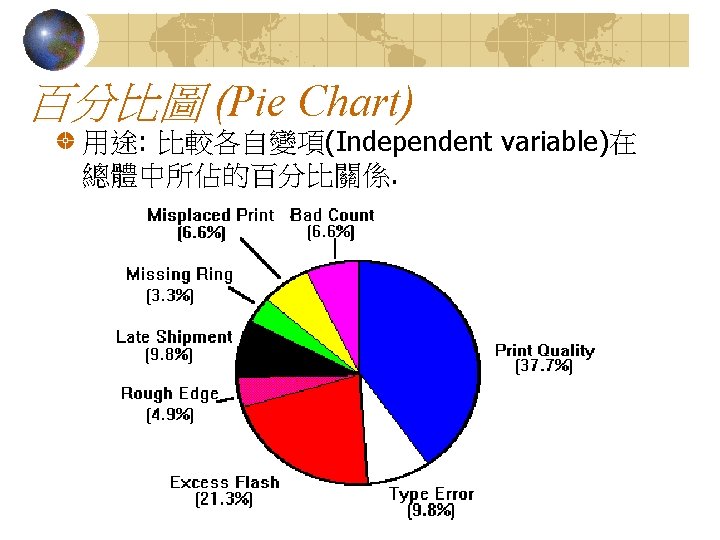
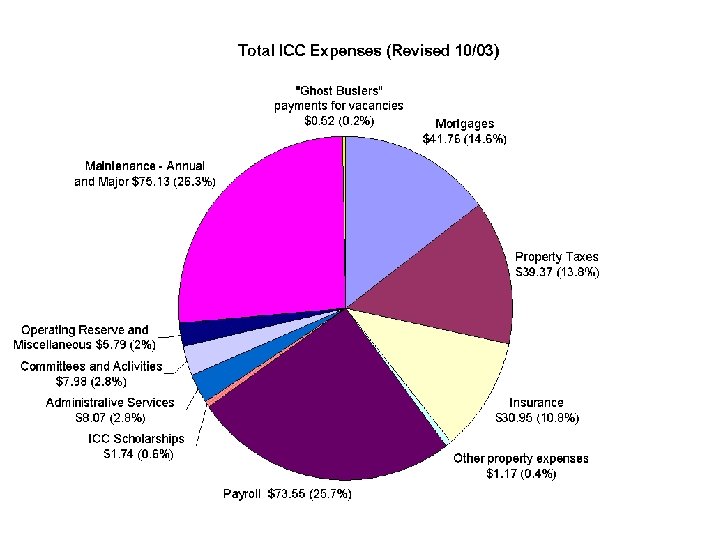
內容 棒形圖 (Bar Chart) 直方圖 (Histogram) 折線圖 (Line Graph) 百分比圖 (Pie Chart) 三角圖 (Triangular Graph)
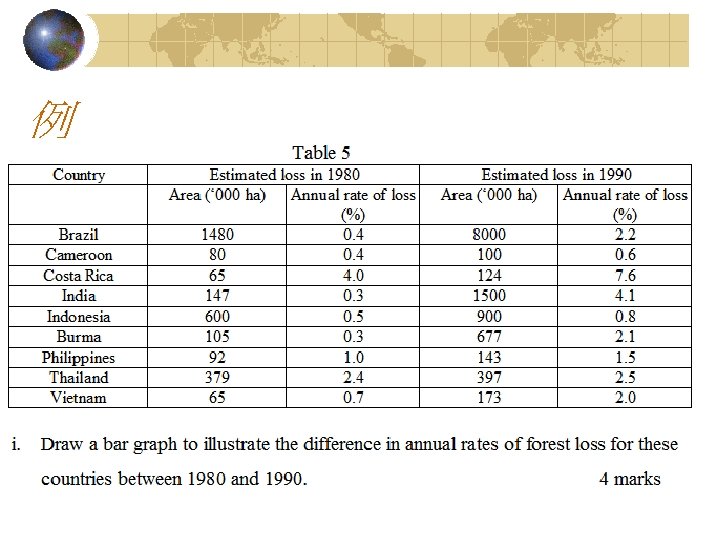
 The difference in annual rates of forest loss for countries between 1980 and")
(Countries) The difference in annual rates of forest loss for countries between 1980 and 1990
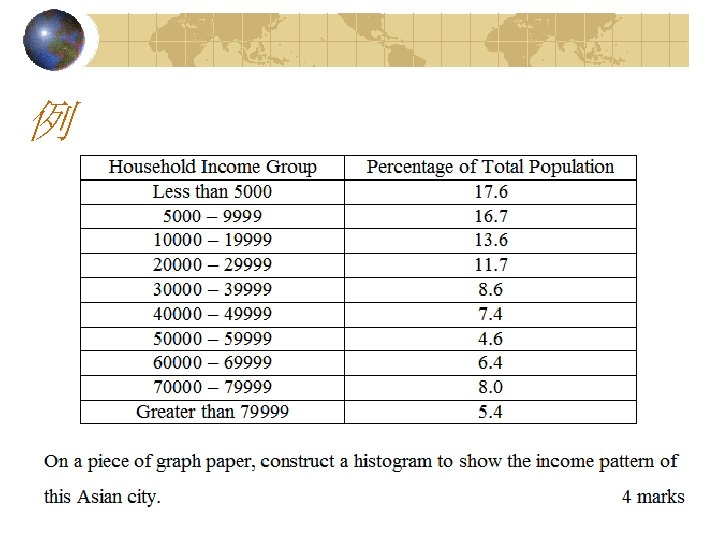

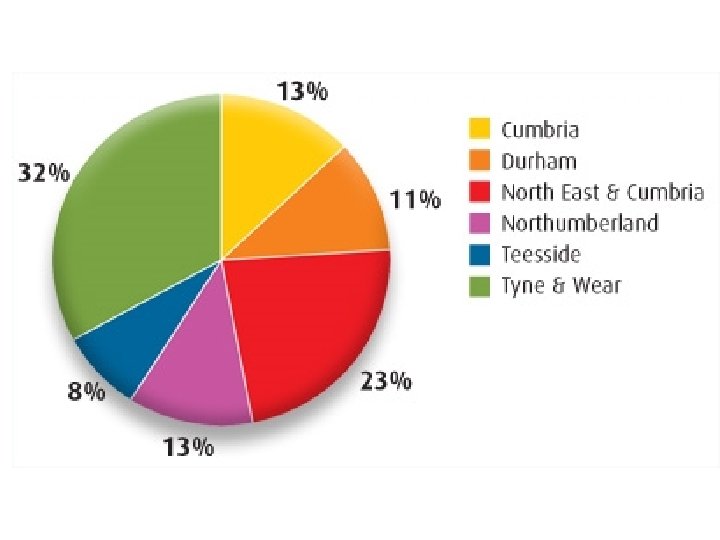
Income pattern of the Asian city

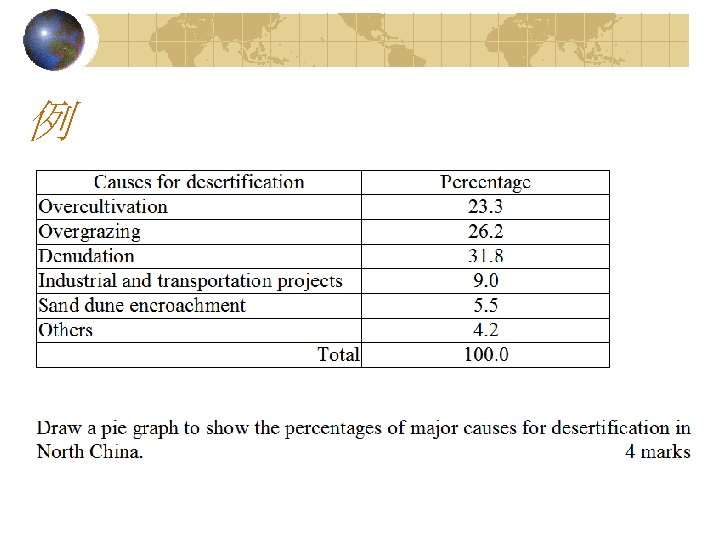

Overcultivation: 23. 3% • 23. 3/100 x 360 = 83. 88 o ~ 84 o Overgrazing: 26. 2% • 26. 2/100 x 360 = 94. 32 o ~ 94 o Denudation: 31. 8% • 31. 8/100 x 360 = 114. 48 o ~ 115 o Industrial…: 9. 0% • 9. 0/100 x 360 = 32. 4 o ~32 o Sand dune…. : 5. 5% • 5. 5/100 x 360 = 19. 8 o ~ 20 o Others: 4. 2% • 4. 2/100 x 360 = 15. 12 o ~ 15 o

Major causes for desertification in North China


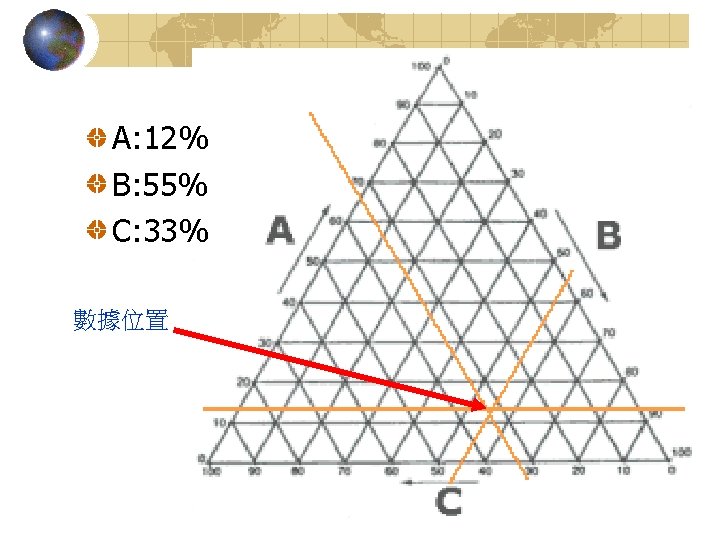
A: 12%

A: 12% B: 55%
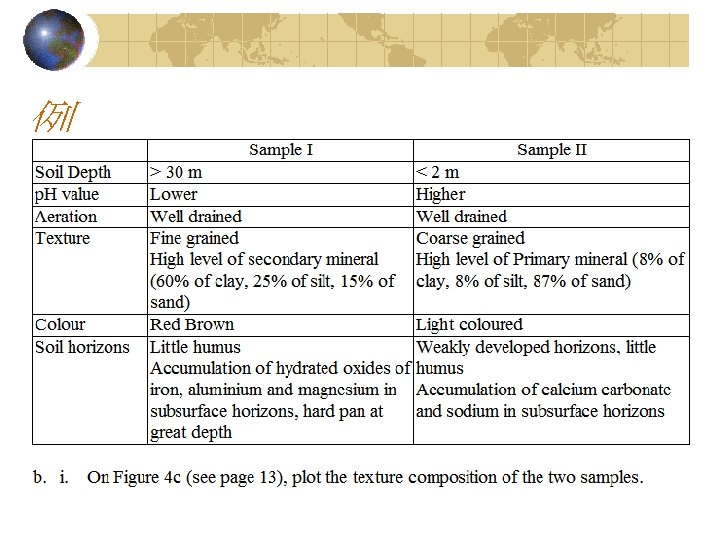

I 15% II 25%
- Slides: 36