Bar Chart Finding Averages Worksheet B The worksheet

Bar Chart – Finding Averages – Worksheet B The worksheet is in 2 sizes.

Printing To print handouts from slides Select the slide from the left. Then click: File > Print > ‘Print Current Slide’ To print multiple slides Click on a section title to highlight all those slides, or press ‘Ctrl’ at the same time as selecting slides to highlight more than one. Then click: File > Print > ‘Print Selection’ To print double-sided handouts Highlight both slides before using ‘Print Selection’. Choose ‘Print on Both Sides’ and ‘Flip on Short Edge’.

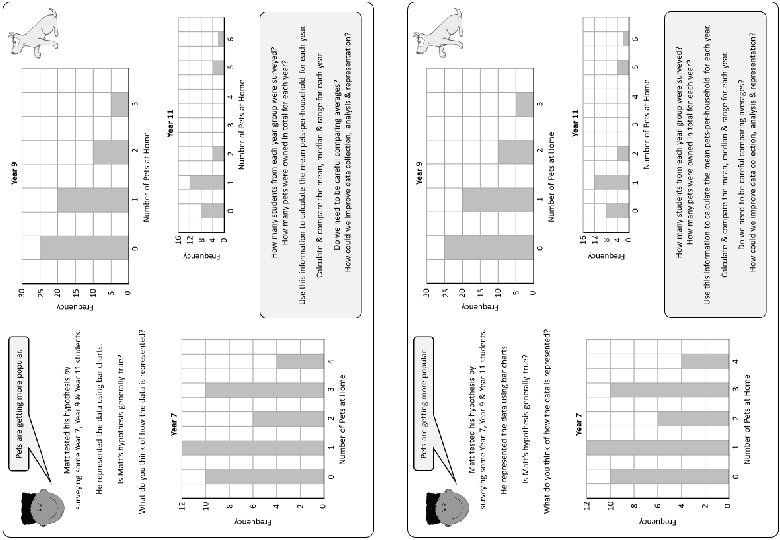
Pets are getting more popular. Year 9 30 Matt tested his hypothesis by surveying some Year 7, Year 9 & Year 11 students. He represented the data using bar charts. Is Matt’s hypothesis generally true? Frequency 25 20 15 10 5 0 0 What do you think of how the data is represented? Year 7 Frequency 12 Frequency 10 8 1 2 Number of Pets at Home 16 12 8 4 0 3 Year 11 0 1 2 3 4 Number of Pets at Home 5 6 6 How many students from each year group were surveyed? How many pets were owned in total for each year? 4 2 Use this information to calculate the mean pets-per-household for each year. 0 Calculate & compare the mean, median & range for each year. 0 1 2 3 Number of Pets at Home 4 Do we need to be careful comparing averages? How could we improve data collection, analysis & representation?

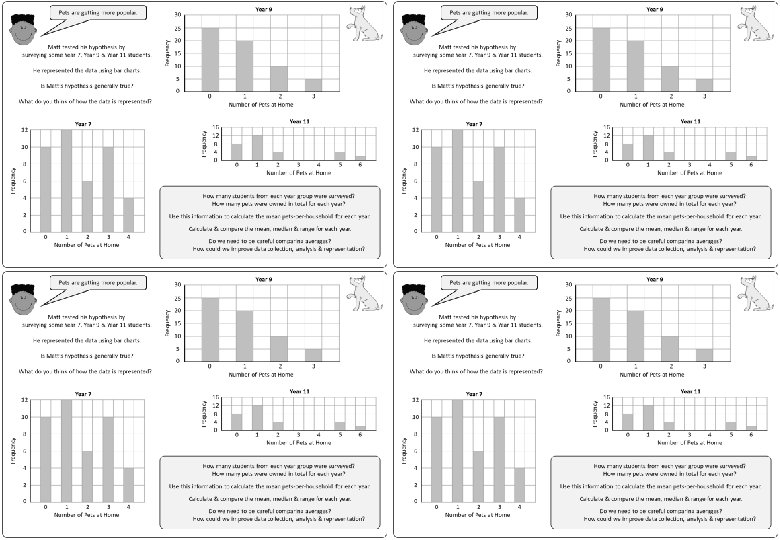
Pets are getting more popular. Year 9 30 60 students 55 pets = 0. 9 mean Mode = 0 Median = 1 Range = 3 Matt tested his hypothesis by surveying some Year 7, Year 9 & Year 11 students. He represented the data using bar charts. Frequency 25 Is Matt’s hypothesis generally true? 20 15 10 5 0 0 Year 7 12 Frequency 10 8 42 students 70 pets = 1. 7 mean Mode = 1 Median = 1 Range = 4 Frequency What do you think of how the data is represented? 1 2 Number of Pets at Home 16 12 8 4 0 30 students 52 pets = 1. 7 mean Mode = 1 Median = 1 Range = 6 3 Year 11 0 1 2 3 4 Number of Pets at Home 5 6 6 How many students from each year group were surveyed? How many pets were owned in total for each year? 4 2 Use this information to calculate the mean pets-per-household for each year. 0 Calculate & compare the mean, median & range for each year. 0 1 2 3 Number of Pets at Home 4 Do we need to be careful comparing averages? How could we improve data collection, analysis & representation?

Pets are getting more popular. Year 9 30 Matt tested his hypothesis by surveying some Year 7, Year 9 & Year 11 students. He represented the data using bar charts. Is Matt’s hypothesis generally true? Frequency 25 20 15 10 5 0 0 What do you think of how the data is represented? Year 7 Frequency 12 Frequency 10 8 1 2 Number of Pets at Home 16 12 8 4 0 3 Year 11 0 1 2 3 4 Number of Pets at Home 5 6 6 How many students from each year group were surveyed? How many pets were owned in total for each year? 4 2 Use this information to calculate the mean pets-per-household for each year. 0 Calculate & compare the mean, median & range for each year. 0 1 2 3 Number of Pets at Home 4 Do we need to be careful comparing averages? How could we improve data collection, analysis & representation?

Questions? Comments? Suggestions? …or have you found a mistake!? Any feedback would be appreciated . Please feel free to email: tom@goteachmaths. co. uk
- Slides: 8