Bar Chart Finding Averages Worksheet A The worksheet

Bar Chart – Finding Averages – Worksheet A The worksheet is in 2 sizes.

Printing To print handouts from slides Select the slide from the left. Then click: File > Print > ‘Print Current Slide’ To print multiple slides Click on a section title to highlight all those slides, or press ‘Ctrl’ at the same time as selecting slides to highlight more than one. Then click: File > Print > ‘Print Selection’ To print double-sided handouts Highlight both slides before using ‘Print Selection’. Choose ‘Print on Both Sides’ and ‘Flip on Short Edge’.
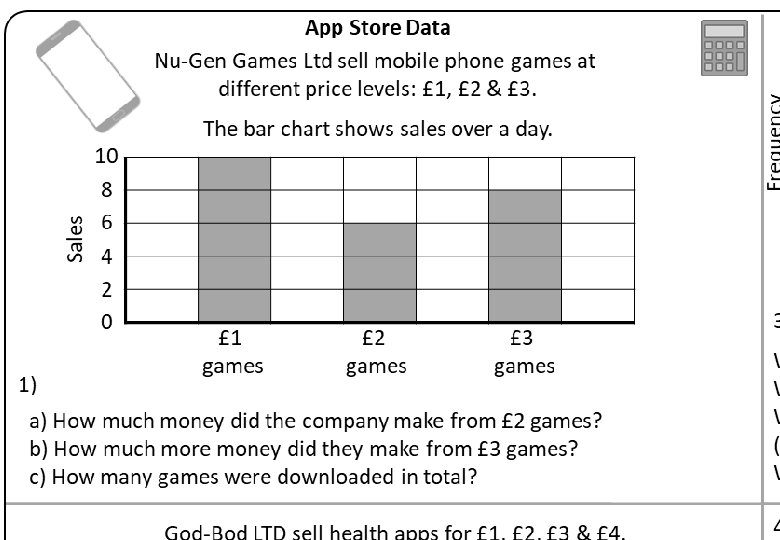

Frequency Bubble Games records the ages of people who play its games. 30 25 Age 20 10 15 11 10 12 5 13 0 10 11 12 13 Player Age 3) Complete a frequency table to help answer these questions: The bar chart shows sales over a day. 10 8 6 4 2 0 £ 1 games 1) £ 2 games £ 3 games What is the range of player ages? What is the mode age? What is the median age? (imagine putting all the players in age order & picking the middle player) What is the mean age of the players? a) How much money did the company make from £ 2 games? b) How much more money did they make from £ 3 games? c) How many games were downloaded in total? 4) Tim & Jim both play Berserk Battle. Every day they played in June, they recorded how long they spent playing (to the nearest 10 minutes). Frequency God-Bod LTD sell health apps for £ 1, £ 2, £ 3 & £ 4. The bar chart shows sales over a week. 12 10 8 6 4 2 0 £ 1 £ 2 £ 3 App Price £ 4 App Price Frequency (£) 1 2 3 4 2) Complete the frequency table to help with these questions. a) How many apps were sold in total? b) How much money did the company make in total? c) Use this information to calculate the mean average sale value. Total Spent The dual bar chart shows this data. Frequency Sales App Store Data Nu-Gen Games Ltd sell mobile phone games at different price levels: £ 1, £ 2 & £ 3. Key 6 Tim 4 Jim 2 0 20 30 40 Minutes playing 50 a) Who spent the most time playing? b) Who played on the most days? b) Compare the mean & median time spent playing for Tim & Jim

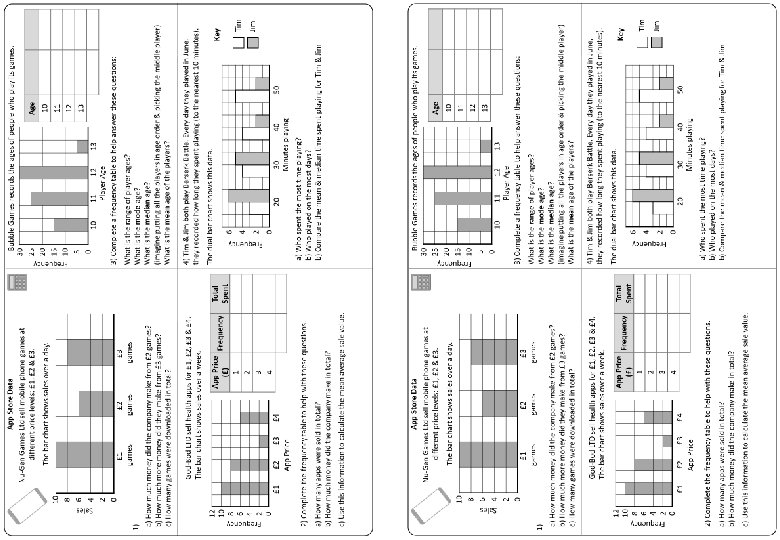
Frequency Bubble Games records the ages of people who play its games. 30 25 Age 20 10 15 11 10 12 5 13 0 10 11 12 13 Player Age 3) Complete a frequency table to help answer these questions: The bar chart shows sales over a day. 10 8 6 4 2 0 £ 1 games 1) £ 2 games £ 3 games £ 2 × 6 = £ 12 a) How much money did the company make from £ 2 games? b) How much more money did they make from £ 3 games? £ 3 × 8 = £ 24 £ 12 more c) How many games were downloaded in total? 24 4) Tim & Jim both play Berserk Battle. Every day they played in June, they recorded how long they spent playing (to the nearest 10 minutes). Frequency God-Bod LTD sell health apps for £ 1, £ 2, £ 3 & £ 4. The bar chart shows sales over a week. 12 10 8 6 4 2 0 £ 1 £ 2 £ 3 App Price £ 4 App Price Frequency (£) 1 10 2 8 3 2 4 6 26 2) Complete the frequency table to help with these questions. a) How many apps were sold in total? 26 b) How much money did the company make in total? £ 56 c) Use this information to calculate the mean average sale value. £ 56 ÷ 26 = £ 2. 15 What is the range of player ages? What is the mode age? What is the median age? (imagine putting all the players in age order & picking the middle player) What is the mean age of the players? Total Spent 10 16 6 24 56 The dual bar chart shows this data. Frequency Sales App Store Data Nu-Gen Games Ltd sell mobile phone games at different price levels: £ 1, £ 2 & £ 3. Key 6 Tim 4 Jim 2 0 20 30 40 Minutes playing 50 a) Who spent the most time playing? b) Who played on the most days? b) Compare the mean & median time spent playing for Tim & Jim

Frequency Bubble Games records the ages of people who play its games. 30 25 Age Frequency Total Age 20 10 15 150 15 11 25 275 10 12 30 360 5 13 5 65 0 75 850 10 11 12 13 Player Age 3) Complete a frequency table to help answer these questions: The bar chart shows sales over a day. 10 8 6 4 2 0 £ 1 games 1) £ 2 games £ 3 games 3 years £ 2 × 6 = £ 12 a) How much money did the company make from £ 2 games? b) How much more money did they make from £ 3 games? £ 3 × 8 = £ 24 £ 12 more c) How many games were downloaded in total? 24 4) Tim & Jim both play Berserk Battle. Every day they played in June, they recorded how long they spent playing (to the nearest 10 minutes). Frequency God-Bod LTD sell health apps for £ 1, £ 2, £ 3 & £ 4. The bar chart shows sales over a week. 12 10 8 6 4 2 0 £ 1 £ 2 £ 3 App Price £ 4 App Price Frequency (£) 1 10 2 8 3 2 4 6 26 2) Complete the frequency table to help with these questions. a) How many apps were sold in total? 26 b) How much money did the company make in total? £ 56 c) Use this information to calculate the mean average sale value. £ 56 ÷ 26 = £ 2. 15 What is the range of player ages? 12 years old What is the mode age? What is the median age? 38 th player = 11 player) years old (imagine putting all the players in age order & picking the middle What is the mean age of the players? 850 ÷ 75 = 11. 3 years old Total Spent 10 16 6 24 56 The dual bar chart shows this data. Frequency Sales App Store Data Nu-Gen Games Ltd sell mobile phone games at different price levels: £ 1, £ 2 & £ 3. Key 6 Tim 4 Jim 2 0 20 30 40 Minutes playing 50 a) Who spent the most time playing? b) Who played on the most days? b) Compare the mean & median time spent playing for Tim & Jim Tim Jim 590 minutes 450 minutes 16 days playing 15 days playing 36. 9 minute mean 30 minute mean 40 minute median 30 minute median

Frequency Bubble Games records the ages of people who play its games. 30 25 Age 20 10 15 11 10 12 5 13 0 10 11 12 13 Player Age 3) Complete a frequency table to help answer these questions: The bar chart shows sales over a day. 10 8 6 4 2 0 £ 1 games 1) £ 2 games £ 3 games What is the range of player ages? What is the mode age? What is the median age? (imagine putting all the players in age order & picking the middle player) What is the mean age of the players? a) How much money did the company make from £ 2 games? b) How much more money did they make from £ 3 games? c) How many games were downloaded in total? 4) Tim & Jim both play Berserk Battle. Every day they played in June, they recorded how long they spent playing (to the nearest 10 minutes). Frequency God-Bod LTD sell health apps for £ 1, £ 2, £ 3 & £ 4. The bar chart shows sales over a week. 12 10 8 6 4 2 0 £ 1 £ 2 £ 3 App Price £ 4 App Price Frequency (£) 1 2 3 4 2) Complete the frequency table to help with these questions. a) How many apps were sold in total? b) How much money did the company make in total? c) Use this information to calculate the mean average sale value. Total Spent The dual bar chart shows this data. Frequency Sales App Store Data Nu-Gen Games Ltd sell mobile phone games at different price levels: £ 1, £ 2 & £ 3. Key 6 Tim 4 Jim 2 0 20 30 40 Minutes playing 50 a) Who spent the most time playing? b) Who played on the most days? b) Compare the mean & median time spent playing for Tim & Jim

Questions? Comments? Suggestions? …or have you found a mistake!? Any feedback would be appreciated . Please feel free to email: tom@goteachmaths. co. uk
- Slides: 9