
Banco Ita Holding Financeira S A Alfredo Setubal
Banco Itaú Holding Financeira S. A. Alfredo Setubal Investor Relations Director November 17 th, 2003

Agenda Highlights Results » Statement of Income » Balance Sheet Focus on Corporate Governance
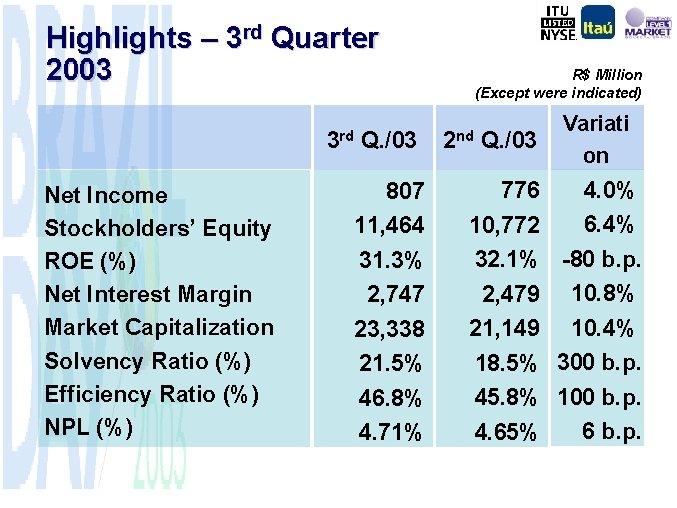
Highlights – 3 rd Quarter 2003 3 rd Net Income Stockholders’ Equity ROE (%) Net Interest Margin Market Capitalization Solvency Ratio (%) Efficiency Ratio (%) NPL (%) Q. /03 807 11, 464 31. 3% 2, 747 23, 338 21. 5% 46. 8% 4. 71% R$ Million (Except were indicated) 2 nd Q. /03 Variati on 4. 0% 776 6. 4% 10, 772 32. 1% -80 b. p. 2, 479 10. 8% 21, 149 10. 4% 18. 5% 300 b. p. 45. 8% 100 b. p. 6 b. p. 4. 65%
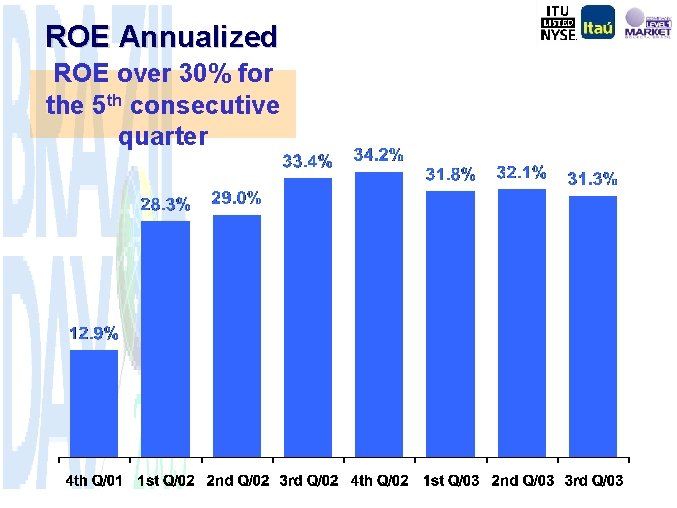
ROE Annualized ROE over 30% for the 5 th consecutive quarter
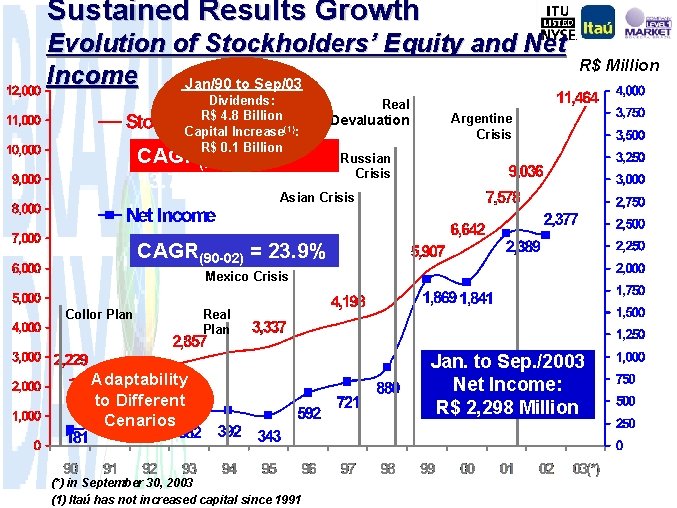
Sustained Results Growth Evolution of Stockholders’ Equity and Net Income Jan/90 to Sep/03 Dividends: R$ 4. 8 Billion Capital Increase(1): R$ 0. 1 Billion CAGR(90 -S 03) = 13. 7% Real Devaluation R$ Million Argentine Crisis Russian Crisis Asian Crisis CAGR(90 -02) = 23. 9% Mexico Crisis Collor Plan Real Plan Adaptability to Different Cenarios (*) in September 30, 2003 (1) Itaú has not increased capital since 1991 Jan. to Sep. /2003 Net Income: R$ 2, 298 Million
Agenda Highlights Results » Statement of Income » Balance Sheet Focus on Corporate Governance
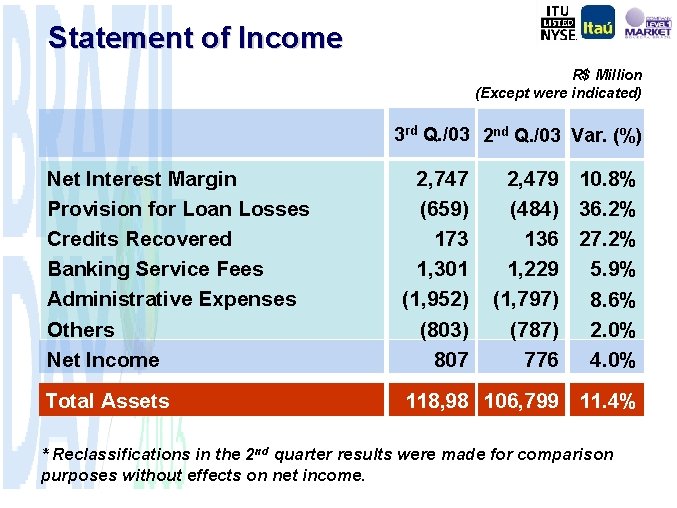
Statement of Income R$ Million (Except were indicated) 3 rd Q. /03 2 nd Q. /03 Var. (%) Net Interest Margin Provision for Loan Losses Credits Recovered Banking Service Fees Administrative Expenses Others Net Income 2, 747 (659) 173 1, 301 (1, 952) (803) 807 2, 479 10. 8% (484) 36. 2% 136 27. 2% 1, 229 5. 9% (1, 797) 8. 6% (787) 2. 0% 776 4. 0% Total Assets 118, 98 106, 799 11. 4% 2 * Reclassifications in the 2 nd quarter results were made for comparison purposes without effects on net income.
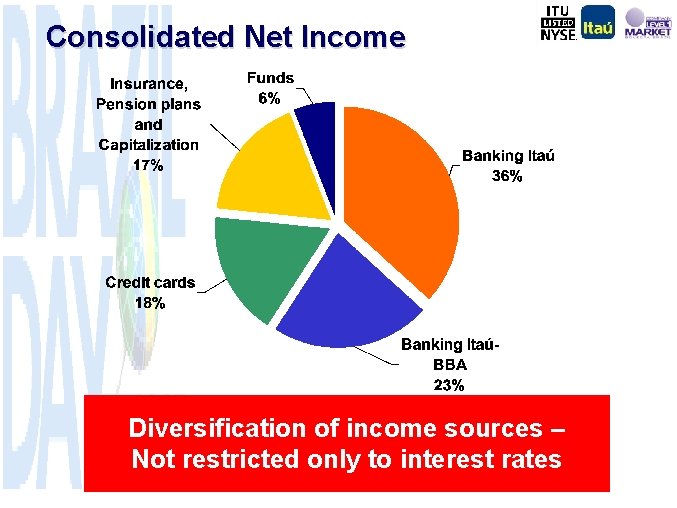
Consolidated Net Income Diversification of income sources – Not restricted only to interest rates
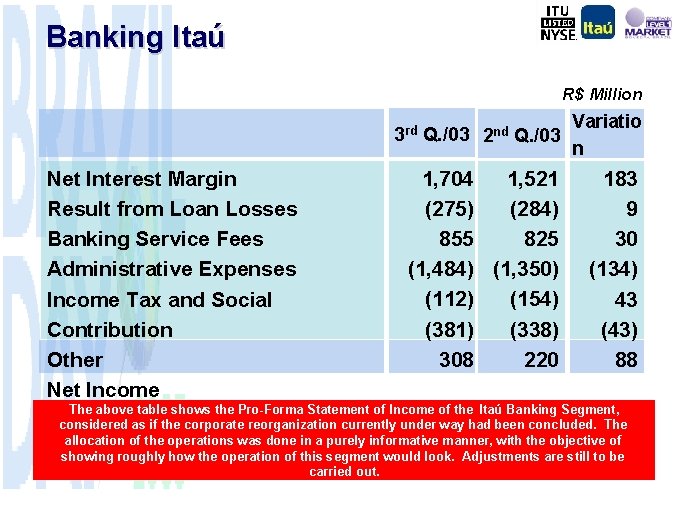
Banking Itaú R$ Million 3 rd Net Interest Margin Result from Loan Losses Banking Service Fees Administrative Expenses Income Tax and Social Contribution Other Net Income Q. /03 2 nd Variatio Q. /03 n 1, 704 1, 521 (275) (284) 855 825 (1, 484) (1, 350) (112) (154) (381) (338) 308 220 183 9 30 (134) 43 (43) 88 The above table shows the Pro-Forma Statement of Income of the Itaú Banking Segment, considered as if the corporate reorganization currently under way had been concluded. The allocation of the operations was done in a purely informative manner, with the objective of showing roughly how the operation of this segment would look. Adjustments are still to be carried out.
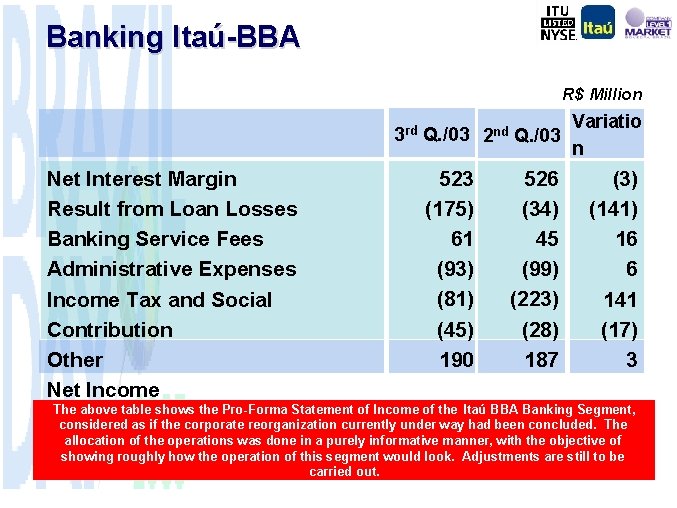
Banking Itaú-BBA R$ Million 3 rd Net Interest Margin Result from Loan Losses Banking Service Fees Administrative Expenses Income Tax and Social Contribution Other Net Income Q. /03 523 (175) 61 (93) (81) (45) 190 2 nd Variatio Q. /03 n 526 (34) 45 (99) (223) (28) 187 (3) (141) 16 6 141 (17) 3 The above table shows the Pro-Forma Statement of Income of the Itaú BBA Banking Segment, considered as if the corporate reorganization currently under way had been concluded. The allocation of the operations was done in a purely informative manner, with the objective of showing roughly how the operation of this segment would look. Adjustments are still to be carried out.
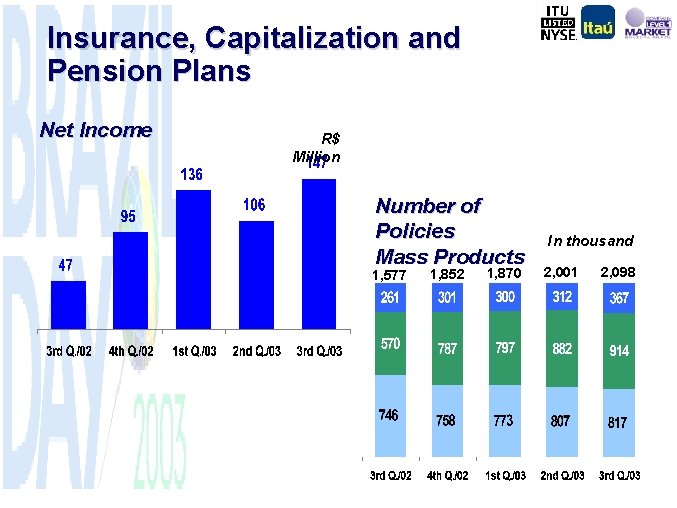
Insurance, Capitalization and Pension Plans Net Income R$ Million Number of Policies Mass Products 1, 577 1, 852 1, 870 In thousand 2, 001 2, 098
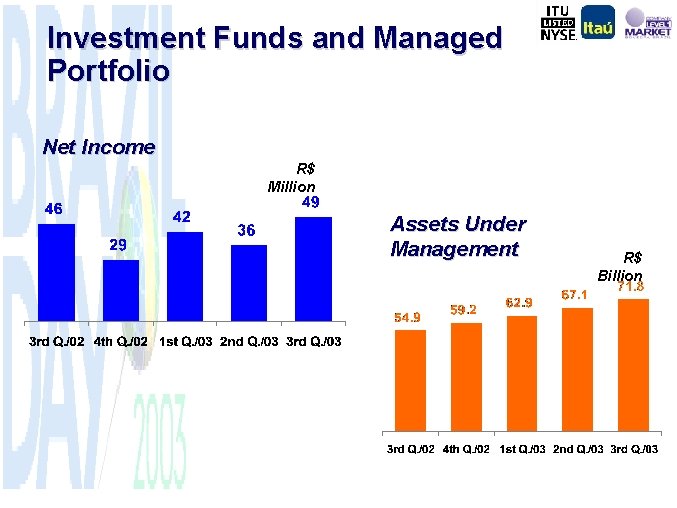
Investment Funds and Managed Portfolio Net Income R$ Million Assets Under Management R$ Billion
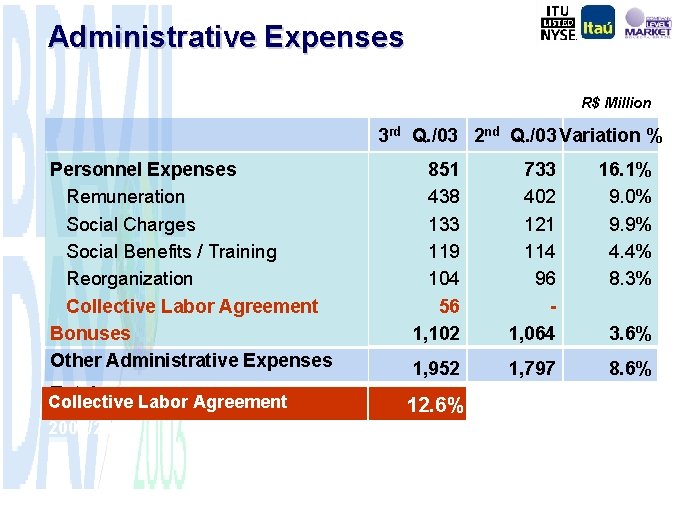
Administrative Expenses R$ Million 3 rd Q. /03 2 nd Q. /03 Variation % Personnel Expenses Remuneration Social Charges Social Benefits / Training Reorganization Collective Labor Agreement Bonuses Other Administrative Expenses Total Collective Labor Agreement 2003/2004 851 438 133 119 104 56 1, 102 733 402 121 114 96 1, 064 16. 1% 9. 0% 9. 9% 4. 4% 8. 3% 1, 952 1, 797 8. 6% 12. 6% 3. 6%
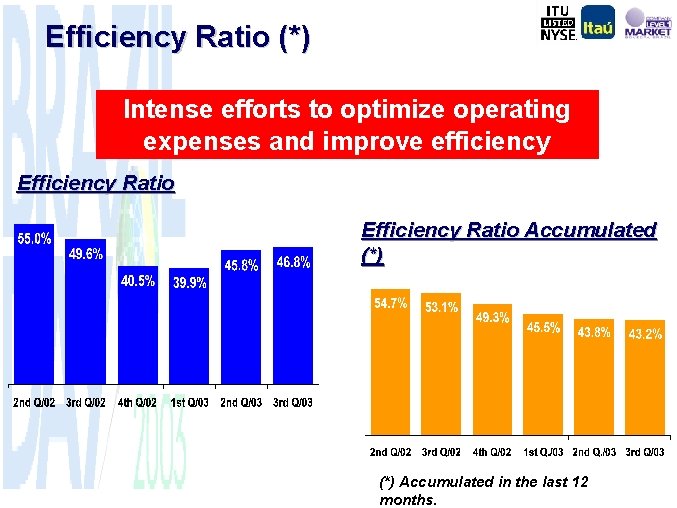
Efficiency Ratio (*) Intense efforts to optimize operating expenses and improve efficiency Efficiency Ratio Accumulated (*) Accumulated in the last 12 months.

Agenda Highlights Results » Statement of Income » Balance Sheet Focus on Corporate Governance
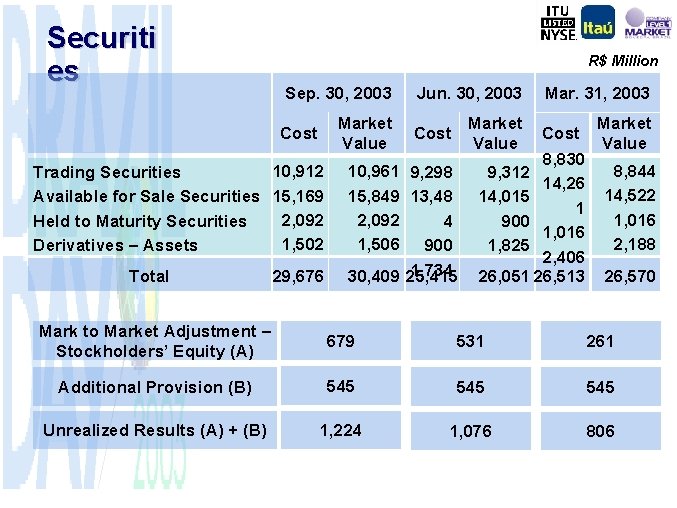
Securiti es R$ Million Sep. 30, 2003 Market Value Cost 10, 912 Trading Securities Available for Sale Securities 15, 169 2, 092 Held to Maturity Securities 1, 502 Derivatives – Assets Total 29, 676 Jun. 30, 2003 Market Value Cost 10, 961 9, 298 15, 849 13, 48 2, 092 4 1, 506 900 1, 734 30, 409 25, 415 Mar. 31, 2003 Cost 8, 830 9, 312 14, 26 14, 015 1 900 1, 016 1, 825 2, 406 26, 051 26, 513 Market Value 8, 844 14, 522 1, 016 2, 188 26, 570 Mark to Market Adjustment – Stockholders’ Equity (A) 679 531 261 Additional Provision (B) 545 545 Unrealized Results (A) + (B) 1, 224 1, 076 806
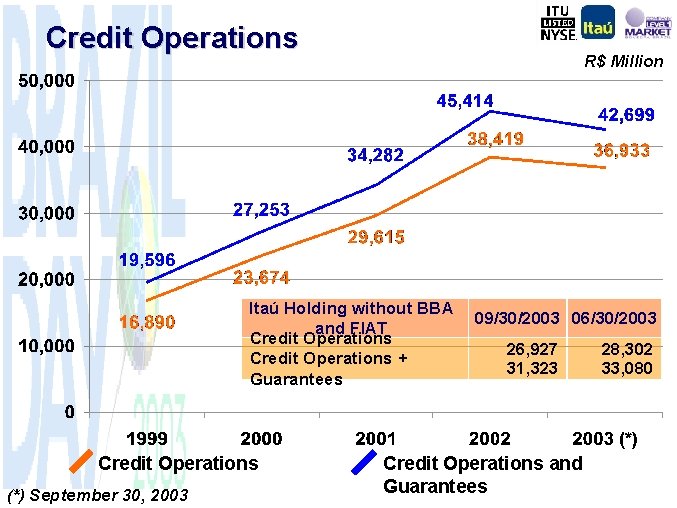
Credit Operations R$ Million Itaú Holding without BBA and FIAT Credit Operations + Guarantees Credit Operations (*) September 30, 2003 09/30/2003 06/30/2003 26, 927 31, 323 Credit Operations and Guarantees 28, 302 33, 080
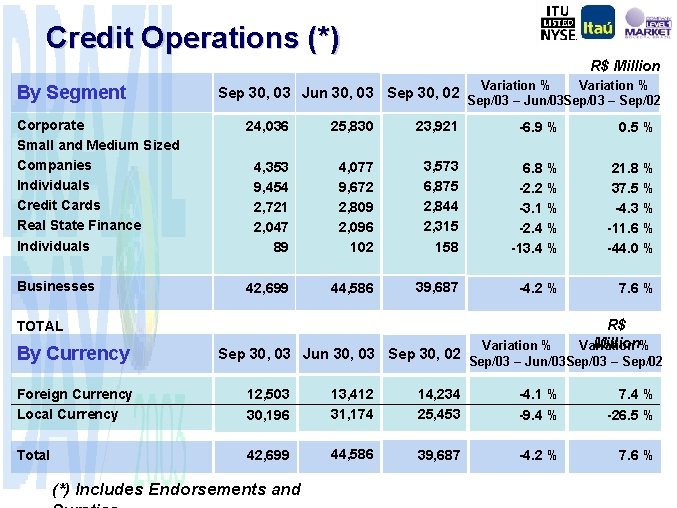
Credit Operations (*) R$ Million By Segment Variation % Sep 30, 03 Jun 30, 03 Sep 30, 02 Sep/03 – Jun/03 Sep/03 – Sep/02 Corporate Small and Medium Sized Companies Individuals Credit Cards Real State Finance Individuals 24, 036 25, 830 23, 921 -6. 9 % 0. 5 % 4, 353 9, 454 2, 721 2, 047 89 4, 077 9, 672 2, 809 2, 096 102 3, 573 6, 875 2, 844 2, 315 158 6. 8 % -2. 2 % -3. 1 % -2. 4 % -13. 4 % 21. 8 % 37. 5 % -4. 3 % -11. 6 % -44. 0 % Businesses 42, 699 44, 586 39, 687 -4. 2 % 7. 6 % TOTAL By Currency Foreign Currency Local Currency Total Variation % R$ Million% Variation Sep 30, 03 Jun 30, 03 Sep 30, 02 Sep/03 – Jun/03 Sep/03 – Sep/02 12, 503 30, 196 13, 412 31, 174 14, 234 25, 453 -4. 1 % -9. 4 % 7. 4 % -26. 5 % 42, 699 44, 586 39, 687 -4. 2 % 7. 6 % (*) Includes Endorsements and
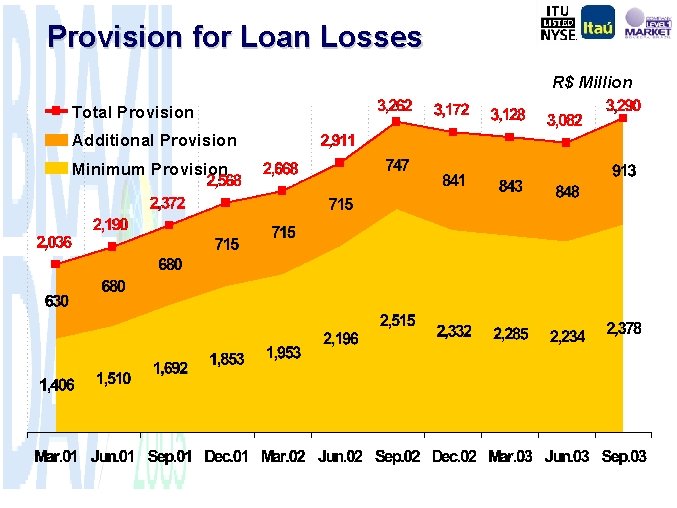
Provision for Loan Losses R$ Million Total Provision Additional Provision Minimum Provision
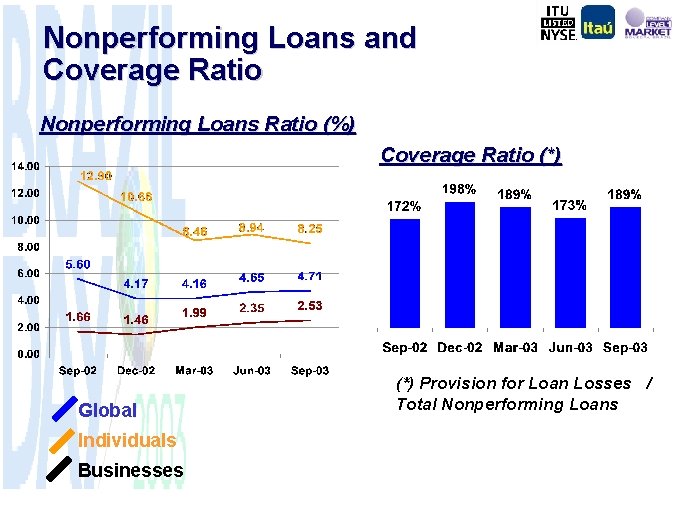
Nonperforming Loans and Coverage Ratio Nonperforming Loans Ratio (%) Coverage Ratio (*) Global Individuals Businesses (*) Provision for Loan Losses / Total Nonperforming Loans
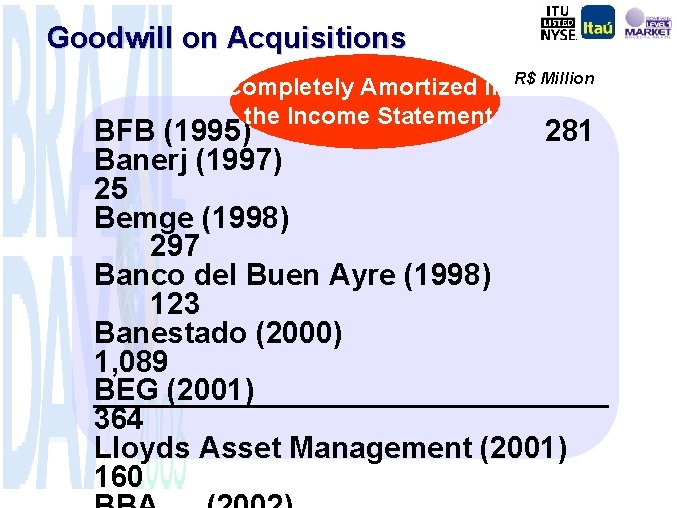
Goodwill on Acquisitions Completely Amortized in the Income Statement R$ Million BFB (1995) 281 Banerj (1997) 25 Bemge (1998) 297 Banco del Buen Ayre (1998) 123 Banestado (2000) 1, 089 BEG (2001) 364 Lloyds Asset Management (2001) 160
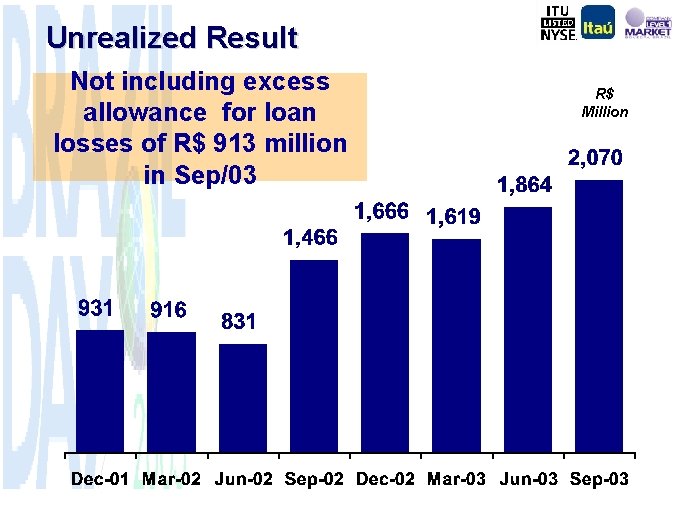
Unrealized Result Not including excess allowance for loan losses of R$ 913 million in Sep/03 R$ Million

Agenda Highlights Results » Statement of Income » Balance Sheet Focus on Corporate Governance
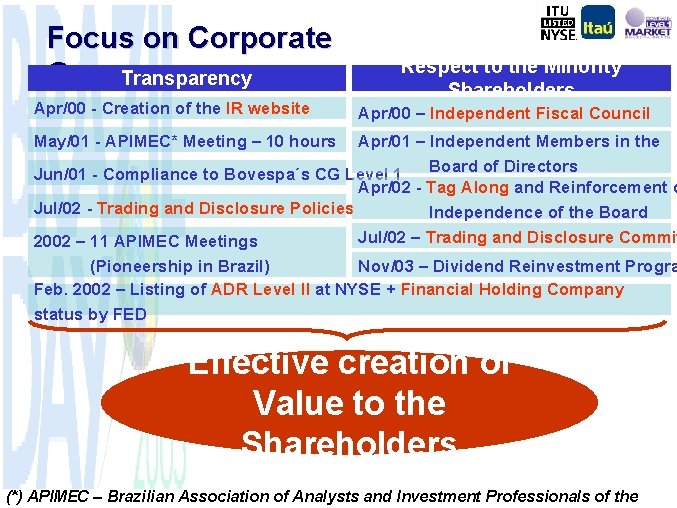
Focus on Corporate Governance Transparency Apr/00 - Creation of the IR website Respect to the Minority Shareholders Apr/00 – Independent Fiscal Council May/01 - APIMEC* Meeting – 10 hours Apr/01 – Independent Members in the Board of Directors Jun/01 - Compliance to Bovespa´s CG Level 1 Apr/02 - Tag Along and Reinforcement o Jul/02 - Trading and Disclosure Policies Independence of the Board Jul/02 – Trading and Disclosure Commit 2002 – 11 APIMEC Meetings (Pioneership in Brazil) Nov/03 – Dividend Reinvestment Progra Feb. 2002 – Listing of ADR Level II at NYSE + Financial Holding Company status by FED Effective creation of Value to the Shareholders (*) APIMEC – Brazilian Association of Analysts and Investment Professionals of the
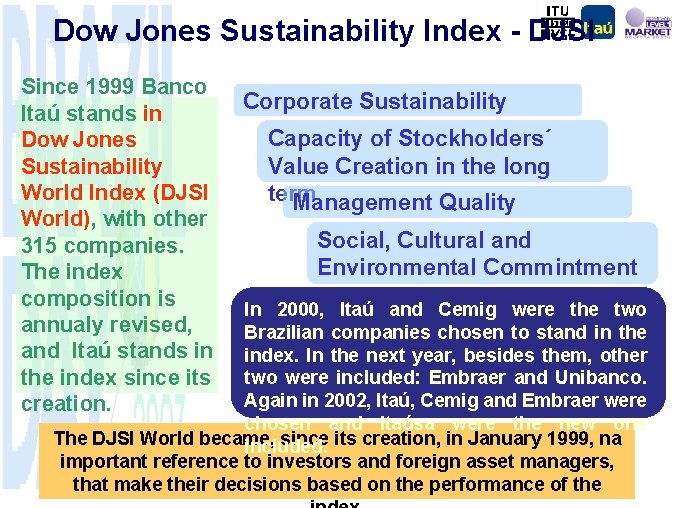
Dow Jones Sustainability Index - DJSI Since 1999 Banco Itaú stands in Dow Jones Sustainability World Index (DJSI World), with other 315 companies. The index composition is annualy revised, and Itaú stands in the index since its creation. Corporate Sustainability Capacity of Stockholders´ Value Creation in the long term Management Quality Social, Cultural and Environmental Commintment In 2000, Itaú and Cemig were the two Brazilian companies chosen to stand in the index. In the next year, besides them, other two were included: Embraer and Unibanco. Again in 2002, Itaú, Cemig and Embraer were chosen and Itaúsa were the new one The DJSI World became, since its creation, in January 1999, na included. important reference to investors and foreign asset managers, that make their decisions based on the performance of the
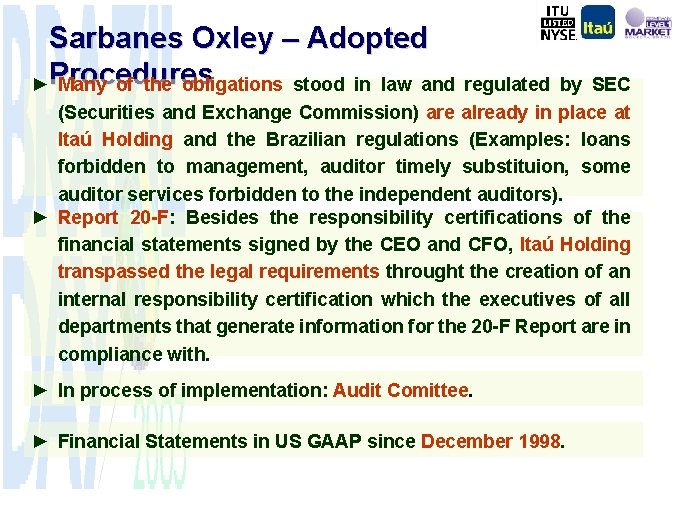
Sarbanes Oxley – Adopted ►Procedures Many of the obligations stood in law and regulated by SEC (Securities and Exchange Commission) are already in place at Itaú Holding and the Brazilian regulations (Examples: loans forbidden to management, auditor timely substituion, some auditor services forbidden to the independent auditors). ► Report 20 -F: Besides the responsibility certifications of the financial statements signed by the CEO and CFO, Itaú Holding transpassed the legal requirements throught the creation of an internal responsibility certification which the executives of all departments that generate information for the 20 -F Report are in compliance with. ► In process of implementation: Audit Comittee. ► Financial Statements in US GAAP since December 1998.
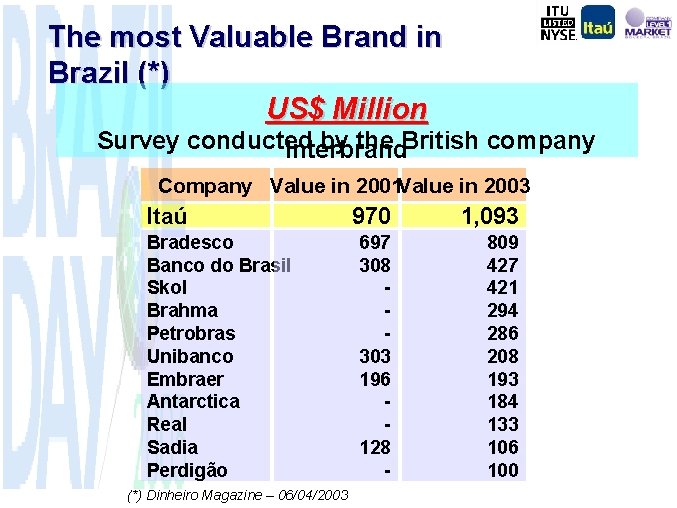
The most Valuable Brand in Brazil (*) US$ Million Survey conducted by the British company Interbrand Company Value in 2001 Value in 2003 Itaú Bradesco Banco do Brasil Skol Brahma Petrobras Unibanco Embraer Antarctica Real Sadia Perdigão (*) Dinheiro Magazine – 06/04/2003 970 1, 093 697 308 303 196 128 - 809 427 421 294 286 208 193 184 133 106 100
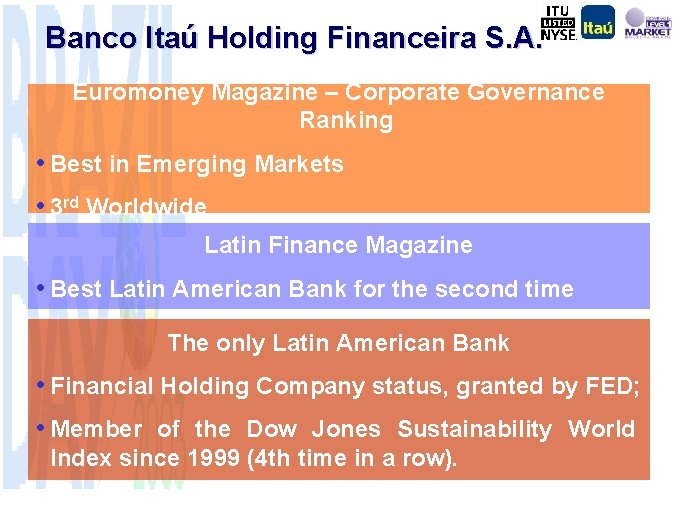
Banco Itaú Holding Financeira S. A. Euromoney Magazine – Corporate Governance Ranking • Best in Emerging Markets • 3 rd Worldwide Latin Finance Magazine • Best Latin American Bank for the second time The only Latin American Bank • Financial Holding Company status, granted by FED; • Member of the Dow Jones Sustainability World Index since 1999 (4 th time in a row).
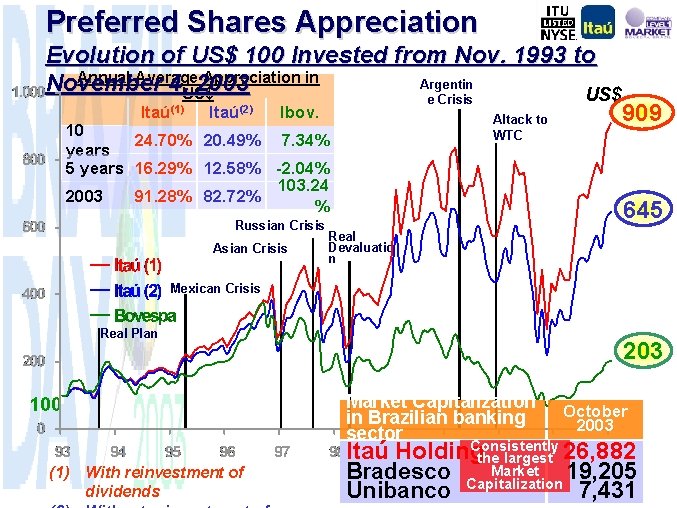
Preferred Shares Appreciation Evolution of US$ 100 Invested from Nov. 1993 to Annual Average Appreciation in Argentin November 4, US$ 2003 US$ e Crisis Itaú(1) Itaú(2) Ibov. Altack to WTC 10 24. 70% 20. 49% 7. 34% years 5 years 16. 29% 12. 58% -2. 04% 103. 24 91. 28% 82. 72% 2003 % Russian Crisis Asian Crisis 909 645 Real Devaluatio n Mexican Crisis Real Plan 100 (1) With reinvestment of dividends 203 Market Capitalization in Brazilian banking sector October 2003 Consistently Itaú Holding the largest 26, 882 Market Bradesco Capitalization 19, 205 Unibanco 7, 431
Banco Itaú Holding Financeira S. A. Alfredo Setubal Investor Relations Director November 17 th, 2003
- Slides: 30