BAME Elders Co Housing Mary Seacole Extra Care

BAME Elders & Co -Housing
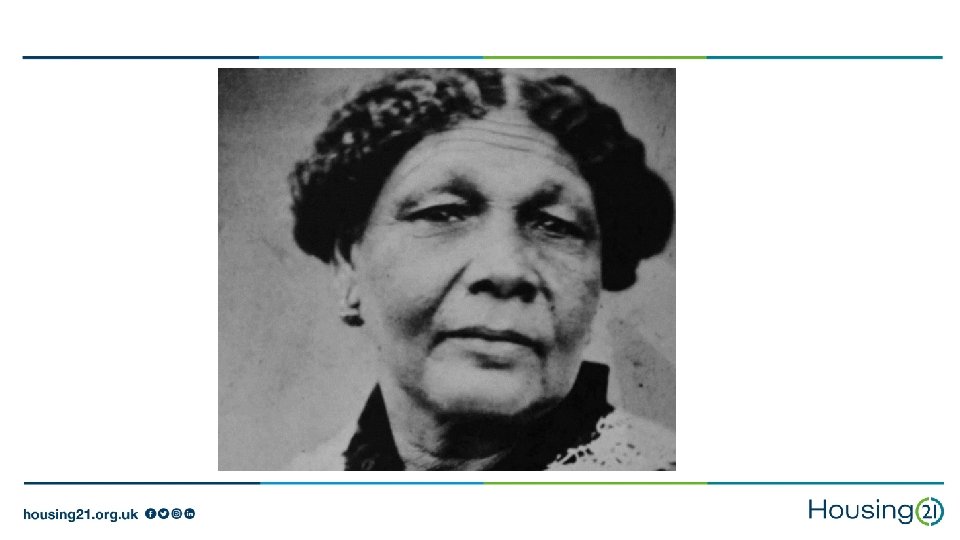

Mary Seacole Extra Care Court – Bradford

Mary Seacole Extra Care Court– Bradford • Commissioned in 2003 by Bradford City Council to provide BME focussed scheme to reflect the local community • Developed with the intention of primarily providing for African-Caribbean Elders in conjunction with community groups – FACE (Federation of African Caribbean Elders). Postcode for this area had the highest incidence of African Caribbean Elders in the Bradford • Nominations agreement specifies 40% of residents should be BME ( currently 48%) • 40 apartments with on site facilities including restaurant, internet café , laundry and hair salon

Housing 21 – Who we are……. • a not for profit organisation with a social purpose providing homes for older people of modest means • promote independence and choice for older people through good quality housing, care and support. • operate in over 150 local authority areas managing around 19, 000 Retirement and Extra Care apartments • Head Office is based in Birmingham • Stephen Hughes is our Chair & Bruce Moore our CEO
")
Housing & Older ethnic minority population in England Race Equality Foundation report (Feb 2019) – key findings; • Bangladeshi & black African people were most likely to be housing deprived • Black & Asian people have lower life expectancy and more likely to experience more years of disability or living in poor health • Lower rates of home ownership for BAME groups aged 50 -64 compared to those over 65 suggest levels of housing deprivation will increase over time • BAME older people concentrated in urban areas in & around London and major cities
 Birmingham has a")
Ethnicity of Older People in Birmingham, West Midlands and England (2009) Birmingham has a much higher proportion of non-white Older People than either the West Midlands or England. This is true across all age groups. In 2009, there were 20, 232 nonwhite Older People living in Birmingham West Midlands England Ethnicity People People People aged 65 - aged 75 aged 65 - aged 75 -84 aged 85+ 74 74 84 White (this includes British, Irish and Other White) 82. 33% 85. 96% 93. 21% 93. 95% 95. 12% 97. 38% 94. 66% 96. 37% 98. 17% Mixed Ethnicity (this includes White and Black Caribbean; White and Black African; White and Asian; and Other Mixed) 0. 41% 0. 37% 0. 22% 0. 19% 0. 14% 0. 13% 0. 31% 0. 23% 0. 17% Asian or Asian British (this includes Indian; Pakistani; Bangladeshi; and Other Asian or Asian British) 10. 37% 7. 62% 4. 04% 3. 70% 2. 82% 1. 53% 2. 83% 1. 85% 0. 87% Black or Black British (this includes Black Caribbean; Black African; and Other Black or Black British) 6. 13% 5. 52% 2. 23% 1. 80% 1. 65% 0. 73% 1. 61% 1. 16% 0. 50% Chinese or Other Ethnic Group 0. 77% 0. 53% 0. 30% 0. 31% 0. 19% 0. 09% 0. 54% 0. 29% 0. 13% Source: ONS Table PEEGC 309: LAD 2009 Single Year of Age by Ethnic Group, mid-2009. This table is a commissioned table from the Population Estimates by Ethnic Group (Release 8. 0), ONS. The wording used for ethnic groupings are as used by ONS. Copyright J. Collins & C. Holland, Aston University

Learning from OWCH

“Participation as an Artform”
- Slides: 13