
BAM 2020 Understanding Social Media Influencers Research from
BAM 2020 Understanding Social Media Influencers Research from 2011 -2020 : A Bibliometric Analysis STUDY BY : Ms. Anshika Singh Tanwar (presenting and corresponding author) Dr. Harish Chaudhry Mr. Manish Kumar Srivastava INSTITUTION : Indian Institute of Technology, Delhi, India

Introduction Influencer Marketing Social Media Influencers Research Objectives for the Study Methodology Data Collection, Loading, Conversion And Import Descriptive Bibliometric Analysis Data Reduction Network Matrix Creation Data Visualization and Mapping Future steps Additional descriptive metrics Overview of results and implications Conclusion
Introduction The growth and increased popularity of social media has revamped the way people communicate, interact, perceive the online content and engage with each other. Marketers are communicating their brand message to the digital consumers with the help of a relatively new concept of Influencer Marketing. This upcoming marketing strategy involves identification and selection of users that are influential and stimulating them to promote a brand, product or service by posting on social media platforms where they have followers (Araujo et al. , 2017). An influencer can be defined as a digital celebrity who is seen as an opinion leader or expert in a particular area, involved in engaging and communicating to a mass audience (Abidin, C. 2015, Uzunoğlu, E. and Misci Kip, S. 2014). These digital celebrities create an online image by presenting themselves on social media in a distinct manner and attract the attention of a large number of followers and customer engagement on one or more social media platforms (Khamis et al. , 2017; Marwick, 2015; Senft, 2008; T. Senft, 2013).
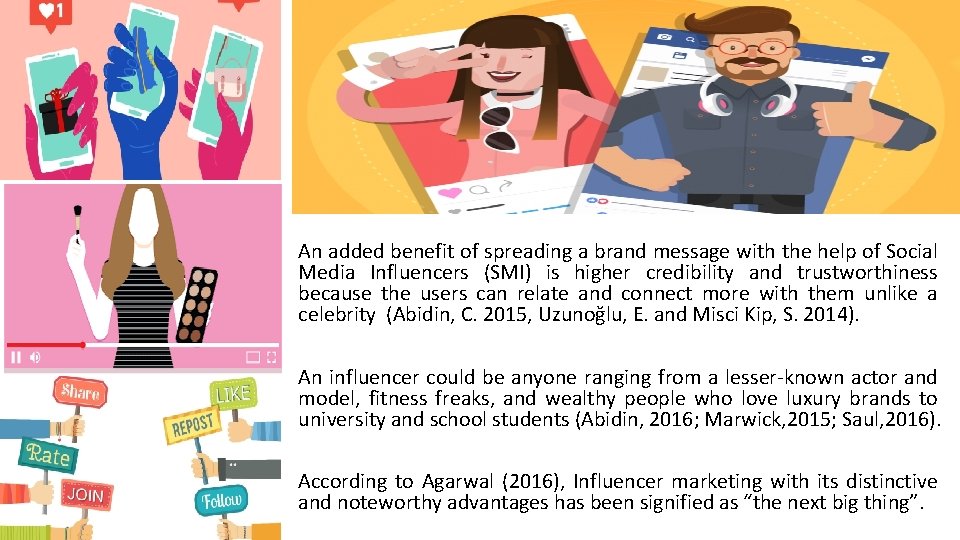
An added benefit of spreading a brand message with the help of Social Media Influencers (SMI) is higher credibility and trustworthiness because the users can relate and connect more with them unlike a celebrity (Abidin, C. 2015, Uzunoğlu, E. and Misci Kip, S. 2014). An influencer could be anyone ranging from a lesser-known actor and model, fitness freaks, and wealthy people who love luxury brands to university and school students (Abidin, 2016; Marwick, 2015; Saul, 2016). According to Agarwal (2016), Influencer marketing with its distinctive and noteworthy advantages has been signified as “the next big thing”.
This study aims to enable the marketers in accessing important factors of consideration about SMI’s and insights about social media platforms, their usage as per different themes, topics and areas thereby helping them plan effective frameworks for successful influencer-based campaigns. This article attempts to present an overview of this area of research with the help of both the manual and bibliometric analysis methods. The research objectives for undertaking this study are as follows: i) To study the evolution of research on SMIs over the time span 20112020 in accordance with parameters such as scientific production, sources, authors, countries, documents, words and citations. ii) To identify the knowledge base of SMIs and mapping corresponding intellectual structure such as a historiograph. iii) Generating and examining the conceptual structure such as thematic map and social network structure of the research in the area of SMIs.
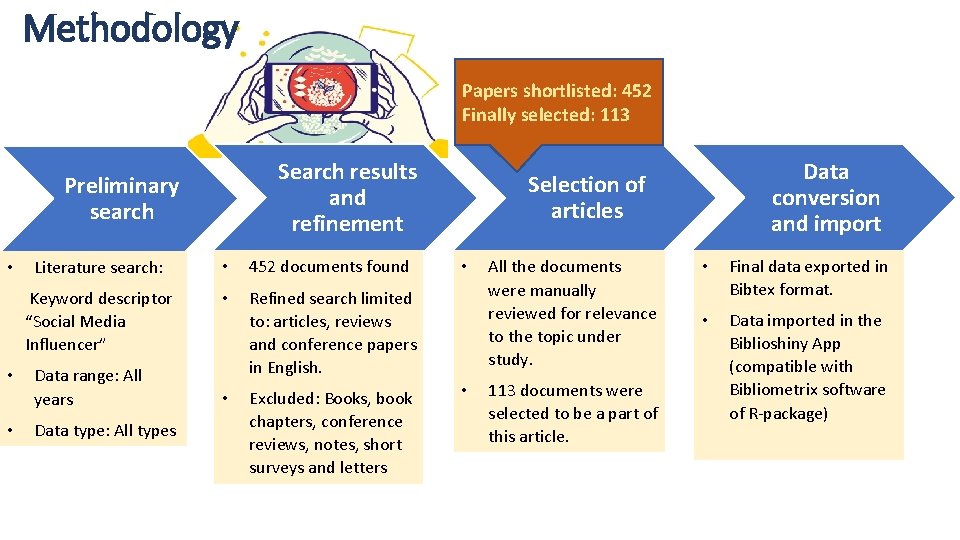
Methodology Papers shortlisted: 452 Finally selected: 113 Search results and refinement Preliminary search • • • Literature search: • 452 documents found Keyword descriptor “Social Media Influencer” • Refined search limited to: articles, reviews and conference papers in English. Data range: All years Data type: All types • Excluded: Books, book chapters, conference reviews, notes, short surveys and letters Data conversion and import Selection of articles • • All the documents were manually reviewed for relevance to the topic under study. 113 documents were selected to be a part of this article. • Final data exported in Bibtex format. • Data imported in the Biblioshiny App (compatible with Bibliometrix software of R-package)
About Bibliometric analysis package • Bibliometrix is an open-source R-tool for quantitative research in bibliometrics that includes almost all notable methods of analysis (http: //www. bibliometrix. org). • It also includes the Biblio. Shiny App introduced from version 2. 0, for generating graphs. • Data was imported from Scopus database in the Bib. Tex format and analysed by using R studio v. 1. 1. 456, R v. 3. 5. 1 (2018 -07 -02) and bibliometrix R-package • Bibliometrix supports the main stages of the recommended science mapping workflow (Aria and Cuccurullo, 2017) as shown in the next figure.
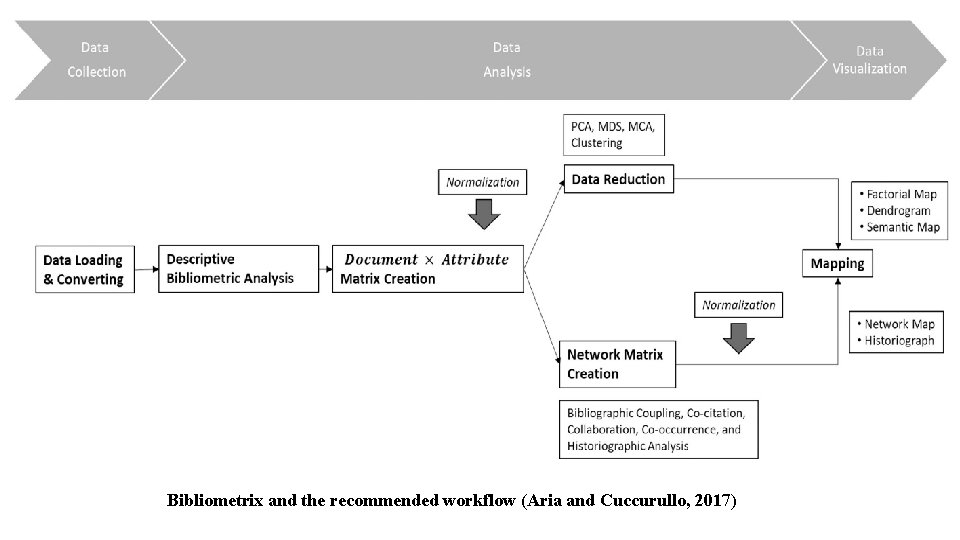
Bibliometrix and the recommended workflow (Aria and Cuccurullo, 2017)
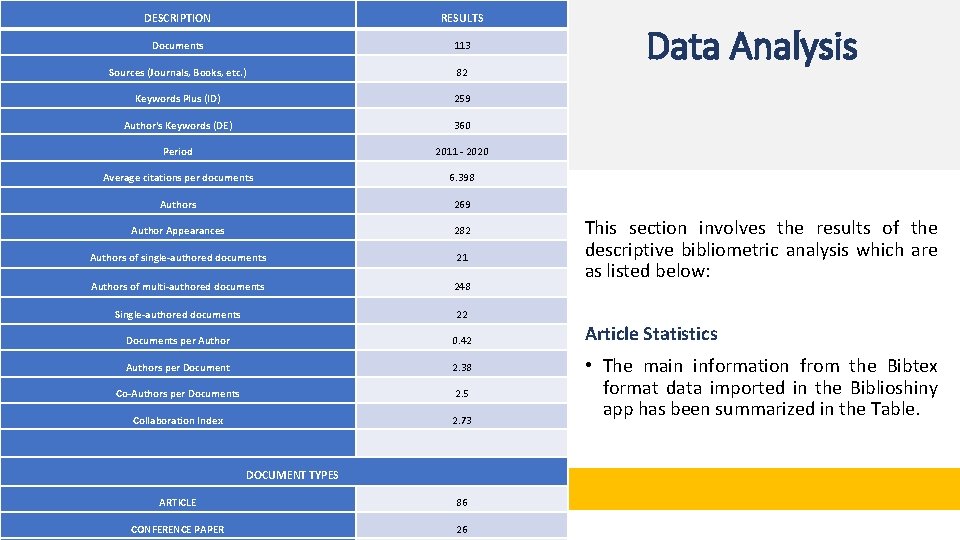
DESCRIPTION RESULTS Documents 113 Sources (Journals, Books, etc. ) 82 Keywords Plus (ID) 259 Author's Keywords (DE) 360 Period 2011 - 2020 Average citations per documents 6. 398 Authors 269 Author Appearances 282 Authors of single-authored documents 21 Authors of multi-authored documents 248 Single-authored documents 22 Documents per Author 0. 42 Authors per Document 2. 38 Co-Authors per Documents 2. 5 Collaboration Index 2. 73 DOCUMENT TYPES ARTICLE 86 CONFERENCE PAPER 26 Data Analysis This section involves the results of the descriptive bibliometric analysis which are as listed below: Article Statistics • The main information from the Bibtex format data imported in the Biblioshiny app has been summarized in the Table.
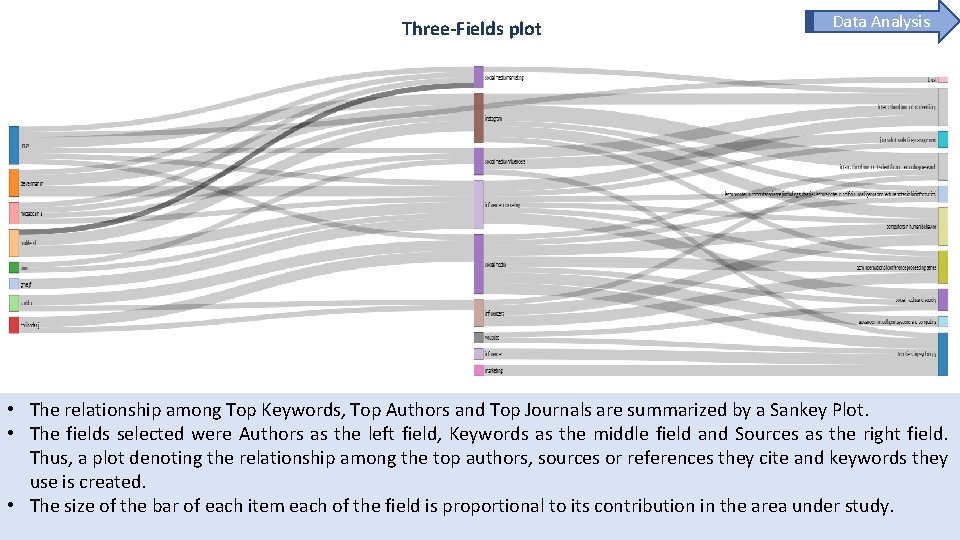
Three-Fields plot Data Analysis • The relationship among Top Keywords, Top Authors and Top Journals are summarized by a Sankey Plot. • The fields selected were Authors as the left field, Keywords as the middle field and Sources as the right field. Thus, a plot denoting the relationship among the top authors, sources or references they cite and keywords they use is created. • The size of the bar of each item each of the field is proportional to its contribution in the area under study.
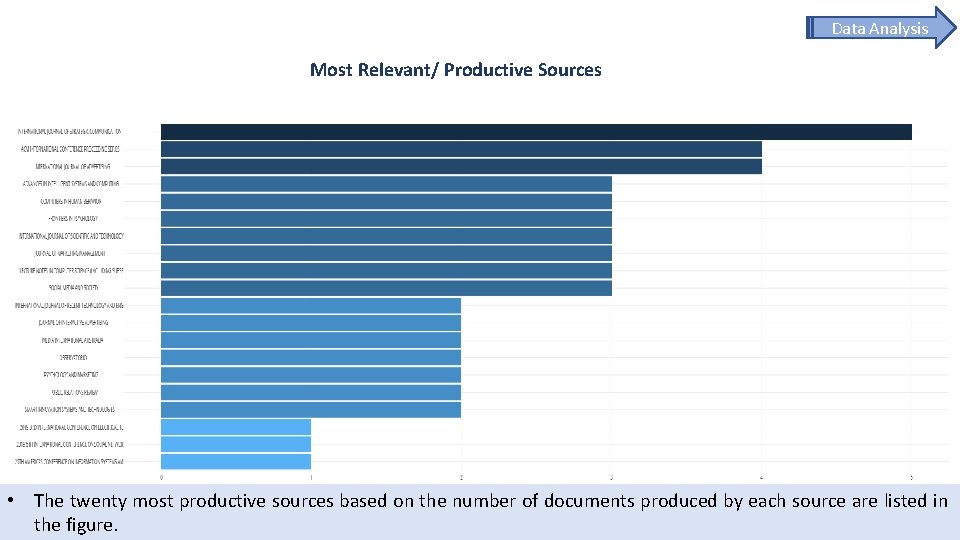
Data Analysis Most Relevant/ Productive Sources • The twenty most productive sources based on the number of documents produced by each source are listed in the figure.
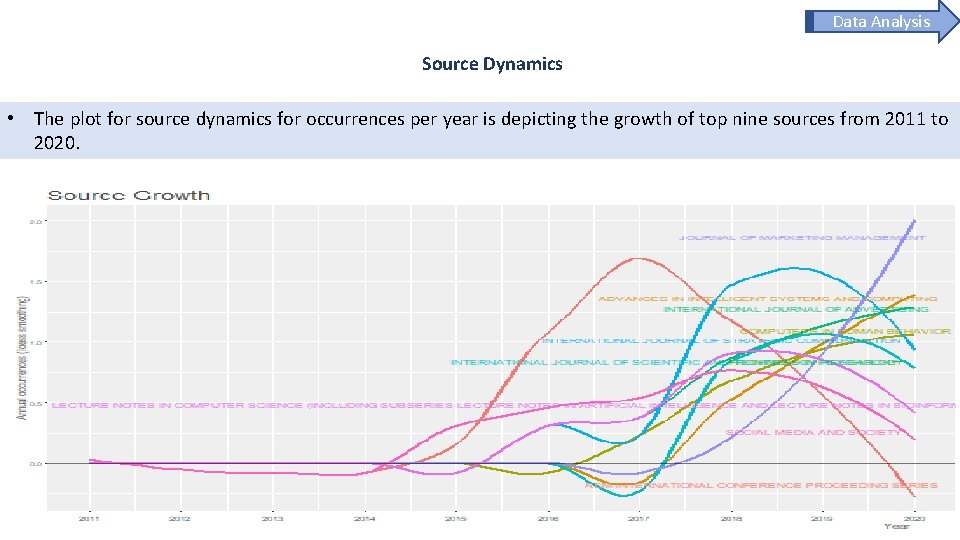
Data Analysis Source Dynamics • The plot for source dynamics for occurrences per year is depicting the growth of top nine sources from 2011 to 2020.
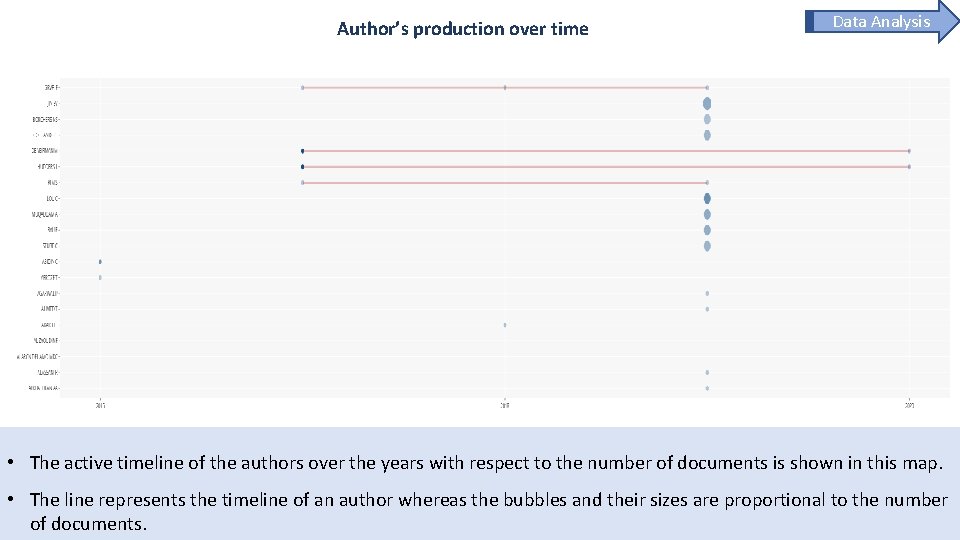
Author’s production over time Data Analysis • The active timeline of the authors over the years with respect to the number of documents is shown in this map. • The line represents the timeline of an author whereas the bubbles and their sizes are proportional to the number of documents.
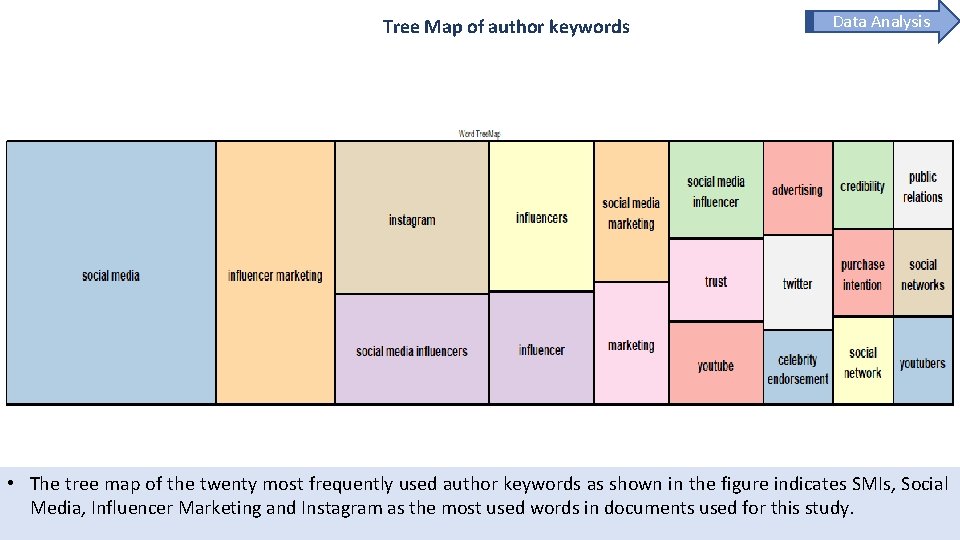
Tree Map of author keywords Data Analysis • The tree map of the twenty most frequently used author keywords as shown in the figure indicates SMIs, Social Media, Influencer Marketing and Instagram as the most used words in documents used for this study.
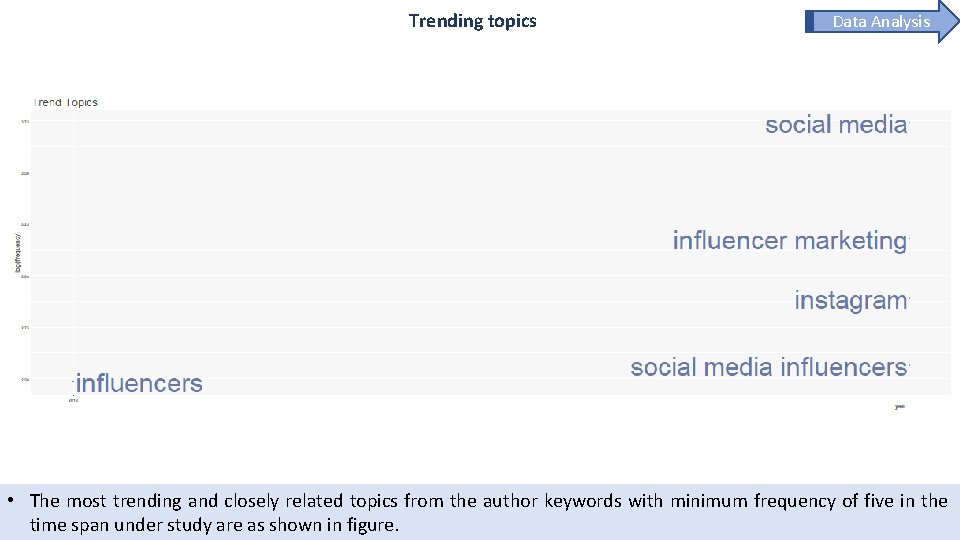
Trending topics Data Analysis • The most trending and closely related topics from the author keywords with minimum frequency of five in the time span under study are as shown in figure.
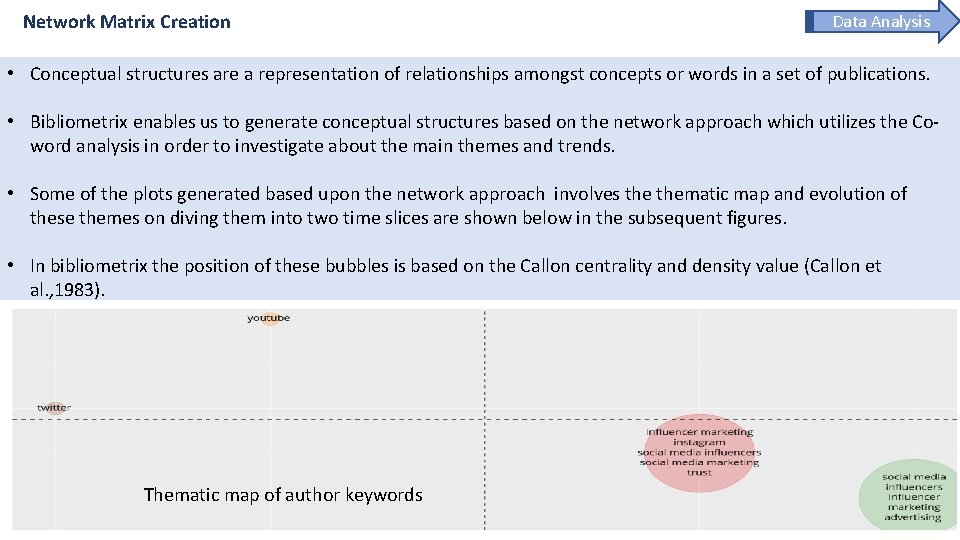
Network Matrix Creation Data Analysis • Conceptual structures are a representation of relationships amongst concepts or words in a set of publications. • Bibliometrix enables us to generate conceptual structures based on the network approach which utilizes the Coword analysis in order to investigate about the main themes and trends. • Some of the plots generated based upon the network approach involves thematic map and evolution of these themes on diving them into two time slices are shown below in the subsequent figures. • In bibliometrix the position of these bubbles is based on the Callon centrality and density value (Callon et al. , 1983). Thematic map of author keywords
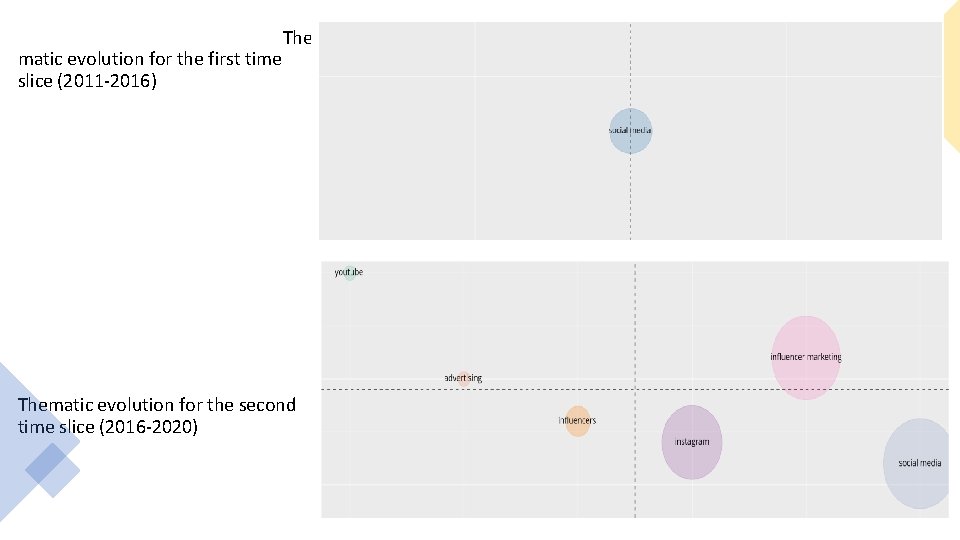
matic evolution for the first time slice (2011 -2016) Thematic evolution for the second time slice (2016 -2020)
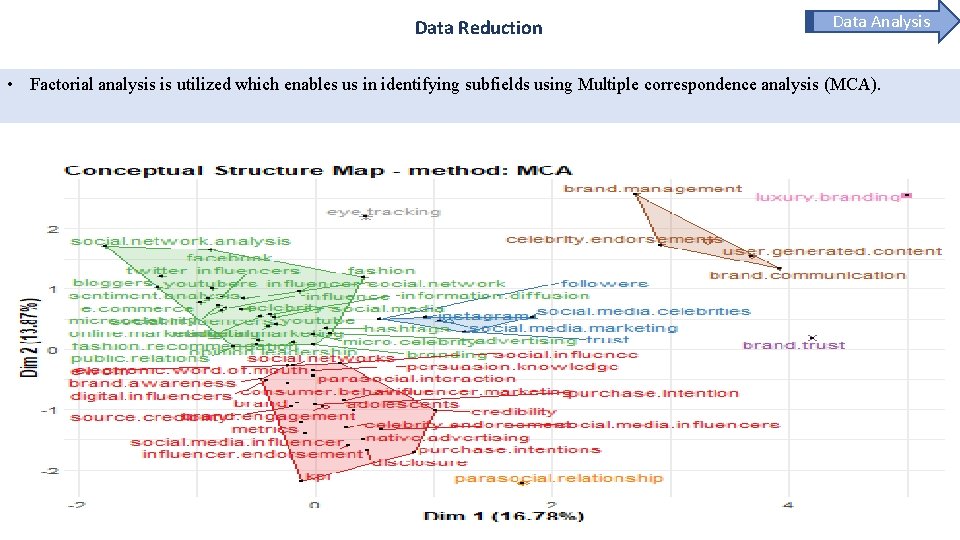
Data Reduction Data Analysis • Factorial analysis is utilized which enables us in identifying subfields using Multiple correspondence analysis (MCA).
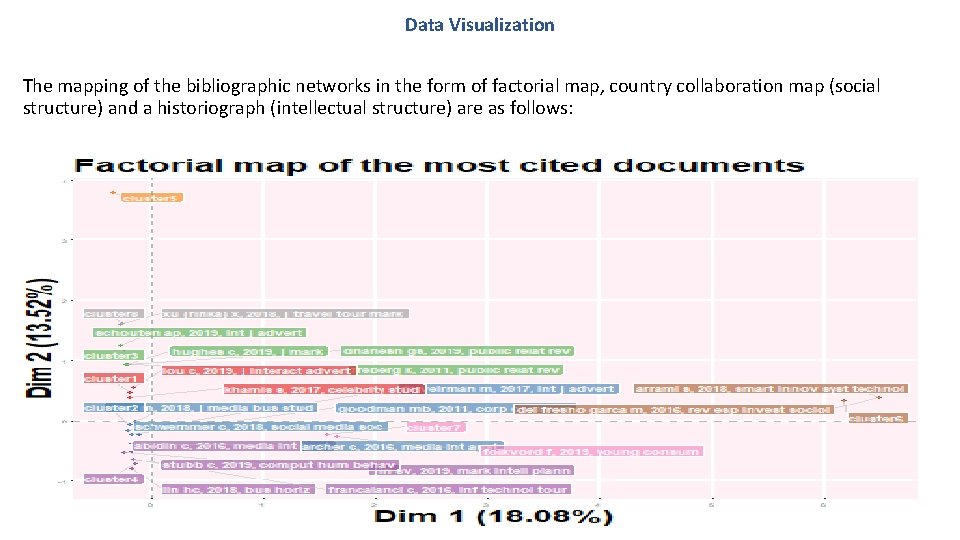
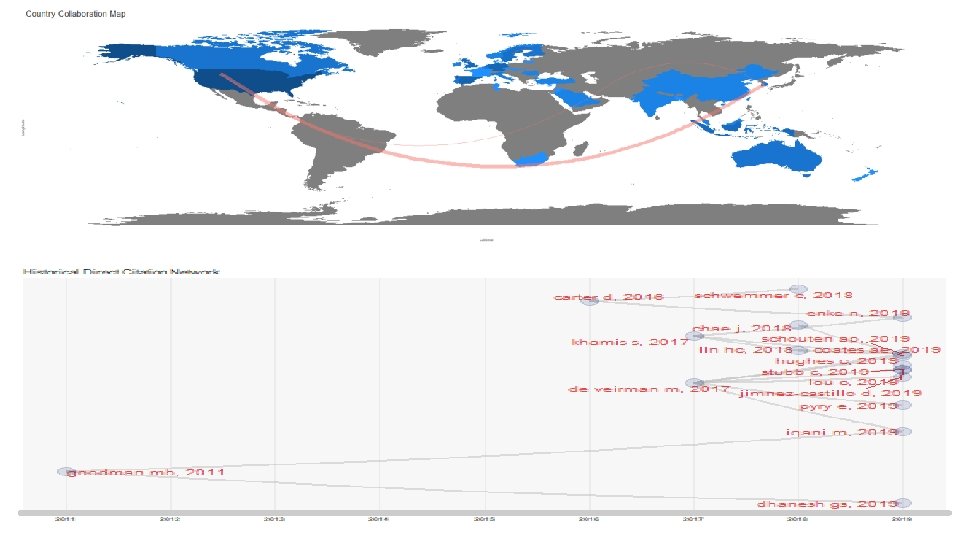
Data Visualization The mapping of the bibliographic networks in the form of factorial map, country collaboration map (social structure) and a historiograph (intellectual structure) are as follows:
Future steps 1. Some of the other descriptive bibliometric analysis metrics (mentioned in the next slide) which could not be included here will be added in the full paper. 2. Further development in the future will also involve : a) Interpretations of the results generated from the descriptive bibliometric analysis maps, and scientific structures, b) Discussion of the findings and c) Implications for future research related to the area of SMI giving insights to the researchers, academicians and practitioners.
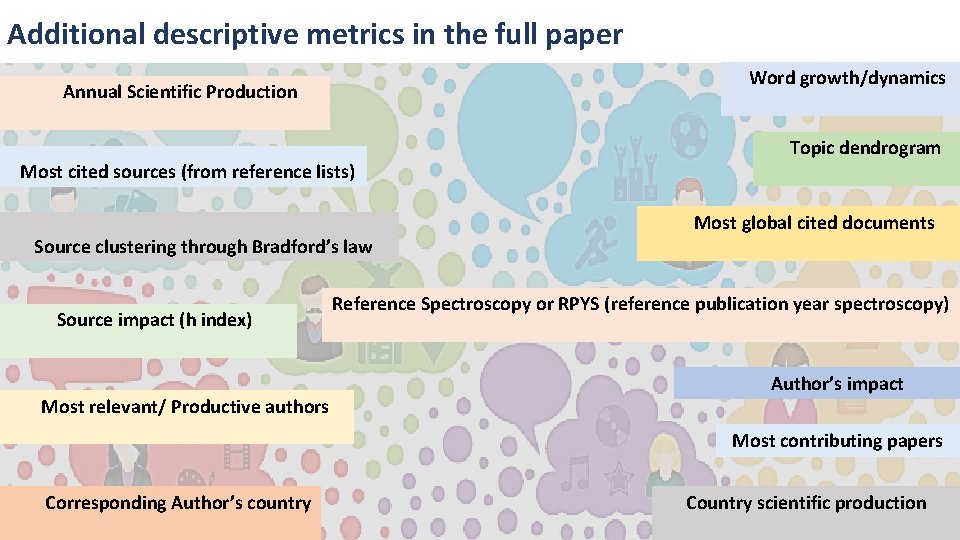
Additional descriptive metrics in the full paper Word growth/dynamics Annual Scientific Production Most cited sources (from reference lists) Source clustering through Bradford’s law Source impact (h index) Most relevant/ Productive authors Topic dendrogram Most global cited documents Reference Spectroscopy or RPYS (reference publication year spectroscopy) Author’s impact Most contributing papers Corresponding Author’s country Country scientific production
Overview of results and implications • The tabulated statistics indicate that maximum documents have co-authors, with only 20% being single-authored documents, implying a higher rate of collaborations in this research area. • The Sankey plots using three main metadata fields gives insightful information based on the linkage between these fields. Hence enables future researchers to map studies specifically. • Most cited studies from the reference list of the document set can be mapped and utilized for future reference by the academicians. • The clustering of sources by Bradford’s law enlists the journals into an order of association with a research area. It provides the core sources dedicated most in terms for their relevance to the area giving researchers an underlying foundation for future studies to consider sources based on their contribution to the area.
• The classification of journals based on impact measure of h-Index indicates studies with higher significance in terms of impact factor which may be considered for future reference. • The analysis also enables coupling the most relevant authors with their production over time for future researchers to selectively take studies as reference work by authors from a corresponding time frame. • The plot for source growth could assist in classifying studies which have been most consistent in the number of publications per year. • This bibliometric analysis assists in mapping countries which favour single and multiple country publications respectively, giving direction for practitioners and researchers to collaborate for their work accordingly. • The most productive period for the research related to Influencer research highlight the most relevant studies to be considered for recent developments and themes in the area by the future researchers.
• The most frequent terms as a treemap suggest possible topics based on their frequency of usage for future studies. • This analysis gives word dynamics for researchers to know which topics have increased or decreased usage over time to link the parallel growth of topics and thus plan studies in respective areas. And also directing towards new possible directions of research in the future. • The graph for trending topics suggests areas that have been mostly used together in studies over the years, giving an overview of the patterns arising and to be adopted for future developments around these subjects. • The thematic map generated from the clustering algorithm can give insights as per the significance of themes derived based on centrality and density such that the growth of themes can be estimated for the future.
• By splitting thematic evolution into different time slices enables the researchers to map the evolution of upcoming themes along with the two different time frames such that the recent developments are mapped more effectively. • The conceptual structure mapping provides clusters of terms which are interconnected in the studies of Social Media Influencers such that the researchers can easily trace the closely related factors to be studied together for future studies. • The depiction of topics in dendrogram can be useful for highlighting the proximity or dependence of one topic on another and the degree of interconnectivity to help future academicians with the possible direction of research. • This analysis provides the most contributing papers for each cluster of topics, which can be a useful guide for shortlisting important studies for a certain theme. • The country collaborations map enables researchers to know about frequent co-authorship between countries such that future possibilities for collaborations are mapped.
Conclusion • This paper aims to furnish the current static picture of the area under study as a background such that future development of this field can be captured effectively. • This bibliometric analysis enables to categorise the articles by different parameters and provide useful inferences for the researchers to map important studies and factors thereby enabling unique and multiple directions for future studies. • The review of academic literature related to SMIs presents a backdrop for the evolution of this topic during the span 2011 -2020. • This study could be used as a basis for identifying important aspects associated with SMIs in terms of their role, reach and impact which need to be explored for better understanding and establishment of this research area as a mainstream approach for brand message communication in the future.
References Abidin, C. , 2015. Communicative intimacies: Influencers and perceived interconnectedness. Ada, 8, pp. 1 -16. Abidin, C. , 2016. Visibility labour: Engaging with Influencers’ fashion brands and# OOTD advertorial campaigns on Instagram. Media International Australia, 161(1), pp. 86 -100. Agrawal, A. J. , 2016. Why influencer marketing will explode in 2017. Forbes. com. Araujo, T. , Neijens, P. and Vliegenthart, R. , 2017. Getting the word out on Twitter: The role of influentials, information brokers and strong ties in building word-of-mouth for brands. International Journal of Advertising, 36(3), pp. 496 -513.
Aria, M. and Cuccurullo, C. , 2017. bibliometrix: An R-tool for comprehensive science mapping analysis. Journal of Informetrics, 11(4), pp. 959 -975. Callon, M. , Courtial, J. P. , Turner, W. A. and Bauin, S. , 1983. From translations to problematic networks: An introduction to co-word analysis. Information (International Social Science Council), 22(2), pp. 191 -235. Childers, C. C. , Lemon, L. L. and Hoy, M. G. , 2019. # Sponsored# Ad: Agency Perspective on Influencer Marketing Campaigns. Journal of Current Issues & Research in Advertising, 40(3), pp. 258 -274. Christodoulides, G. , Jevons, C. and Bonhomme, J. , 2012. Memo to marketers: Quantitative evidence for change: How user-generated content really affects brands. Journal of advertising research, 52(1), pp. 53 -64.
Gottfried, J. and Shearer, E. , 2016. News Use Across Social Medial Platforms 2016. Pew Research Center. Khamis, S. , Ang, L. and Welling, R. , 2017. Self-branding, ‘micro-celebrity’and the rise of Social Media Influencers. Celebrity studies, 8(2), pp. 191 -208. Li, C. , 2010. Groundswell. Winning in a world transformed by social technologies. Strategic Direction. Lou, C. and Yuan, S. , 2019. Influencer marketing: how message value and credibility affect consumer trust of branded content on social media. Journal of Interactive Advertising, 19(1), pp. 58 -73.
Marwick, A. E. , 2013. Status update: Celebrity, publicity, and branding in the social media age. Yale University Press. Mc. Quarrie, E. F. , Miller, J. and Phillips, B. J. , 2013. The megaphone effect: Taste and audience in fashion blogging. Journal of Consumer Research, 40(1), pp. 136 -158. Saul, H. , 2016. Instafamous: Meet the social media influencers redefining celebrity. The Independent, Retrieved from http: //www. independent. co. uk/news/people/instagramm odelnatasha-oakley-iskra-lawrence-kayla-itsineskendalljenner-jordyn-woodsa 6907551. html Senft, T. M. , 2008. Camgirls: Celebrity and community in the age of social networks (Vol. 4). Peter Lang.
Senft, T. M. , 2013. Microcelebrity and the branded self. A companion to new media dynamics, pp. 346 -354. Uzunoğlu, E. and Kip, S. M. , 2014. Brand communication through digital influencers: Leveraging blogger engagement. International Journal of Information Management, 34(5), pp. 592 -602. Zupic, I. and Čater, T. , 2015. Bibliometric methods in management and organization. Organizational Research Methods, 18(3), pp. 429 -472.
anshikasingh 7@gmail. com
- Slides: 33