Balanced System Learning so Far In the beginning

Balanced System Learning so Far

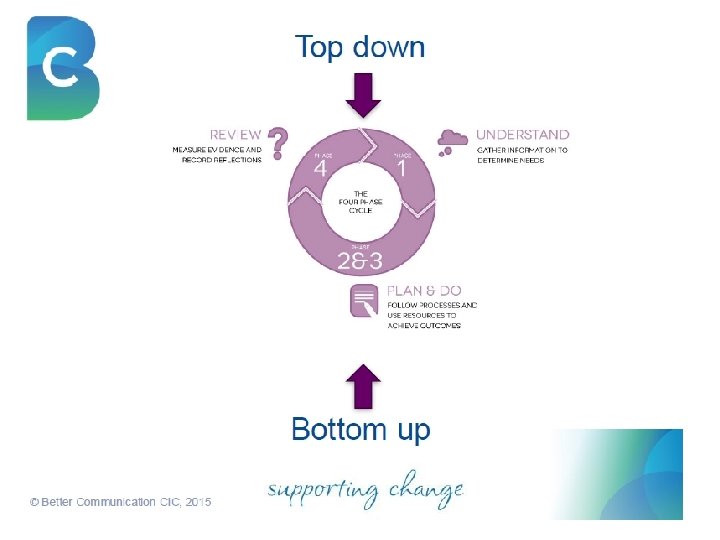
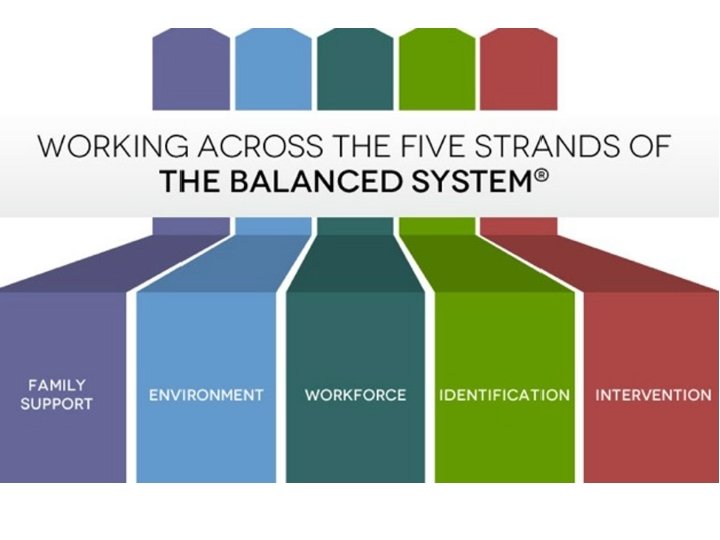
In the beginning. . . • We believe that the ‘Balanced System’ fully complements and will facilitate the transformational change as described in ‘Ready to Act’. In order to progress with this change, mapping the service, gap analysis and identifying our strengths will be a key aspect of the process.

What does success look like? • Outcomes – The service will have improved understanding of our communication needs population in order to inform most effective support of children with speech, language and communication needs in Forth Valley. – To have a shared understanding and language of the current gaps and provisions within the service in order to inform more effective service delivery in line with Ready to Act. – To have powerful data to demonstrate our value and impact in order to influence key stakeholders – Services align with the needs of the local population

Timeline – Balanced System FV Webinars/ Workshop Clacks Workshop Sept Demographic, Workforce Analysis Mapping of provisions and gaps Whole staff meeting Stirling Workshop Oct Synthesis of data, summary report Nov Dec Final Report Workshop 2 - NES Jan Feb Mar

Project Plan Group / Role Members Purpose Project Lead GC Project Management & strategic oversight of project Strategic Group Strategic oversight of the project. Local Implementation Groups Falkirk, Stirling, Clacks Input data into tool Follow up from initial scoping to ensure consistency. Local Staff Groups All Staff Complete initial scoping of services

Population 0 -4 5 -9 10 -14 15 -18 Scotland 26. 6% 26. 7% 24. 9% 21. 8% Clacks 26. 3% 26. 2% 25. 3% 22. 2% Stirling 22. 9% 24. 9% 26. 8% 25. 3% Falkirk 26. 1% 27. 8% 25. 1% 20. 9%

Social Disadvantage

Social Disadvantage • Stirling


Other information • Caseload • Workforce

Qualitative Mapping
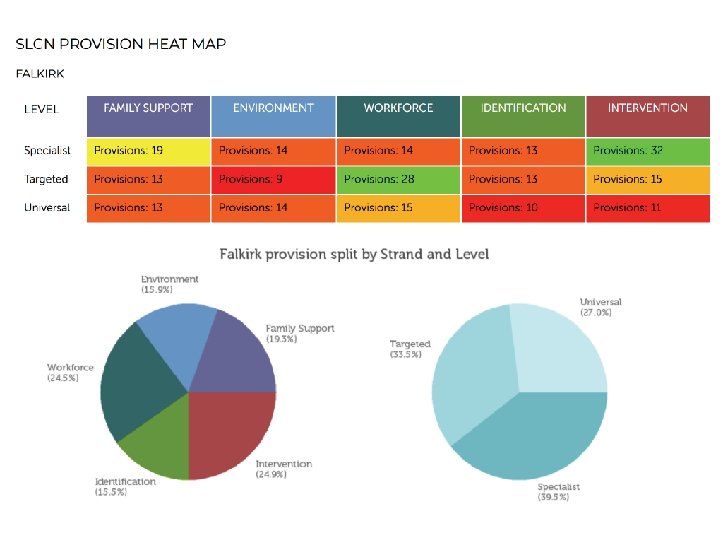

Provision Distribution

Provision Distribution 160 140 120 100 Clacks 80 Stirling Falkirk 60 40 20 0 0 0, 5 1 1, 5 2 2, 5 3 3, 5

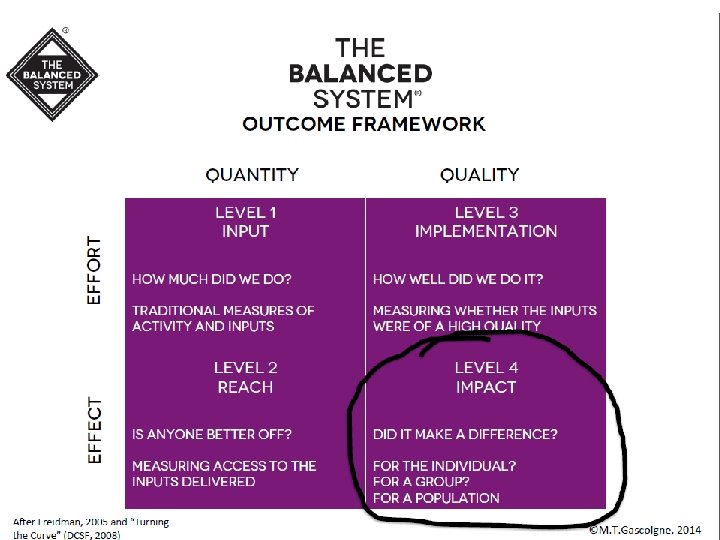
Key Learning - Successes • Process can help staff reflect on bigger picture, see gaps, value Universal / Targeted • Outputs useful for informing future direction and allocation of resources • Facilitates services delivering on ‘Ready to Act’ • Excellent data for Impact Reports • Helps services stop doing ‘what they’ve always done. ’ • Report Automated

Key Learning - Challenges • • • Investment in time Changing Tool Quality of inputting dependent on experience Discrepancies in understanding of U, T and S Not all staff see the value in scoping

Practically • • ? Redistribution of resource Higher % of staff engaged in U, T and S Used the data in impact reports Quickly respond to requests about need and provision in Forth Valley
 Each = about 300 people")
Population (based on Stirling information from Balanced System report) Each = about 300 people Specialist • 311 Caseload Targeted SLCN =7. 5% of =1. 6% of 0 -18 population • 4149 Predicted population with SLCN =21% of 0 -18 population Universal additionality Universal • 19265 • Population 018 years
- Slides: 21