
Balance Scorecard Project Sarah Martinez Jamie Itzenheiser Sheena
Balance Scorecard Project Sarah Martinez Jamie Itzenheiser Sheena Allen Maria Billings
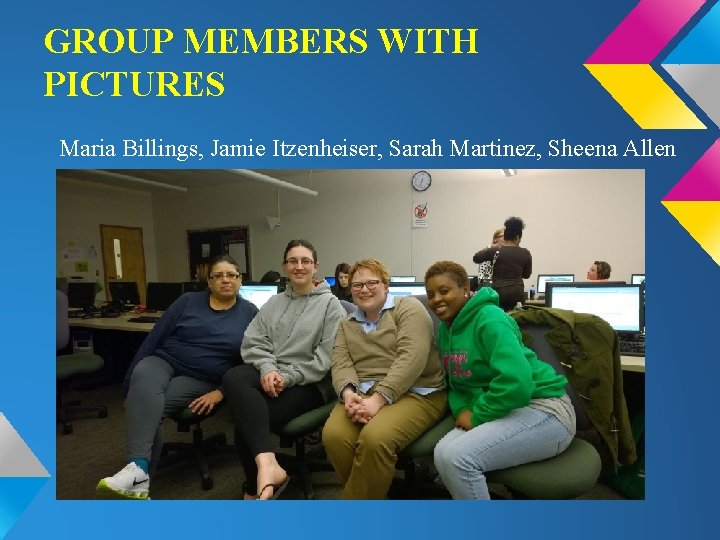
GROUP MEMBERS WITH PICTURES Maria Billings, Jamie Itzenheiser, Sarah Martinez, Sheena Allen
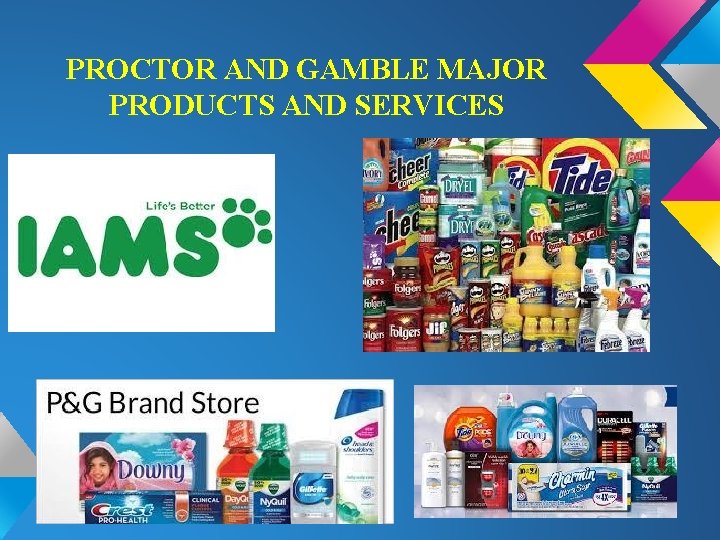
PROCTOR AND GAMBLE MAJOR PRODUCTS AND SERVICES
Leaders in the Industry/Global ❖ Net Sales for 2013: ❖ Beauty : $20 billion ❖ Baby, Feminine and Family Care : $22 billion ❖ Fabric and Home Care : $26 billion ❖ Health and Grooming : $17 billion
Beauty Care: Cover Girl, Max Factor, Olay, Old Spice, Safeguard, Secret Hair Care , Hair Color: Head & Shoulders, Herbal Essences, Nice & Easy, Pantene, Rejoice Prestige: Gucci, Hugo Boss, SK-II Salon Professional: Wella
Baby, Feminine, and Family Care Baby Care: luvs, Pampers Family Care: Bounty, Charmin, Puffs Feminine Care: Always, Naturella, Tampax
Fabric and Home Care Fabric Care: Ace, Ariel, Bold, Bounce, Dash, Downy, Gain, Tide Home Care: Cascade, Dawn, Febreze, Mr. Clean, Swiffer Personal Power: Duracell
Health and Grooming Braun and Appliances: Braun Oral Care: Crest, Fixodent, Oral-B Personal Health Care: Prilosec, Vicks Pet Care: Eukanuba, Iams Shave Care: Fusion, Gillette, Mach 3, Prestobarba, Venus
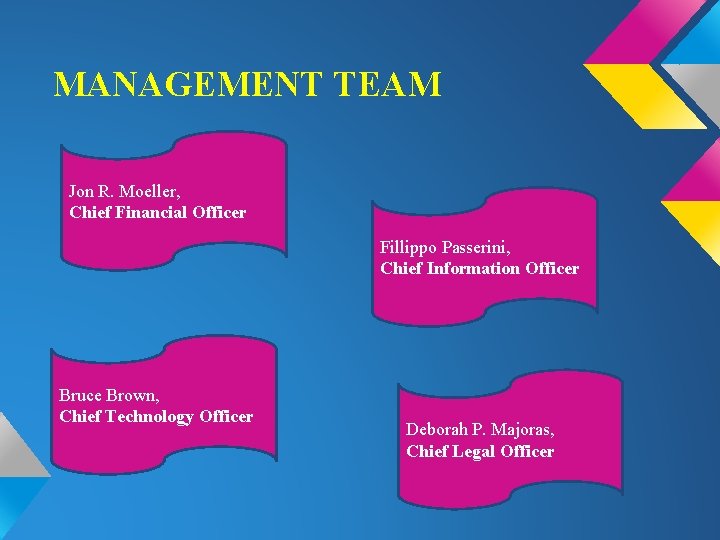
MANAGEMENT TEAM Jon R. Moeller, Chief Financial Officer Fillippo Passerini, Chief Information Officer Bruce Brown, Chief Technology Officer Deborah P. Majoras, Chief Legal Officer
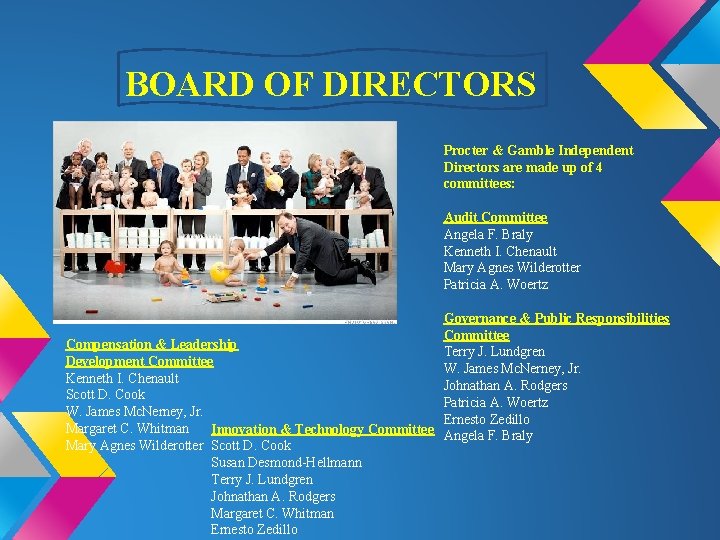
BOARD OF DIRECTORS Procter & Gamble Independent Directors are made up of 4 committees: Audit Committee Angela F. Braly Kenneth I. Chenault Mary Agnes Wilderotter Patricia A. Woertz Governance & Public Responsibilities Committee Compensation & Leadership Terry J. Lundgren Development Committee W. James Mc. Nerney, Jr. Kenneth I. Chenault Johnathan A. Rodgers Scott D. Cook Patricia A. Woertz W. James Mc. Nerney, Jr. Ernesto Zedillo Margaret C. Whitman Innovation & Technology Committee Angela F. Braly Mary Agnes Wilderotter Scott D. Cook Susan Desmond-Hellmann Terry J. Lundgren Johnathan A. Rodgers Margaret C. Whitman Ernesto Zedillo
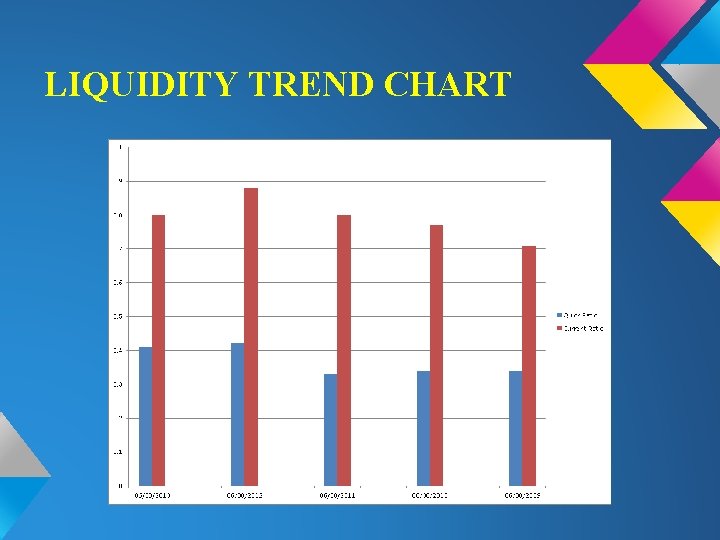
LIQUIDITY TREND CHART
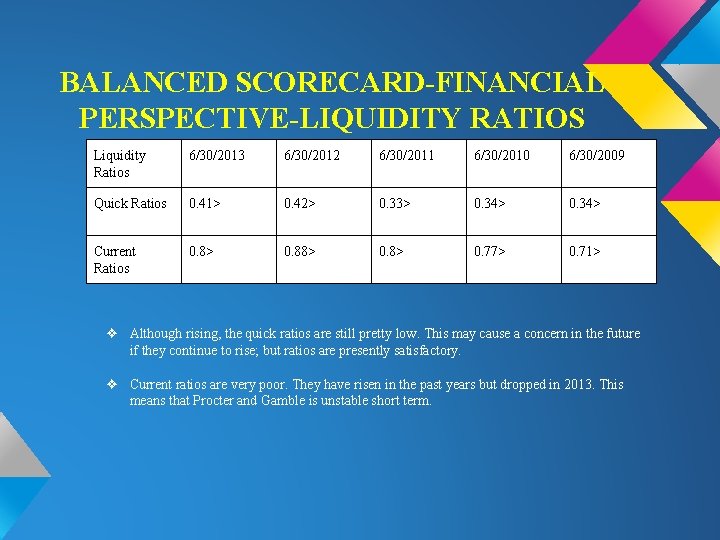
BALANCED SCORECARD-FINANCIAL PERSPECTIVE-LIQUIDITY RATIOS Liquidity Ratios 6/30/2013 6/30/2012 6/30/2011 6/30/2010 6/30/2009 Quick Ratios 0. 41> 0. 42> 0. 33> 0. 34> Current Ratios 0. 8> 0. 77> 0. 71> ❖ Although rising, the quick ratios are still pretty low. This may cause a concern in the future if they continue to rise; but ratios are presently satisfactory. ❖ Current ratios are very poor. They have risen in the past years but dropped in 2013. This means that Procter and Gamble is unstable short term.
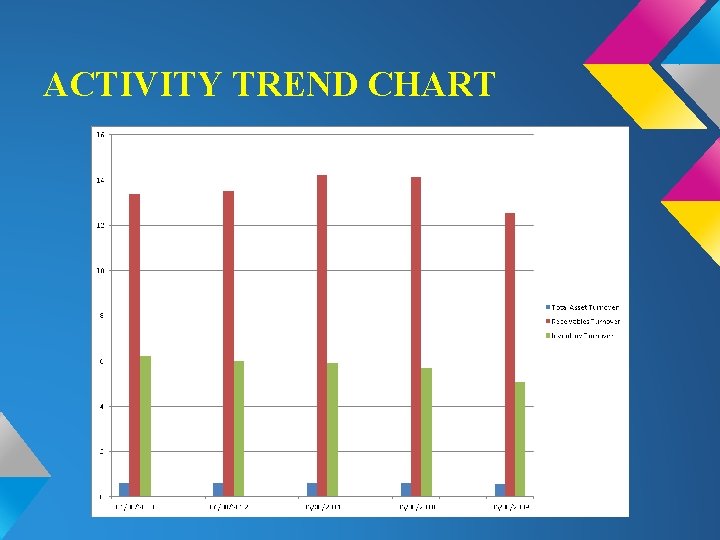
ACTIVITY TREND CHART
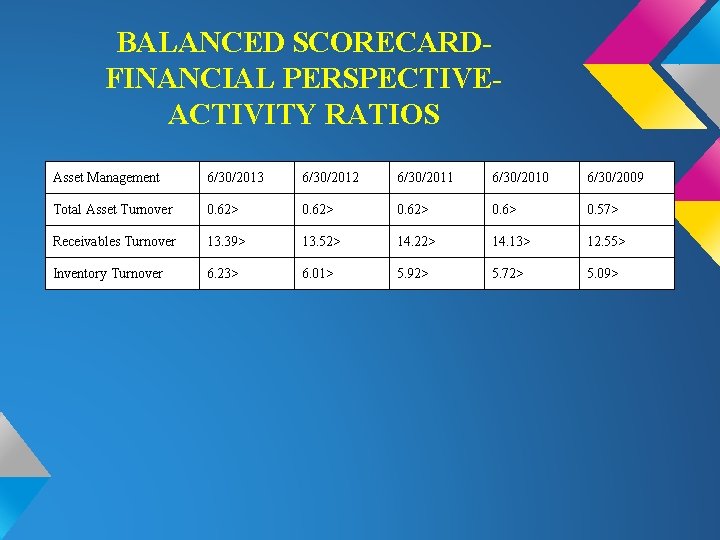
BALANCED SCORECARDFINANCIAL PERSPECTIVEACTIVITY RATIOS Asset Management 6/30/2013 6/30/2012 6/30/2011 6/30/2010 6/30/2009 Total Asset Turnover 0. 62> 0. 6> 0. 57> Receivables Turnover 13. 39> 13. 52> 14. 22> 14. 13> 12. 55> Inventory Turnover 6. 23> 6. 01> 5. 92> 5. 72> 5. 09>
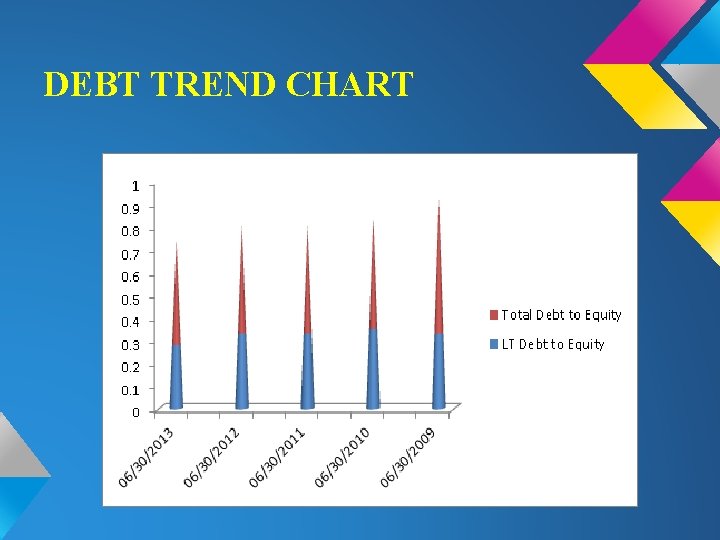
DEBT TREND CHART
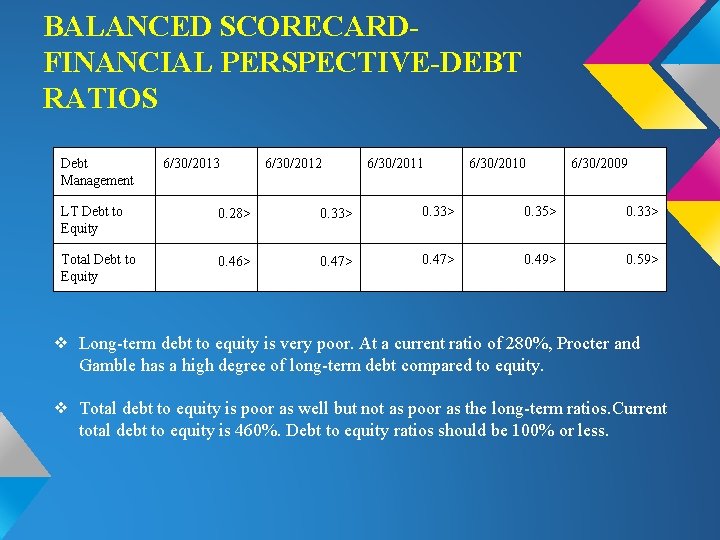
BALANCED SCORECARDFINANCIAL PERSPECTIVE-DEBT RATIOS Debt Management 6/30/2013 6/30/2012 6/30/2011 6/30/2010 6/30/2009 LT Debt to Equity 0. 28> 0. 33> 0. 35> 0. 33> Total Debt to Equity 0. 46> 0. 47> 0. 49> 0. 59> ❖ Long-term debt to equity is very poor. At a current ratio of 280%, Procter and Gamble has a high degree of long-term debt compared to equity. ❖ Total debt to equity is poor as well but not as poor as the long-term ratios. Current total debt to equity is 460%. Debt to equity ratios should be 100% or less.
PROFITABILITY TREND CHART
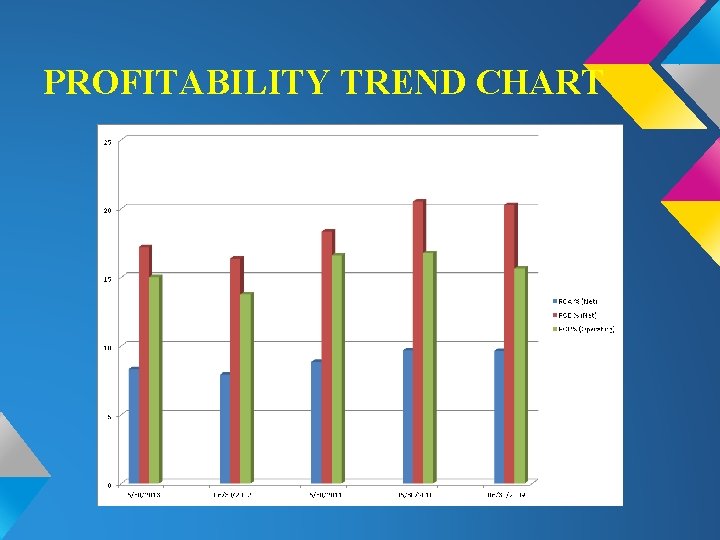
Profitability Trends Stagnant. . Invest or Not? ❖ Typically anything over 5% for ROA is considered good. In this model we can see over the last 5 years P&G has maintained above the 5% but took a pretty steep dip in 2011. They have since began to gain some of that growth back in 2013. ❖ If we review the ROE for P&G we can see that they are well in the 15% to 20% range which is considered good. We see the same dip in 2011 and momentum in 2013. Even though the ROE is well within range we need to be careful and ask the questions of, What are we doing with our earnings? We can evaluate this further by using the Du. Pont Model. ❖ Given the information presented to us in the beginning of the Annual Report P&G is aware of their dips and have put a stronger, more strategic plan in place. They are gaining back their growth (lost due partly to the market and multiple recalls) in the US market which is a 3 rd of their sales and half their profits alone.
BALANCED SCORECARD-FINANCIAL PERSPECTIVE-PROFITABILITY RATIOS Comparing Procter & Gamble to 2 of it’s top competitors we can relate to the profitability trends of the company. Procter & Gamble will perform over the next 6 to 12 months. It’s a matter of how much. It’s earning strength compared to Colgate-Palmolive Co and Kimberly-Clark. PG 5. 2% CL 4. 5% KMB 5. 2% Earnings Strength PG AND KMB ranked at 65% of companies covered by Ford Equity Research and CL ranked at 57% PG 13% CL 15% KMB 37% Growth rate over the past 5 quarters. PG. 9% NEG CL 11. 6% NEU KMB 16% NEU Common Stock Performance Potential Relative. Valuation Price Movement 1 YEAR PRICE UP
BALANCED SCORECARD CUSTOMER PERSPECTIVE ❖ Increase customer satisfaction ❖ Tapping into developing countries ❖ Developing new products
BALANCED SCORECARD CUSTOMER PERSPECTIVE Nearly $500 million in sales in North America this fiscal year, Tide PODS is now expanding globally - starting with Latin America, Western and Central Europe, and Africa. Crest and Oral-B 3 D White toothpaste have grown value share in the U. S. for 13 consecutive quarters - every quarter since 3 D White first launched - and are now sold in more than 40 markets globally. Fusion Pro. Glide launched in the U. S. three years ago. It is now in more than 45 markets, most recently expanding to Brazil, Mexico and China. Fusion has grown global value share for 30 straight quarters - ever since the first fusion product launched.
P&G is investing in Capabilities for growth Our final focus area is to make strategic, focused investments in innovation and go-tomarket capabilities. These are two of our core strengths as a Company and two important sources of competitive advantage and growth. They are critical to winning the first and second moments of truth.
Purpose, Values & Principles Procter & Gamble has grown over the last 175 years. Their purpose, values and principles are the root for their unique culture. Procter & Gamble have grown and adapted over the years, yet these three elements have stayed and will continue to be passed down to the future generations of P&G People. “Our Purpose unifies us in a common cause and growth strategy of improving more consumers’ lives in small but meaningful ways each day. It inspires P&G people to make a positive contribution every day”. “Our Values reflect the behaviors that shape the tone of how we work with each other and with our partners”. “Our Principles articulate P&G’s unique approach to conducting
Competitive Advantage and Innovation ❖ P&G is constantly faced with challenges of staying on top competitively. Even though they have a wide range of products hitting so many different types of demographics it is imperative they continue to develop that competitive edge. It is a matter of survival and that key ingredient is INNOVATION. ❖ Being innovative means to take risks, be flexible, seeing things from different perspectives and encouraging employees to be idea champions. ❖ P&G’s Internal business strategies gives them this edge.
BALANCED SCORECARDINTERNAL BUSINESS PERSPECTIVE “P&G scientists received the Economist Innovation Award for their work on, and the Company’s commitment to providing clean drinking water to those in need, through our Children’s Safe Drinking Water Program”-page 87 of annual report. Procter & Gamble uses a Connect + Develop Strategy (an open innovation approach) to bring products to consumers worldwide. Take a look at some of the Innovations P&G uses to ensure their products are what the consumer needs and wants. ❖ Signal P&G ❖ The Clay Street Project ❖ The Loft Approach ❖ Business Sphere ❖ Symphony. IRI Pacesetters Because of facilities and tactics such as these P&G has been successful in launching 3 of the top 10 new products of 2012 ❖ Downy Unstopables ❖ Pampers Sensitive Wipes ❖ Clairol Nice n Easy Color Foam
BALANCED SCORECARDINTERNAL BUSINESS PERSPECTIVE ❖ Diversity & Inclusion is a sustained competitive advantage for the continued growth of P&G. ❖ Launches an annual report specifically on the Diversity & Inclusion of their company. . ❖ P&G is committed to creating a winning culture where colleagues and mgrs demonstrate sincere care for each other. ❖ “The New Flexicenter” is something P&G uses to create a culture of inclusion which allows employees with disabilities work alongside their colleagues both contributing and exceeding expectations as a single workforce. ❖ For the 2 nd consecutive year, Chief Executive Magazine named P&G #1 out of 40 of the Best Companies for Leaders. ❖ They have been recognized by Diversity. Inc, for it’s impact in global diversity.
BALANCED SCORECARDLEARNING AND GROWTH PERSPECTIVE ❖ Procter & Gamble is built from within. It is their most important asset and source of competitive advantage. ❖ Staying on top of current technology with it’s rapid growth is one of P&G’s #1 priorities, therefore it’s employee’s need to be in a constant motion of learning whether at an innovation center, retail store or consumer home. ❖ Employee’s endure on-the-job experience which deepens their commitment to touching and improving consumer lives. ❖ P&G approaches their employees with a mind set of career planning. They manage talent globally where the CEO, Vice Chairs, Business Presidents and Board of Directors all take part. ❖ Business and functional leaders actively recruit, teach and coach. ❖ P&G people are challenged from day one to understand the need to be in touch with consumers, retail customers and external stakeholders through disciplined projects.
PG SWOT ANALYSIS Strengths ❖ Billion dollar leaderships brands such as Head & Shoulders, Olay, and Pantene ❖ Top 3 Contributors to the company's revenue: ❖ Fabric Care & Home Care contribute 32% ❖ Beauty Segment with 24% ❖ Baby care and Family health 19% ❖ The company’s innovation efforts are based on understanding their customers behavior & perception ❖ Market Development organization (MOD) is organized along five geographic units. June 2012 the company’s NA segment contributed 39% of net sales, followed by WE with 19, Asia with 18%, Ceema with 14%, and LA with 10%. Weakness ❖ 2013 recall its IAMS Puppy dog food due to levels of aflatoxin. ❖ 2011, P&G voluntarily recalled a lot of dry dog food due to aflatoxin levels that were above the acceptable limit. ❖ July 2011, voluntary recall on Oral B mouthwash due to possible microbial contamination. ❖ Reliance on a collection of key brands for a material amount of company's top line ❖ Focus on high- end of the market ❖ Must constantly reinvent its products or face flagging sales
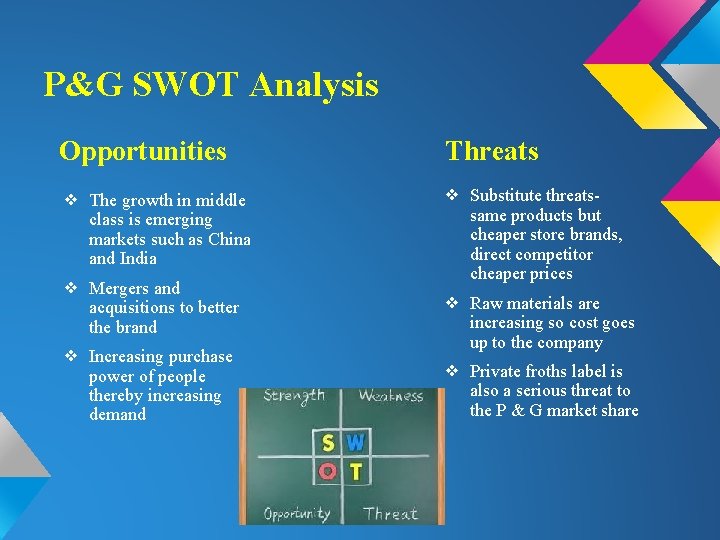
P&G SWOT Analysis Opportunities Threats ❖ The growth in middle class is emerging markets such as China and India ❖ Substitute threatssame products but cheaper store brands, direct competitor cheaper prices ❖ Mergers and acquisitions to better the brand ❖ Increasing purchase power of people thereby increasing demand ❖ Raw materials are increasing so cost goes up to the company ❖ Private froths label is also a serious threat to the P & G market share
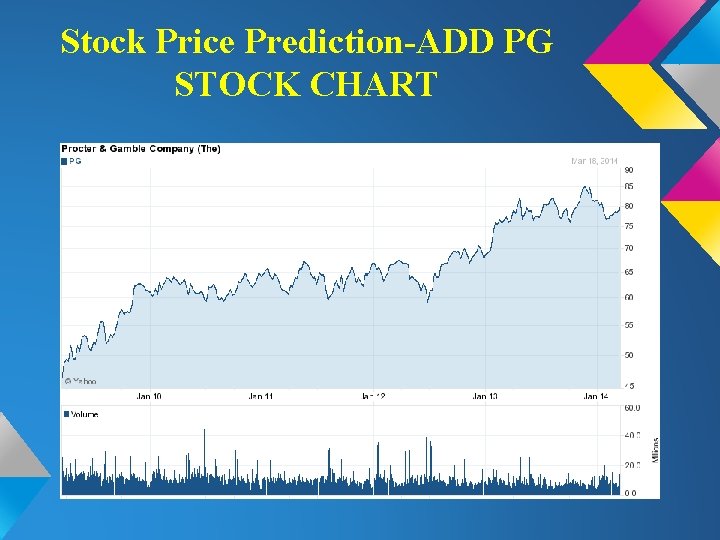
Stock Price Prediction-ADD PG STOCK CHART
5 KEY EVIDENCE ELEMENTS
- Slides: 31