Baisman Run Watershed with Oregon Ridge BC 48
 Rain Gauge")
Baisman Run Watershed with Oregon Ridge (BC 48) Rain Gauge
 Rain Gauge")
West Branch Herring Run Watershed with Jones Falls (JF 14) Rain Gauge
 7 6")
Precipitation at 2 Sites August 25, 2015 Rainfall Intensity (inches per hour) 7 6 5 Baisman's Run 4 WBHR 3 2 1 0 17: 00 17: 29 17: 58 18: 27 18: 56 Time 19: 24 19: 53 20: 22 20: 51

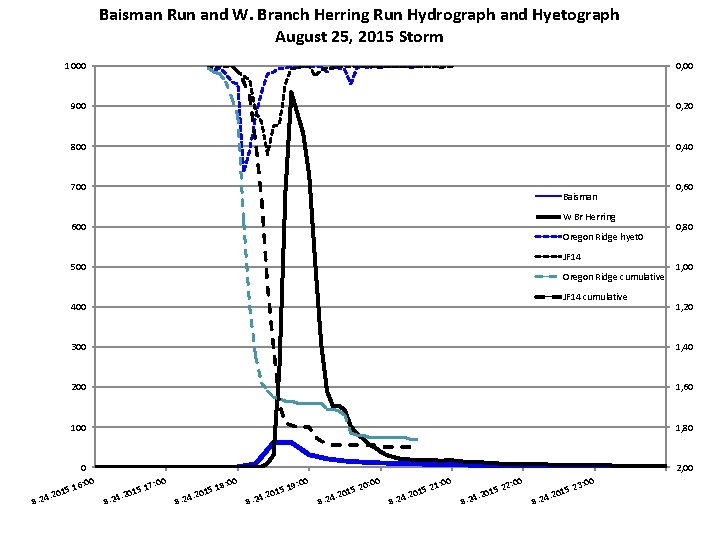
Hydrographs in 2 Watersheds August 24, 2015 Rain Storm 70, 00 CFS per square mile 60, 00 50, 00 Baisman's Run 40, 00 30, 00 20, 00 10, 00 0 3 6 9 12 15 18 21 24 27 30 33 36 39 42 45 48 51 54 57 60 63 66 69 72 75 78 81 84 87 90 93 96 99 102105108 Time (5 minute increments) Rain started at time 24 Rain ended at time 29

Calculation of Runoff Ratios in 2 Watersheds from the Same Rainstorm Line Units Explanation A sq mile / watershed Watershed area B sq ft / sq mile Conversion factor C sq ft/watersheed Calculated: A * B D E Total PCP (inches) Total PCP (feet) Measured cumulative total rain depth from rain gauge Calculated (D/12) Calculated total volume of water entering watershed in rain event: C * E F cu ft precip G Measured cumulative total volume of water leaving watershed during and after rain stream discharge cu ft. event from stream gauge H runoff ratio Calculated G / F Rain Gauge Oregon Ridge Jones Falls 14 Watershed W. Herring Baismans Run Branch Run 1. 47 27, 878, 40 0 40, 981, 24 8 2. 13 27, 878, 40 0 59, 380, 99 2 1. 86 0. 155 1. 91 0. 159 3 6, 352, 09 8 7. 5 % 475, 30 9, 451, 47 5 4, 438, 23 6 47. 0 %
 total (in. ) Dates of Storm November April May June")
Storm rainfall duration (hrs) total (in. ) Dates of Storm November April May June August October February June August Peak discharge (ft 3/s) Runoff ratio Runoff (% total Flood volume amount rainfall as (ft#) (in) runoff) 25, 18, 19, 27– 28, 2, 6, 3, 10– 11, 22, 13, 4, 2001 2002 2002 2003 3. 42 3. 08 0. 58 13 5. 42 0. 83 1 31. 33 8. 5 3. 25 1. 17 7. 83 1. 8 0. 93 0. 8 1. 57 0. 98 1. 06 1. 18 3. 06 2. 13 2. 27 0. 81 0. 64 367 180 401 78 247 466 725 197 253 1, 390 730 248 1, 451, 000 540, 000 834, 900 1, 265, 600 1, 038, 100 1, 133, 600 1, 641, 100 3, 021, 300 4, 871, 900 4, 933, 400 1, 529, 400 611, 500 0. 3 0. 11 0. 17 0. 26 0. 22 0. 24 0. 34 0. 63 1. 02 1. 03 0. 32 0. 13 16. 7 11. 8 21. 3 16. 8 22. 1 22. 3 29. 1 20. 6 47. 8 45. 4 39. 5 20. 0 September 18– 19, 2003 12. 08 0. 64 256 1, 838, 900 0. 38 60. 0 September 22– 23, October 14– 15, 2003 12. 17 5. 67 3. 15 2. 07 834 411 5, 067, 700 2, 555, 300 1. 06 0. 53 33. 6 25. 6 November 19, June 25, July 7, 2003 2004 8. 25 1. 33 2. 67 2. 09 0. 75 1. 92 700 295 945 3, 464, 800 1, 251, 720 3, 052, 250 0. 72 0. 26 0. 64 34. 6 34. 9 33. 2
- Slides: 7