
BAIKALGVD status results and plans Zh A Dzhilkibaev
BAIKAL-GVD: status, results and plans Zh. -A. Dzhilkibaev, INR (Moscow), for the Baikal Collaboration Amsterdam, October 17, 2015
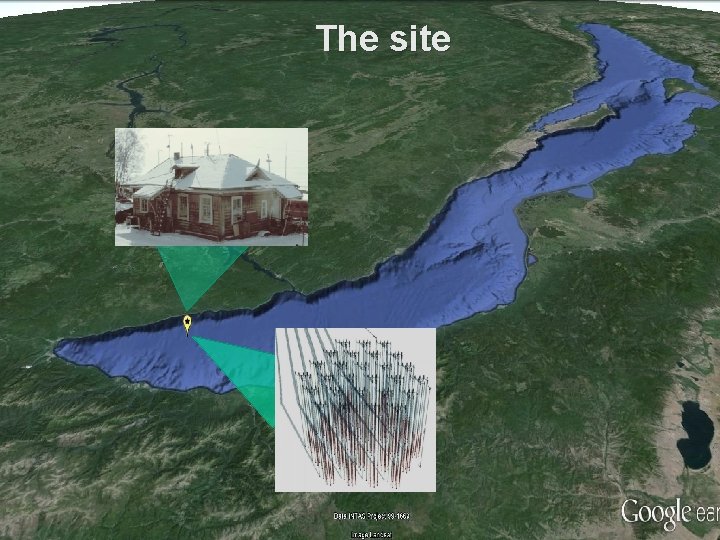
The site
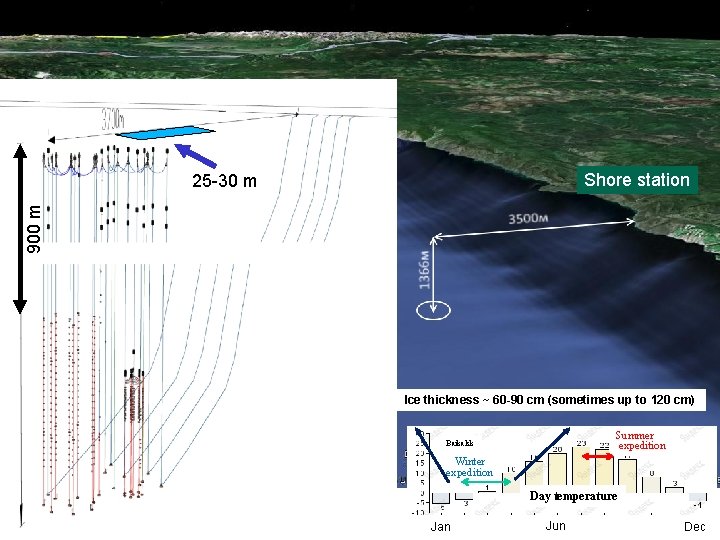
Shore station 900 m 25 -30 m Ice thickness ~ 60 -90 cm (sometimes up to 120 cm) Summer expedition Baikalsk Winter expedition Day temperature Jan Jun Dec
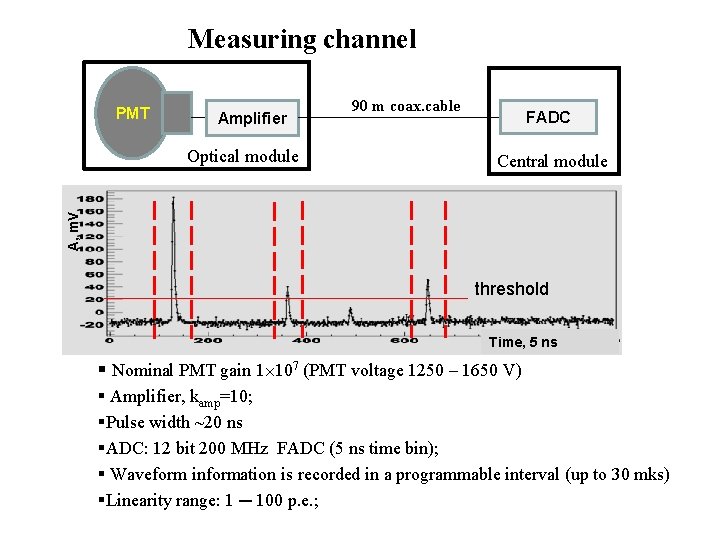
Measuring channel PMT Amplifier FADC Central module A, m. V Optical module 90 m coax. cable threshold Time, 5 ns § Nominal PMT gain 1 107 (PMT voltage 1250 – 1650 V) § Amplifier, kamp=10; §Pulse width ~20 ns §ADC: 12 bit 200 MHz FADC (5 ns time bin); § Waveform information is recorded in a programmable interval (up to 30 mks) §Linearity range: 1 ─ 100 p. e. ;
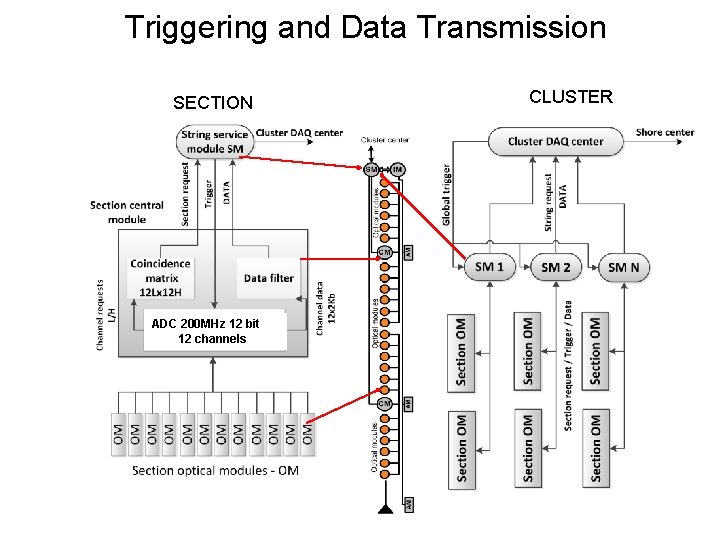
Triggering and Data Transmission SECTION ADC 200 MHz 12 bit 12 channels CLUSTER
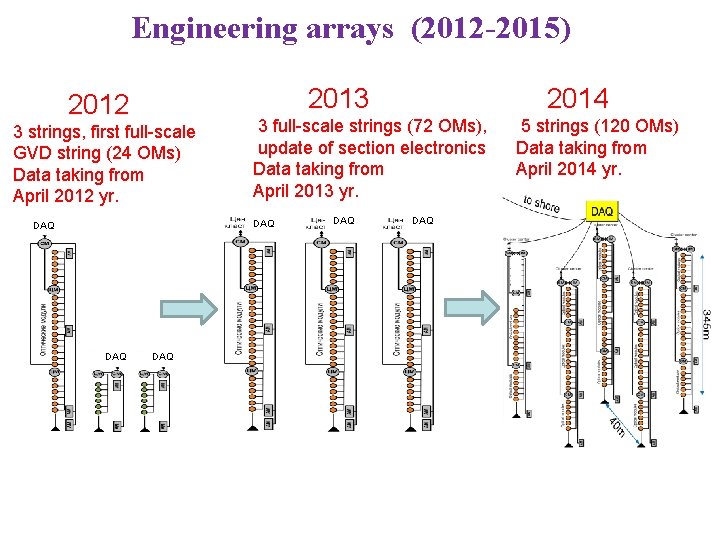
Engineering arrays (2012 -2015) 2013 2012 3 strings, first full-scale GVD string (24 ОМs) Data taking from April 2012 yr. 3 full-scale strings (72 OMs), update of section electronics Data taking from April 2013 yr. DAQ DAQ 2014 DAQ 5 strings (120 OMs) Data taking from April 2014 yr.
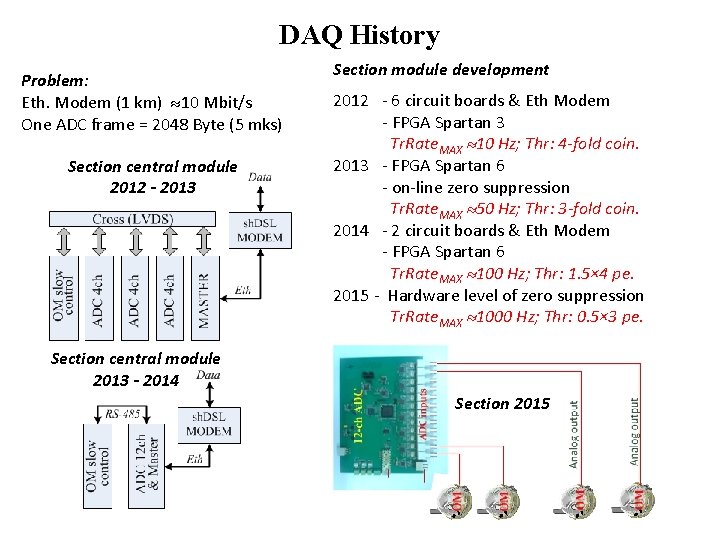
DAQ History Problem: Eth. Modem (1 km) 10 Mbit/s One ADC frame = 2048 Byte (5 mks) Section central module 2012 - 2013 Section module development 2012 - 6 circuit boards & Eth Modem - FPGA Spartan 3 Tr. Rate. MAX 10 Hz; Thr: 4 -fold coin. 2013 - FPGA Spartan 6 - on-line zero suppression Tr. Rate. MAX 50 Hz; Thr: 3 -fold coin. 2014 - 2 circuit boards & Eth Modem - FPGA Spartan 6 Tr. Rate. MAX 100 Hz; Thr: 1. 5× 4 pe. 2015 - Hardware level of zero suppression Tr. Rate. MAX 1000 Hz; Thr: 0. 5× 3 pe. Section central module 2013 - 2014 Section 2015
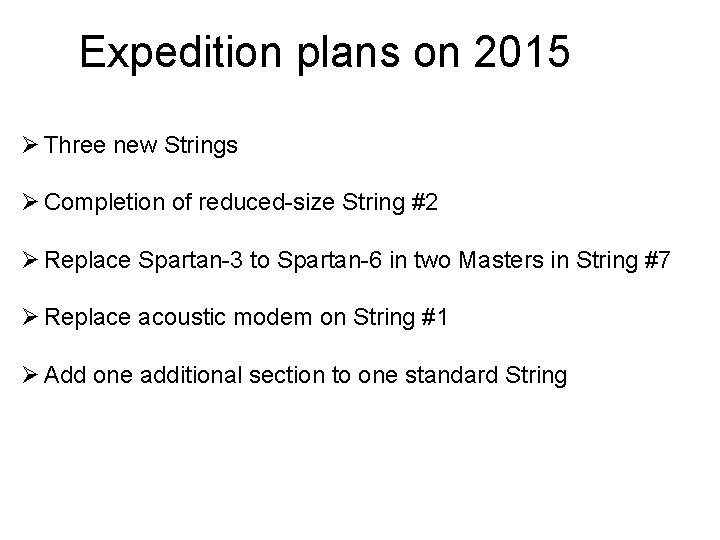
Expedition plans on 2015 Ø Three new Strings Ø Completion of reduced-size String #2 Ø Replace Spartan-3 to Spartan-6 in two Masters in String #7 Ø Replace acoustic modem on String #1 Ø Add one additional section to one standard String
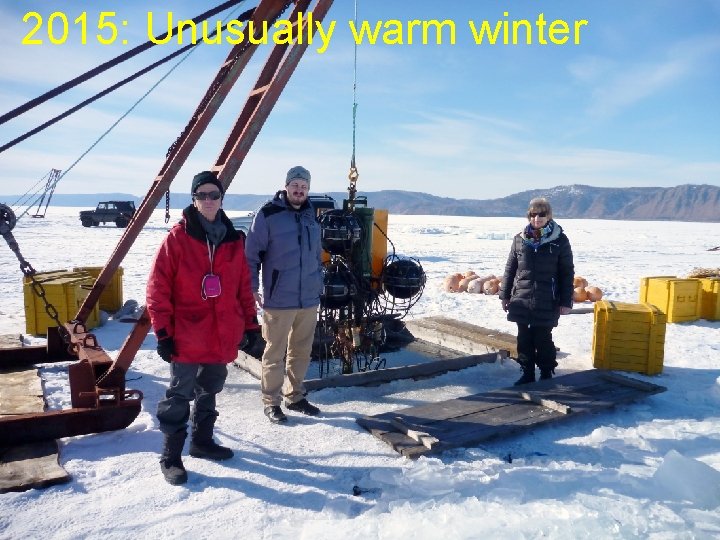
2015: Unusually warm winter

Stage 1 – 27. 03 10. 03 – work Divers Timeline: on ice 3 -5 days attach the rope to the top of the string Using echo-sounding device
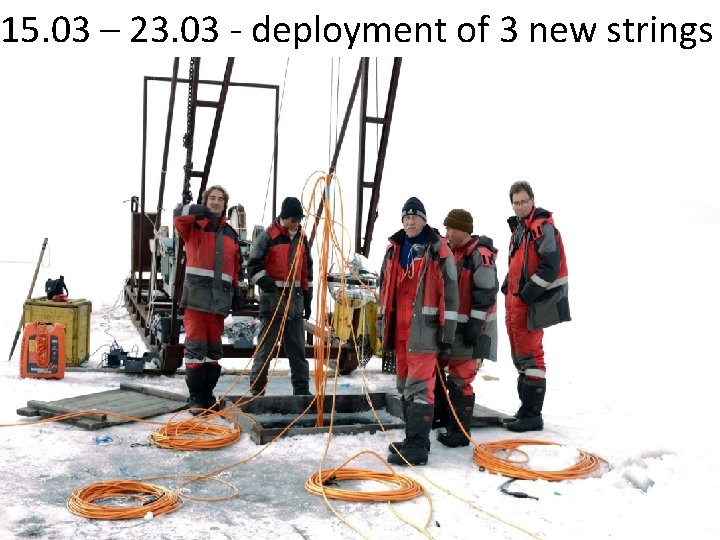
15. 03 – 23. 03 - deployment of 3 new strings
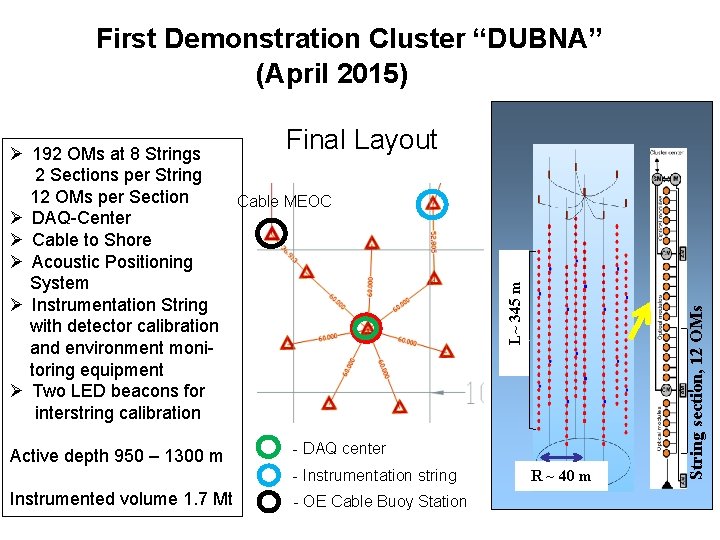
First Demonstration Cluster “DUBNA” (April 2015) - DAQ center - Instrumentation string Instrumented volume 1. 7 Mt - OE Cable Buoy Station R ~ 40 m String section, 12 OMs Active depth 950 – 1300 m L~ 345 m Final Layout Ø 192 OMs at 8 Strings 2 Sections per String 12 OMs per Section Cable MEOC Ø DAQ-Center Ø Cable to Shore Ø Acoustic Positioning System Ø Instrumentation String with detector calibration and environment monitoring equipment Ø Two LED beacons for interstring calibration
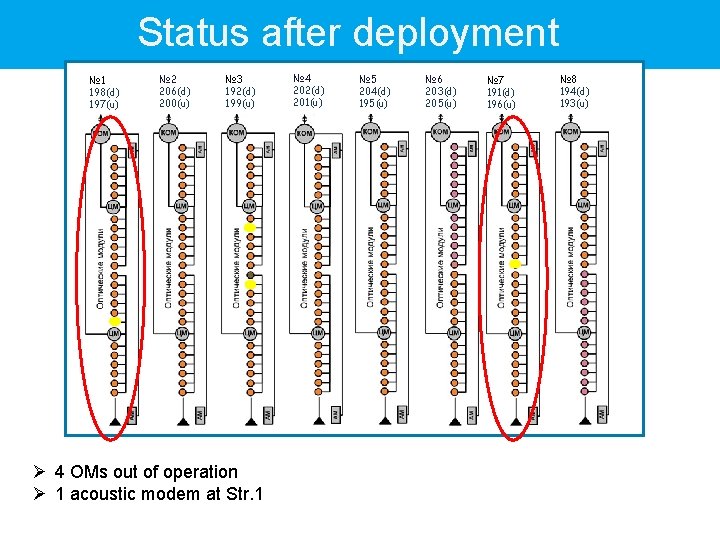
Status after deployment № 1 198(d) 197(u) № 2 206(d) 200(u) № 3 192(d) 199(u) Ø 4 OMs out of operation Ø 1 acoustic modem at Str. 1 № 4 202(d) 201(u) № 5 204(d) 195(u) № 6 203(d) 205(u) № 7 191(d) 196(u) № 8 194(d) 193(u)
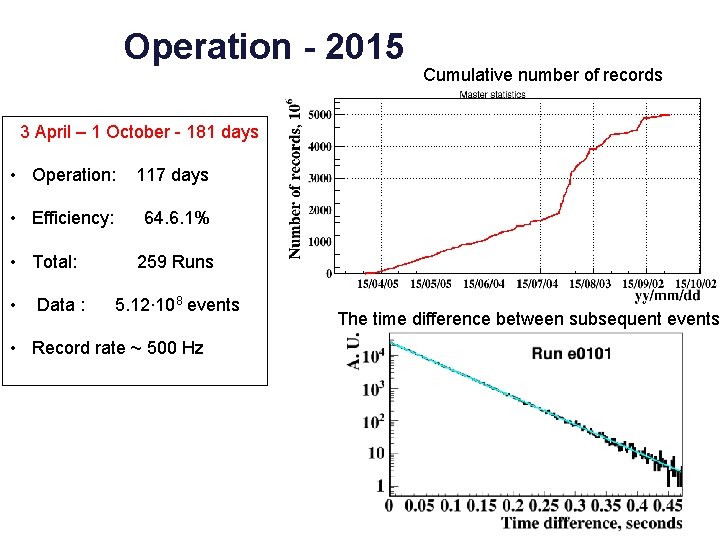
Operation - 2015 Cumulative number of records 3 April – 1 October - 181 days • Operation: 117 days • Efficiency: 64. 6. 1% • Total: • Data : 259 Runs 5. 12∙ 108 events • Record rate ~ 500 Hz The time difference between subsequent events
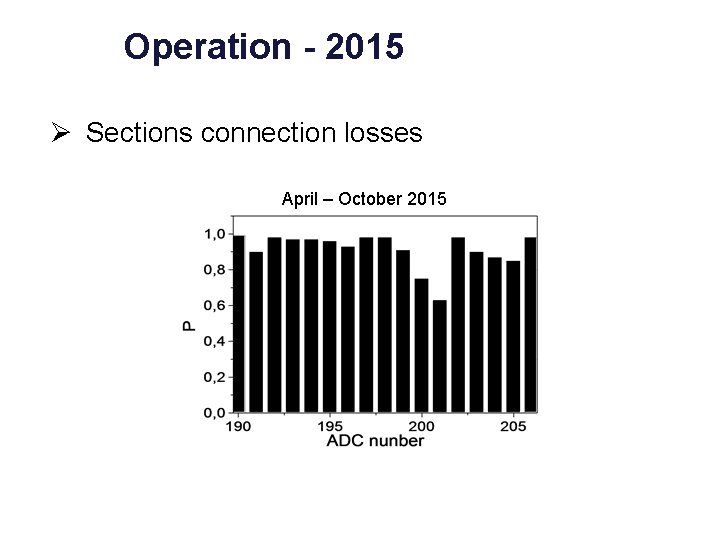
Operation - 2015 Ø Sections connection losses April – October 2015
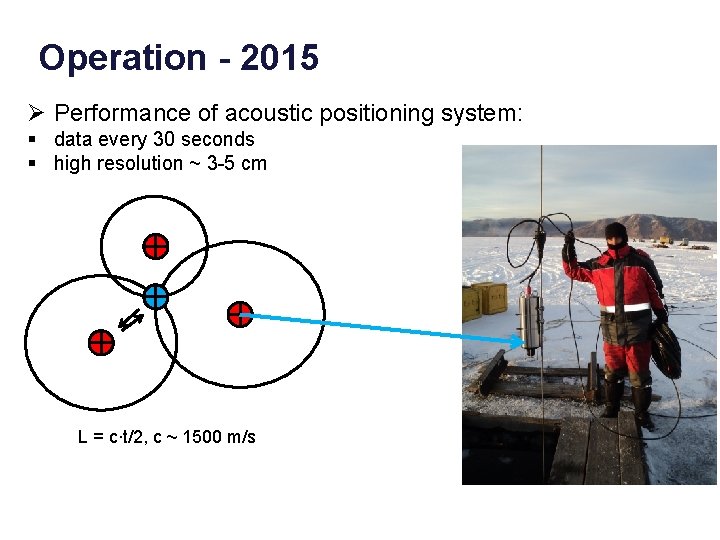
Operation - 2015 Ø Performance of acoustic positioning system: § data every 30 seconds § high resolution ~ 3 -5 cm L = c∙t/2, c ~ 1500 m/s

Z, m Y, m X, m Coordinates of transponder: May-2015 06/05/13 time X, m Y, m Z, m
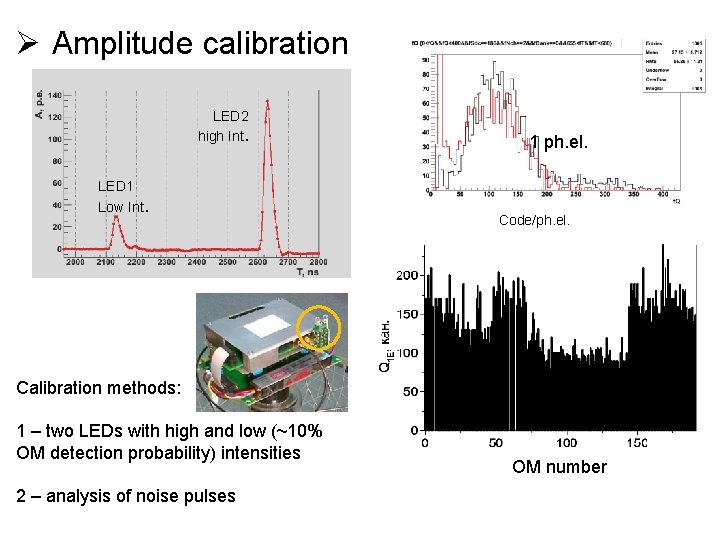
Ø Amplitude calibration LED 2 high Int. LED 1 Low Int. 1 ph. el. Code/ph. el. Calibration methods: 1 – two LEDs with high and low (~10% OM detection probability) intensities 2 – analysis of noise pulses OM number
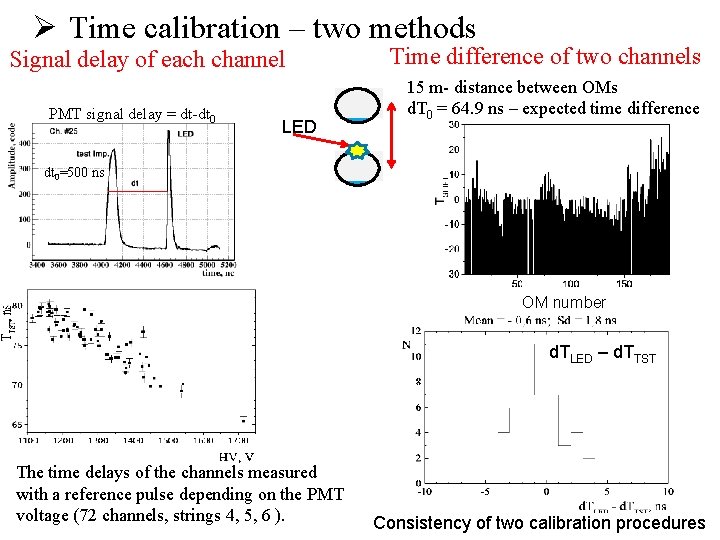
Ø Time calibration – two methods Signal delay of each channel PMT signal delay = dt-dt 0 LED Time difference of two channels 15 m- distance between OMs d. T 0 = 64. 9 ns – expected time difference dt 0=500 ns OM number d. TLED – d. TTST The time delays of the channels measured with a reference pulse depending on the PMT voltage (72 channels, strings 4, 5, 6 ). Consistency of two calibration procedures
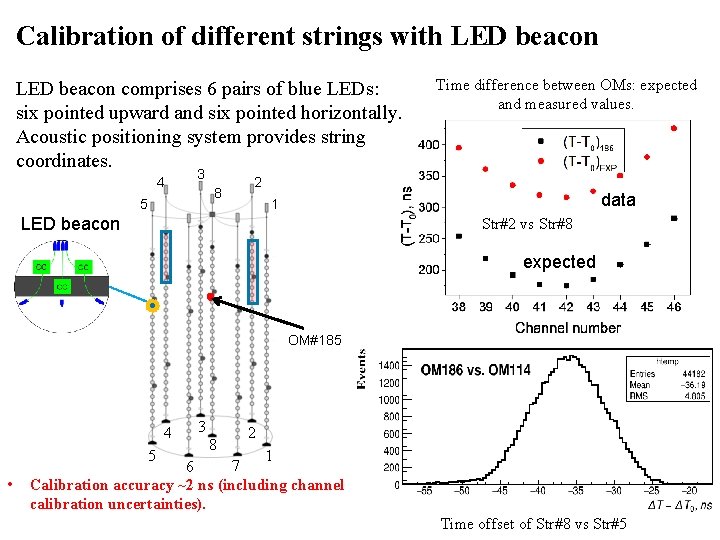
Calibration of different strings with LED beacon comprises 6 pairs of blue LEDs: six pointed upward and six pointed horizontally. Acoustic positioning system provides string coordinates. 4 3 8 5 Time difference between OMs: expected and measured values. 2 data 1 LED beacon Str#2 vs Str#8 expected OM#185 4 5 • 3 8 2 1 7 6 Calibration accuracy ~2 ns (including channel calibration uncertainties). Time offset of Str#8 vs Str#5
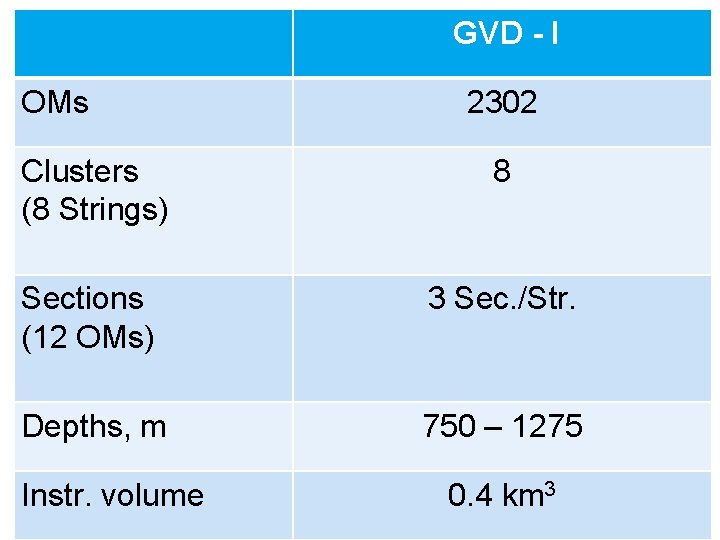
GVD - I OMs 2302 Clusters (8 Strings) 8 Sections (12 OMs) 3 Sec. /Str. Depths, m 750 – 1275 Instr. volume 0. 4 km 3
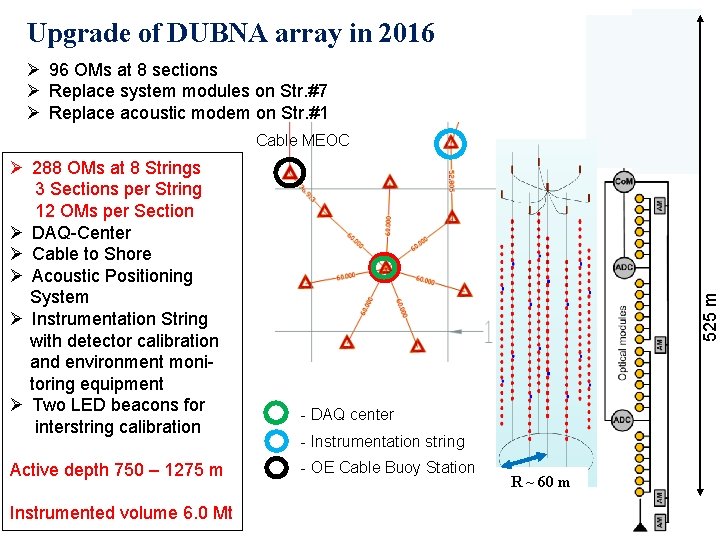
Upgrade of DUBNA array in 2016 Ø 96 OMs at 8 sections Ø Replace system modules on Str. #7 Ø Replace acoustic modem on Str. #1 Ø 288 OMs at 8 Strings 3 Sections per String 12 OMs per Section Ø DAQ-Center Ø Cable to Shore Ø Acoustic Positioning System Ø Instrumentation String with detector calibration and environment monitoring equipment Ø Two LED beacons for interstring calibration Active depth 750 – 1275 m Instrumented volume 6. 0 Mt 525 m Cable MEOC - DAQ center - Instrumentation string - OE Cable Buoy Station R ~ 60 m
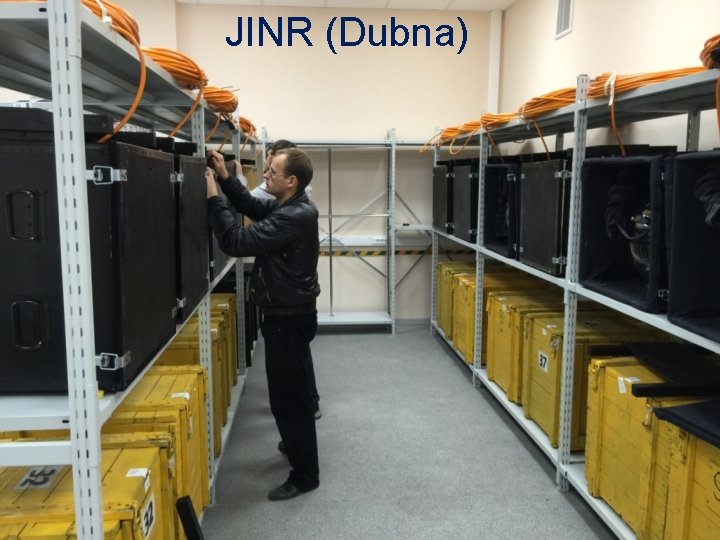
JINR (Dubna)
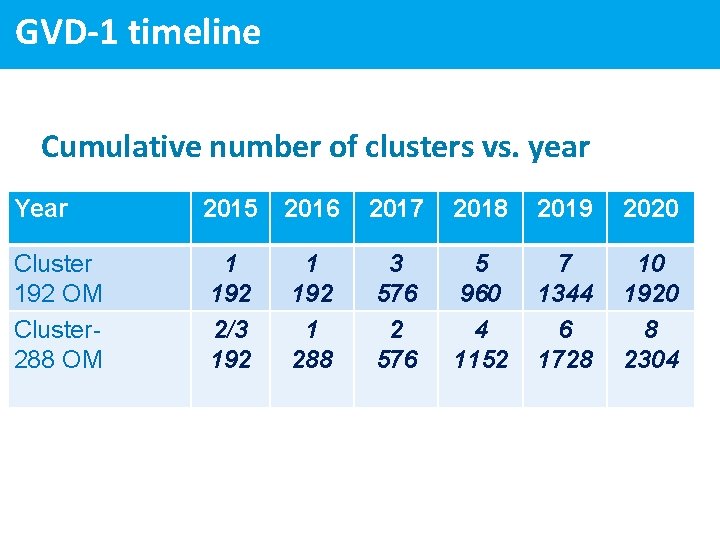
GVD-1 timeline -pro Cumulative number of clusters vs. year Year 2015 2016 2017 2018 2019 2020 Cluster 192 OM Cluster 288 OM 1 192 2/3 192 1 288 3 576 2 576 5 960 4 1152 7 1344 6 1728 10 1920 8 2304
Conclusion: • The first demonstration cluster “Dubna” of GVD was deployed and commissioned in April 2015 • In the 2016 cluster “Dubna” will be upgraded to baseline configuration comprising 288 OMs • Completion of the GVD Stage 1 is expected in 2020

2015: FIRST GVD-CLUSTER “DUBNA”
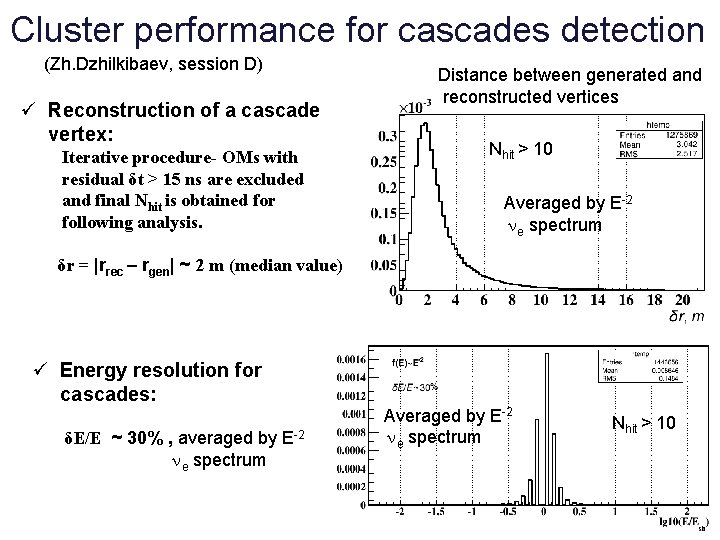
Cluster performance for cascades detection (Zh. Dzhilkibaev, session D) ü Reconstruction of a cascade vertex: Iterative procedure- OMs with residual δt > 15 ns are excluded and final Nhit is obtained for following analysis. Distance between generated and reconstructed vertices Nhit > 10 Averaged by E-2 e spectrum δr = |rrec – rgen| ~ 2 m (median value) ü Energy resolution for cascades: δE/E ~ 30% , averaged by e spectrum E-2 Averaged by E-2 e spectrum Nhit > 10
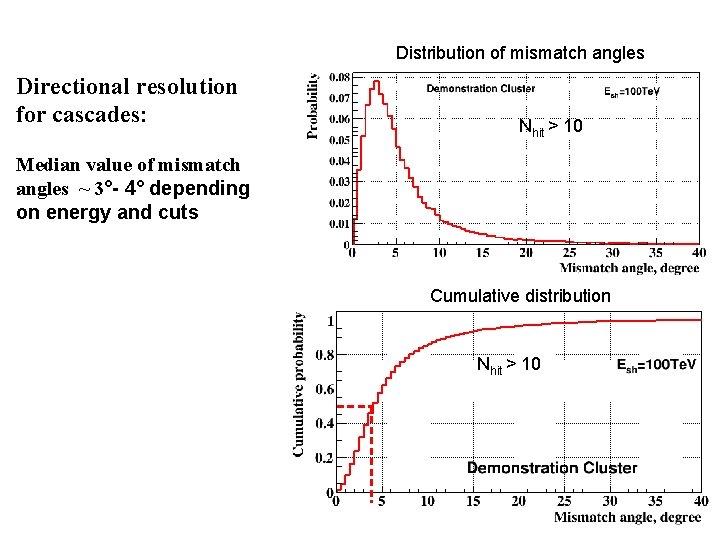
Distribution of mismatch angles Directional resolution for cascades: Nhit > 10 Median value of mismatch angles ~ 3°- 4° depending on energy and cuts Cumulative distribution Nhit > 10
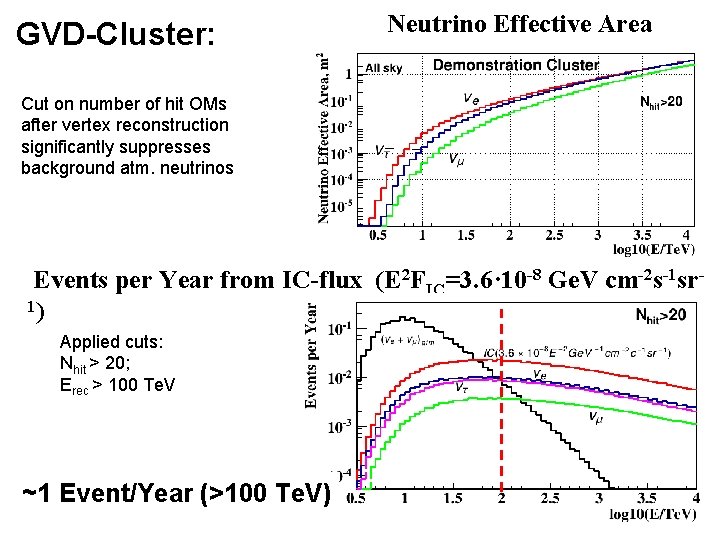
GVD-Cluster: Neutrino Effective Area Cut on number of hit OMs after vertex reconstruction significantly suppresses background atm. neutrinos Events per Year from IC-flux (E 2 FIC=3. 6· 10 -8 Ge. V cm-2 s-1 sr 1) Applied cuts: Nhit > 20; Erec > 100 Te. V ~1 Event/Year (>100 Te. V)
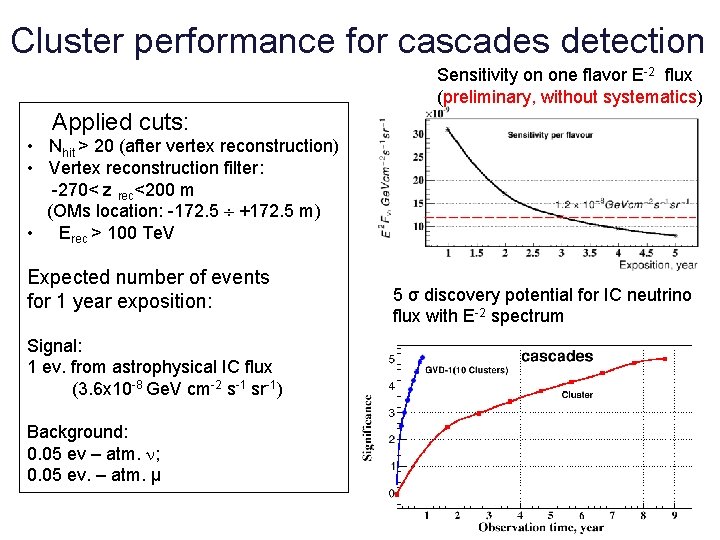
Cluster performance for cascades detection Sensitivity on one flavor E-2 flux (preliminary, without systematics) Applied cuts: • Nhit > 20 (after vertex reconstruction) • Vertex reconstruction filter: -270< z rec<200 m (OMs location: -172. 5 +172. 5 m) • Erec > 100 Te. V Expected number of events for 1 year exposition: Signal: 1 ev. from astrophysical IC flux (3. 6 x 10 -8 Ge. V cm-2 s-1 sr-1) Background: 0. 05 ev – atm. ; 0. 05 ev. – atm. μ 5 σ discovery potential for IC neutrino flux with E-2 spectrum
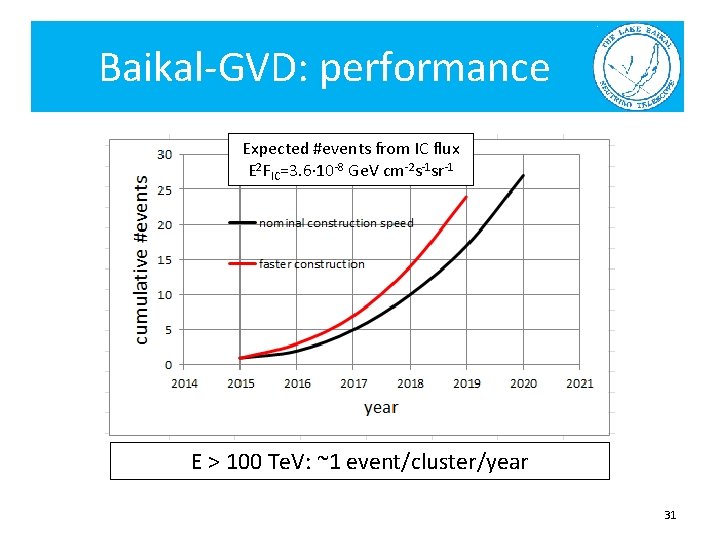
Baikal-GVD: performance Expected #events from IC flux E 2 FIC=3. 6· 10 -8 Ge. V cm-2 s-1 sr-1 E > 100 Te. V: ~1 event/cluster/year 31
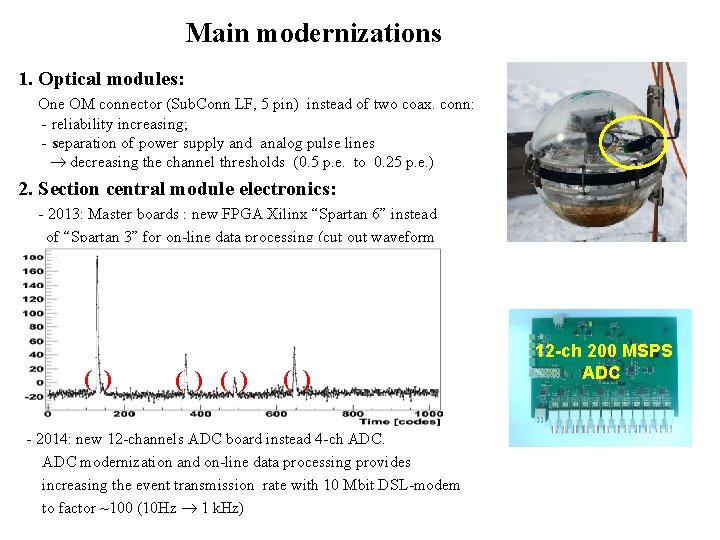
Main modernizations 1. Optical modules: One OM connector (Sub. Conn LF, 5 pin) instead of two coax. conn: - reliability increasing; - separation of power supply and analog pulse lines decreasing the channel thresholds (0. 5 p. e. to 0. 25 p. e. ) 2. Section central module electronics: - 2013: Master boards : new FPGA Xilinx “Spartan 6” instead of “Spartan 3” for on-line data processing (cut out waveform data without pulses). ( ) ( ) - 2014: new 12 -channels ADC board instead 4 -ch ADC modernization and on-line data processing provides increasing the event transmission rate with 10 Mbit DSL-modem to factor ~100 (10 Hz 1 k. Hz) 12 -ch 200 MSPS ADC
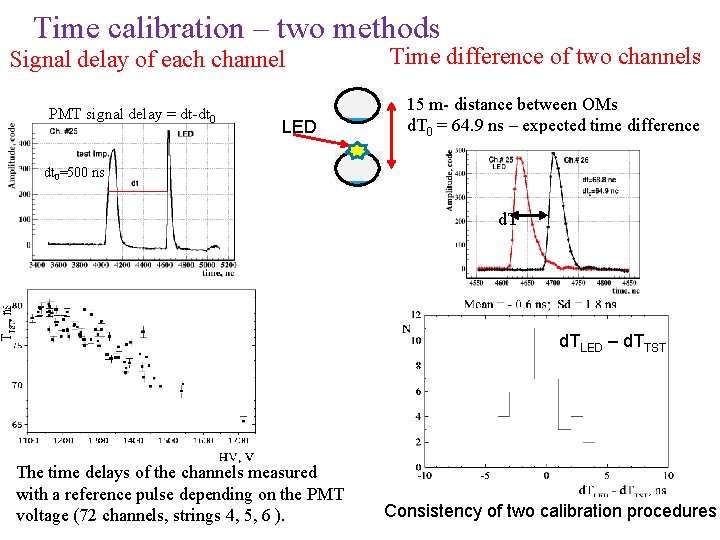
Time calibration – two methods Signal delay of each channel PMT signal delay = dt-dt 0 LED Time difference of two channels 15 m- distance between OMs d. T 0 = 64. 9 ns – expected time difference dt 0=500 ns d. TLED – d. TTST The time delays of the channels measured with a reference pulse depending on the PMT voltage (72 channels, strings 4, 5, 6 ). Consistency of two calibration procedures
- Slides: 33