Background Slides from Lecture 1 MultiWavelength SFR Diagnostics

Background Slides from Lecture 1
![Multi-Wavelength SFR Diagnostics `calorimetric’ IR ( m) UV [OII] H 1 10 P Dale](http://slidetodoc.com/presentation_image/b55546ceb27017cd81f555accf4fd184/image-2.jpg "Multi-Wavelength SFR Diagnostics `calorimetric’ IR ( m) UV [OII] H 1 10 P Dale")
Multi-Wavelength SFR Diagnostics `calorimetric’ IR ( m) UV [OII] H 1 10 P Dale et al. 2007, Ap. J, 655, 863 8 m 24 m 100 70 m 160 m 1000
")
0. 1 1 10 100 mag (AV)
 IRAC 8. 0 m H + R MIPS")
GALEX FUV + NUV (1500/2500 A) IRAC 8. 0 m H + R MIPS 24 m
 • complete IRAC, MIPS imaging of 75 nearby")
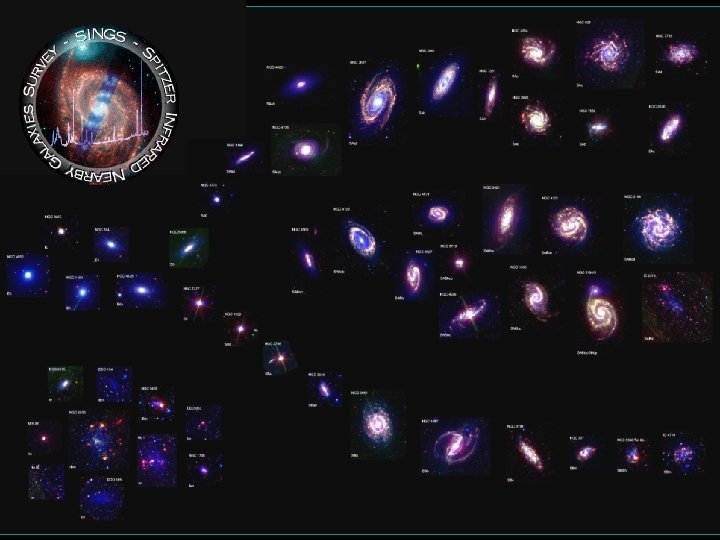
Spitzer Infrared Nearby Galaxies Survey (SINGS) • complete IRAC, MIPS imaging of 75 nearby galaxies (3. 5 – 160 m) • IRS, MIPS radial strip maps (10 – 100 m) • IRS maps of centers, 75 extranuclear sources (5– 37 m) • ancillary imaging campaign covering UV to radio Kennicutt et al. 2003, PASP, 115, 928

UV Continuum Emission

Ultraviolet stellar continuum: key advantages - direct photospheric measure of young massive stars primary groundbased SFR tracer for galaxies at z>2 - Dale et al. 2007, Ap. J, 655, 863 However: - heavily attenuated by dust. Dust `correction’ methods have limits (age-dust degeneracy). dependent on the stellar population mix, usually measures timescales of ~100 Myr.

GALEX Mission - all-sky survey - 5 arcsec resolution - 1500 A, 2500 A to AB = 20 -21 - 10, 000 galaxies to z=0. 02 - deep surveys to AB = 25. 5, 26. 5 - launched April 2003

Steidel et al. 1996, Ap. J, 462, L 17

Building an Evolutionary Synthesis Model + Kurucz 1979, Ap. JS, 40, 1 Maeder, Meynet 1988, A&AS, 76, 411 single star SED evolution model
 “continuous star formation” models Leitherer et al.")
“single burst models” (single age star clusters) “continuous star formation” models Leitherer et al. 1999, Ap. JS, 123, 3 “Starburst 99”

apply evolutionary synthesis maodels to constrain IMF Kennicutt, Tamblyn, Congdon 1994, Ap. J, 435, 22

UV, Dust, and Age Starbursts (Calzetti et al. 1994, 1995, 1996, 1997, 2000, Meurer et al. 1999, Goldader et al. 2002) 26 A dusty stellar population may have similar UV characteristics of an old population

Blue= starbursts Red= normal SF 26

M 51 Calzetti et al. 2005, Ap. J, 633, 871 FUV, H , 24 m 3. 6, 4. 5, 5. 8, 8. 0 m

Photoionization Methods: Emission Lines • for ionization-bounded region observed recombination line flux scales with ionization rate • ionization dominated by massive stars (M > 10 Mo), so nebular emission traces SFR in last 3 -5 Myr • ionizing UV reprocessed through few nebular lines, detectable to large distances • only traces massive SFR, total rates sensitive to IMF extrapolation • SFRs subject to systematic errors from extinction, escape of ionizing radiation from galaxy SINGG survey, G. Meurer et al. (NOAO)

Kennicutt 1992, Ap. JS, 79, 255

Local H Surveys Survey GOLDMine MOSAIC H GS Ngal Selection 277 ~1000 magnitude Coma/Virgo G. Gavazzi H Abell clusters R. Kennicutt mag/volume field (<40 Mpc) P. James SINGG/SUNGG* 468 HIPASS field (<40 Mpc) G. Meurer STARFORM 150 volume field (<25 Mpc) S. Hameed 11 HUGS *** 470 volume field (<11 Mpc) R. Kennicutt magnitude isolated field L. Montenegro multi-param <30 Mpc R. Kennicutt mag field dwarfs L. van Zee 376 obj prism field J. Gallego ~2200 obj prism field J. Salzer AMIGA 450 PI ~270 SINGS *** 75 SMUDGES ~1000 UCM KISS ** paired GALEX survey

Photoionization Methods: Emission Lines • for ionization-bounded region observed recombination line flux scales with ionization rate • ionization dominated by massive stars (M > 10 Mo), so nebular emission traces SFR in last 3 -5 Myr • ionizing UV reprocessed through few nebular lines, detectable to large distances • only traces massive SFR, total rates sensitive to IMF extrapolation • SFRs subject to systematic errors from extinction, escape of ionizing radiation from galaxy SINGG survey, G. Meurer et al. (NOAO)

Leakage of Ionizing Flux at z ~ 3 Shapley et al. 2006, Ap. J, 651, 688

composite spectrum Shapley et al. 2006, Ap. J, 651, 688

HII regions Calzetti et al. , Ap. J, submitted Kennicutt & Moustakas, in prep galaxies (integrated fluxes)
 - Paschen- (1. 9 m) -")
Other Emission Lines - H (0. 48 m) - Paschen- (1. 9 m) - Brackett-g (2. 2 m) - [OII] (0. 37 m) - Lyman- (0. 12 m) Scoville et al. 2000, AJ, 122, 3017

Wavelength

Moustakas, Kennicutt, Tremonti 2006, Ap. J, 642, 775

Moustakas et al. 2006, Ap. J, 642, 775
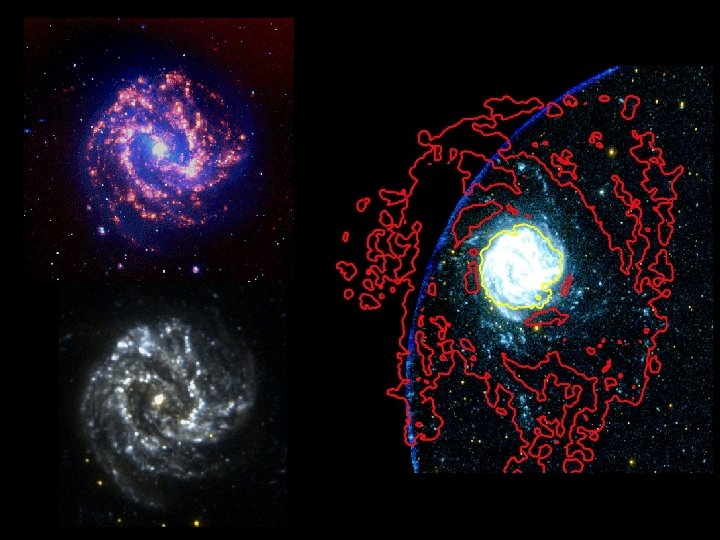
 SINGG: Survey for SINGG: in. Survey for Ionization")
11 Mpc Ha/Ultraviolet Survey (11 HUGS) SINGG: Survey for SINGG: in. Survey for Ionization Neutral-Gas Ionization in Neutral. Galaxies M 83 = NGC 5236 (Sc)

Lecture 2 Begins Here

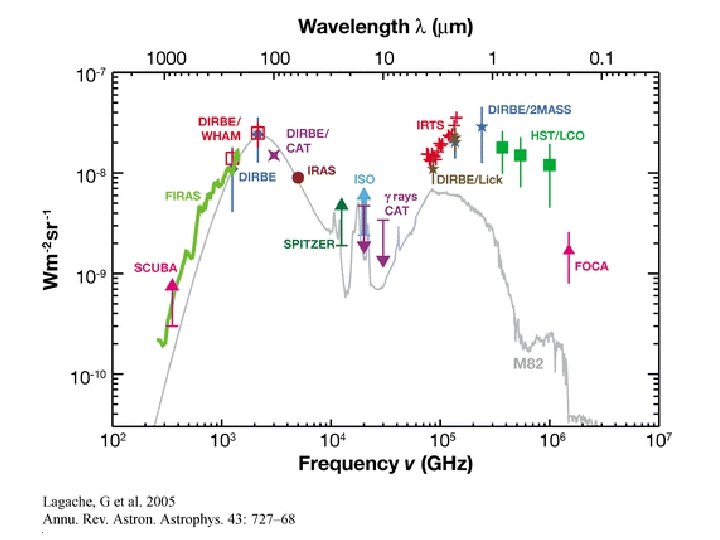
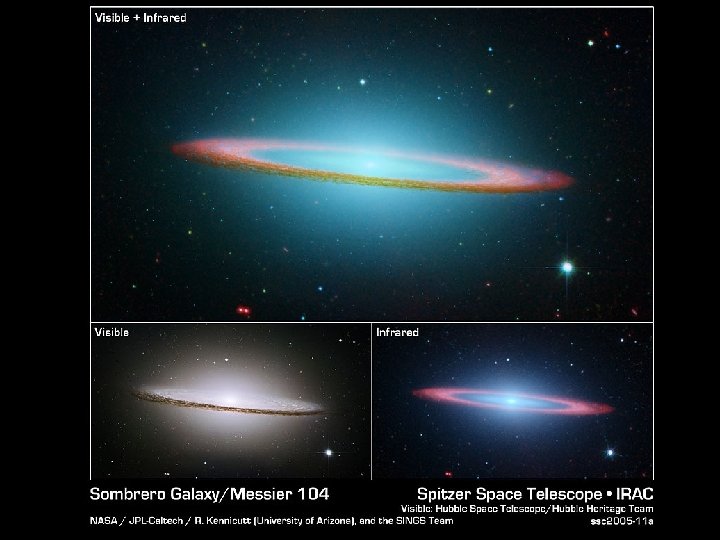
Dust Emission • Interstellar dust absorbs ~50% of starlight in galaxies, re-radiates in thermal infrared (3– 1000 m) • Provides near-bolometric measure of SFR in dusty starbursts, where absorbed fraction ~100% • Largest systematic errors from non-absorbed star formation and dust heated by older stars • Different components of IR trace distinct dust species and stellar sub-populations
 1 10 8")
FIR to SFR? Dale et al. 2007 `calorimetric’ IR ( m) 1 10 8 m 24 m 100 70 m FIR - sensitive to heating from old stellar populations 8 m - mostly single photon heating (PAH emission) 24 m - both thermal and single photon heating 70 m and 160 m - mostly thermal, also from old stars 160 m 1000
 C. Tremonti")
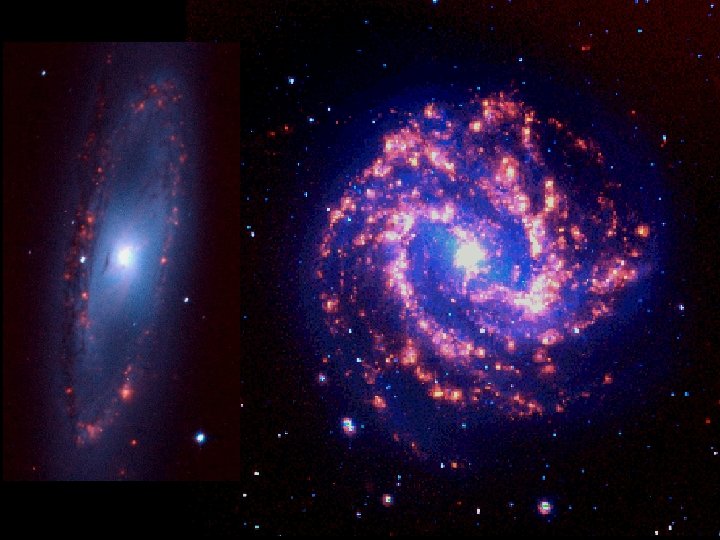
NGC 628 (M 74) C. Tremonti

Moustakas et al. 2006, Ap. J, 642, 775
")
HII regions Calzetti et al. 2007 Kennicutt & Moustakas 2007 galaxies (integrated fluxes)
 IRAC 8. 0 m H + R MIPS")
GALEX FUV + NUV (1500/2500 A) IRAC 8. 0 m H + R MIPS 24 m

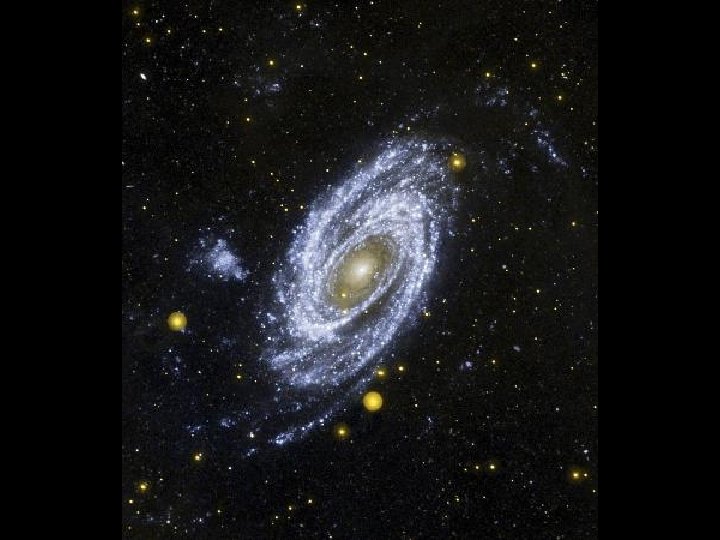
M 81 H + R

M 81 24µm 70µm 160µm

Radio Continuum Emission • exploits tight observed relation between 1. 4 GHz radio continuum (synchrotron) and FIR luminosity • correlation may reflect CR particle injection/acceleration by supernova remnants, and thus scale with SFR • no ab initio SFR calibration, bootstrapped from FIR calibration • valuable method when no other tracer is available Bell 2003, Ap. J, 586, 794
 SFR (Mo yr-1) = 1. 4 x 10")
Cookbook Extinction-Free Limit (Salpeter IMF, Z=ZSun) SFR (Mo yr-1) = 1. 4 x 10 -28 L n (1500) ergs/s/Hz SFR (Mo yr-1) = 7. 9 x 10 -42 L (H ) (ergs/s) Extinction-Dominated Limit; SF Dominated SFR (Mo yr-1) = 4. 5 x 10 -44 L (FIR) (ergs/s) SFR (Mo yr-1) = 5. 5 x 10 -29 L (1. 4 GHz) (ergs/Hz) Composite: SF Dominated Limit SFR (Mo yr-1) = 7. 9 x 10 -42 [L H , obs + a L 24 m ] (erg s-1) [a = 0. 15 – 0. 31] SFR (Mo yr-1) = 4. 5 x 10 -44 [L(UV) + L (FIR)] (ergs/s)

General Points and Cautions • Different emission components trace distinct stellar populations and ages – nebular emission lines and resolved 24 m dust sources trace ionizing stellar population, with ages <5 -10 Myr – UV starlight mainly traces “intermediate” age population, ages 10 -200 Myr – diffuse dust emission and PAH emission trace same “intermediate” age and older stars– 10 Myr to 10 Gyr(!) • Consequence: it is important to match the SFR tracer to the application of interest – emission lines – Schmidt law, early SF phases – UV – time-averaged SFR and SFR in low surface brightness systems – dust emission – high optical depth regions • Multiple tracers can constrain SF history, properties of starbursts, IMF, etc.


Demographics of Local Star-Forming Galaxies and Starbursts M 82: Spitzer/CXO/HST
 – resolved UV radio mapping")
Primary Datasets • Spitzer Infrared Nearby Galaxies Survey (SINGS) – resolved UV radio mapping of 75 galaxies – selection: maximize diversity in type, mass, IR/optical • 11 Mpc H /Ultraviolet Survey (11 HUGS) – resolved H , UV imaging, integrated/resolved IR of 400 galaxies – selection: volume-complete within 11 Mpc (S-Irr) • Survey for Ionization in Neutral-Gas Galaxies (SINGG) – resolved H , UV imaging, integrated/resolved IR of 500 galaxies – selection: HI-complete in 3 redshift slices • Integrated Measurements – Ha flux catalogue (+IR, UV) for >3000 galaxies within 150 Mpc - integrated spectra (+IR, UV) for ~600 galaxies in same volume (Moustakas & Kennicutt 2006, 2007)
, J.")
Thanks to: S. Akiyama, J. Lee, C. Tremonti, J. Moustakas, C. Tremonti (Arizona), J. Funes (Vatican), S. Sakai (UCLA), L. van Zee (Indiana) + The SINGS Team: RCK, D. Calzetti, L. Armus, G. Bendo, C. Bot, J. Cannon, D. Dale, B. Draine, C. Engelbracht, K. Gordon, G. Helou, D. Hollenbach, T. Jarrett, S. Kendall, L. Kewley, C. Leitherer, A. Li, S. Malhotra, M. Meyer, E. Murphy, M. Regan, G. Rieke, M. Rieke, H. Roussel, K. Sheth, JD Smith, M. Thornley, F. Walter

Spitzer Local Volume Legacy • UV/H /IR census of local volume • HST ANGST sample to 3. 5 Mpc • GALEX 11 HUGS sampel to 11 Mpc

The Starburst Bestiary GEHRs nuclear starbursts SSCs circumnuclear starbursts HII galaxies clumpy irregular galaxies ELGs Ly- galaxies CNELGs E+A galaxies W-R galaxies K+A galaxies BCGs LBGs BCDs DRGs LIGs, LIRGs EROs ULIGs, ULIRGs SCUBA galaxies LUVGs, UVLGs extreme starbursts
 -")
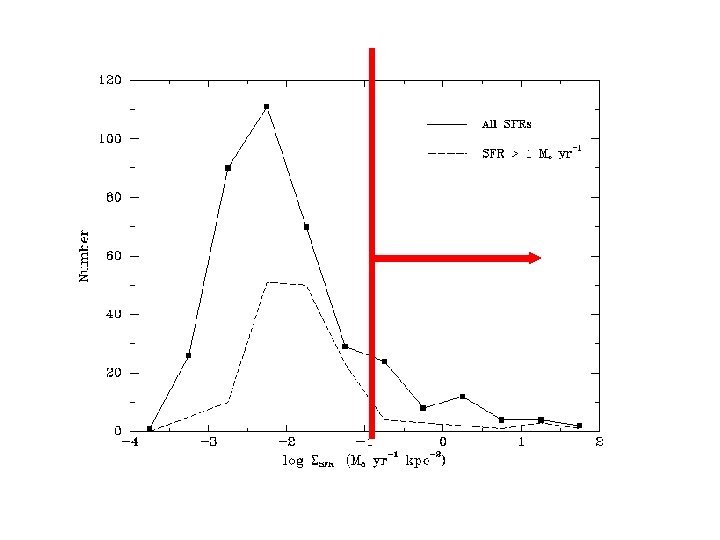
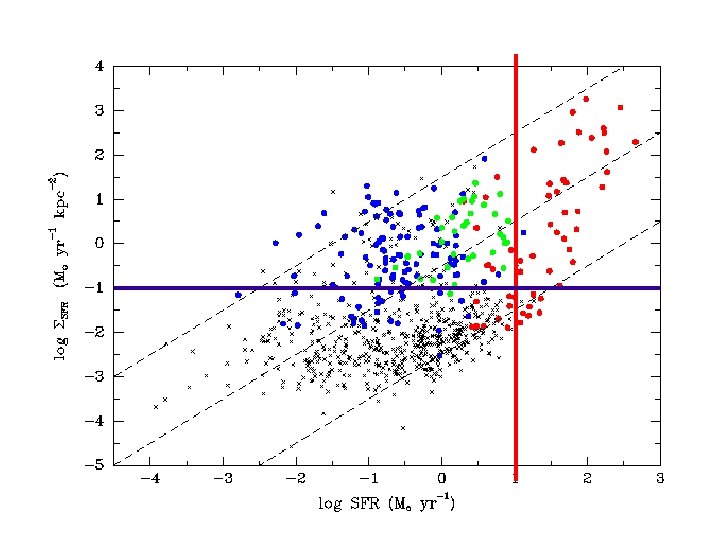
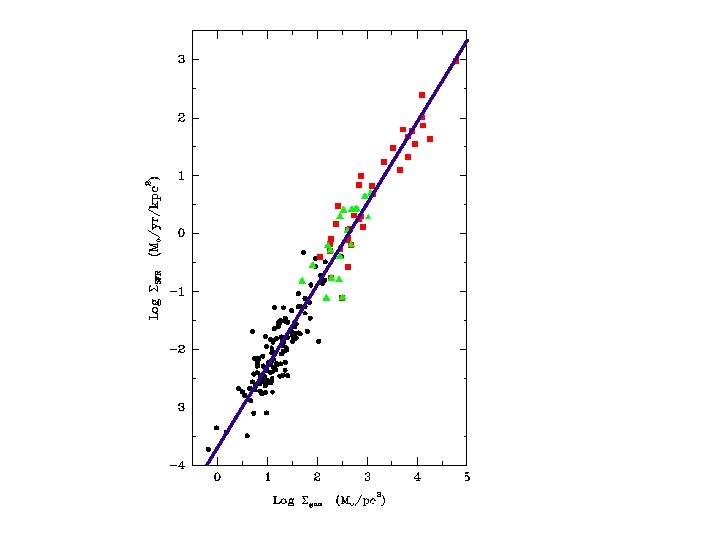
Demographics of Star-Forming Galaxies Baseline: 11 Mpc H + Ultraviolet Survey (11 HUGS) - all known galaxies w/gas within 11 Mpc + Ursa Major cluster - companion GALEX Legacy survey coming… Quantify SF properties in terms of 3 observables: • absolute SFR (Mo/yr) – from H corrected for [NII], dust • SFR density, intensity (Mo/yr/kpc 2) – defined as SFR/p. R 2 SF – correlates strongly with gas density, SF timescale • normalized SFR/mass; birthrate parameter b – ratio of present SFR to average past SFR – defined here globally – integrated over galaxy – primary evolutionary variable along Hubble sequence

11 HUGS/LVL Sample R = 100 pc 1 kpc 10 kpc

11 HUGS Sample + H GS + Goldmine Virgo Sample (James et al. 2003; Gavazzi et al. 2003)

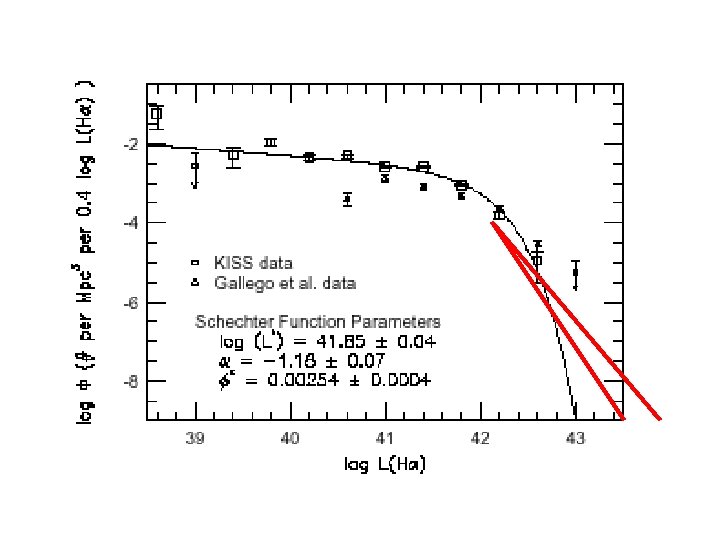
SFR* ~5 Mo/yr Gronwall 1998
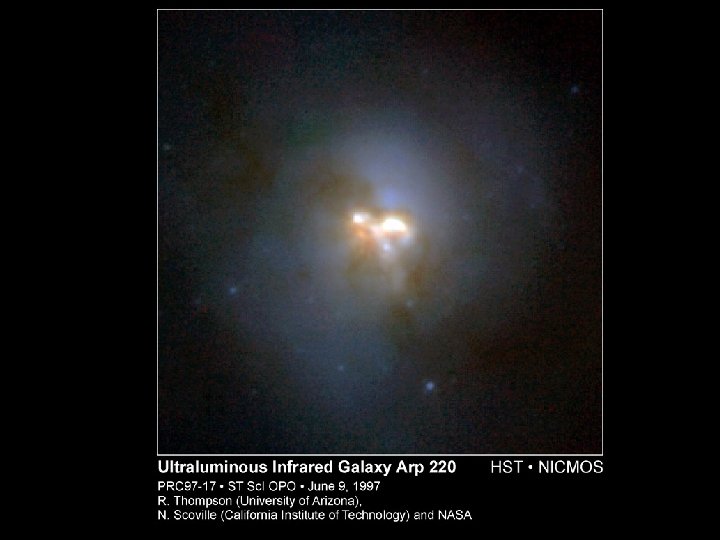
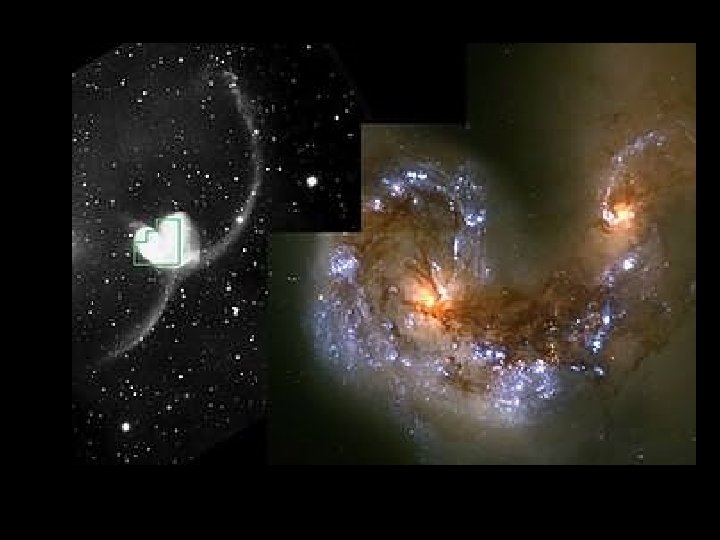
 merger-driven inflows,")
LIGs, ULIGs (Dopita et al. , Soifer et al, Scoville et al) merger-driven inflows, starbursts

Martin 2005, Ap. J, 619, L 59
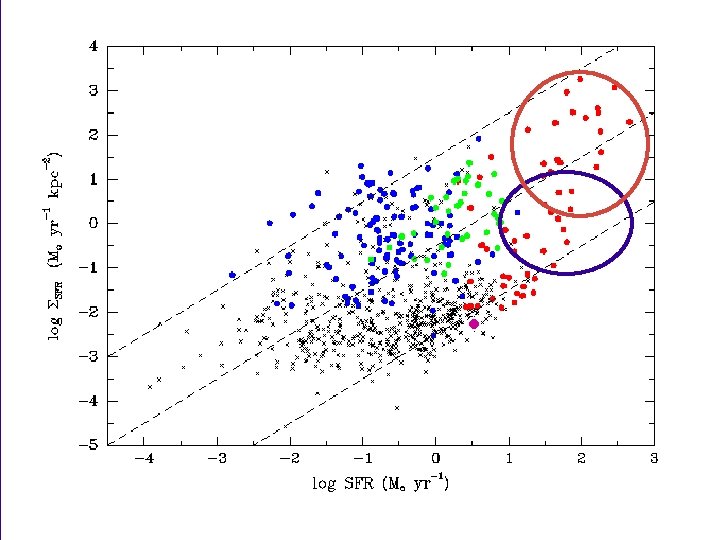

Mgas/t. Hubble Mgas/tdyn 1 O 5 V/3_Myr Meurer limit ” 5. 0 @ 4 c p M Sgas/t. Hubble Scrit
")
Lecture 2 Ended Here Extra Slides Follow (from Lecture 4)

108 109 1010 1011 Mo
")
11 MPC + BCGs (Gil de Paz et al. 2003)

11 HUGS Sample + H GS + Goldmine Virgo Sample (James et al. 2003; Gavazzi et al. 2003)

Disk SFRs: Main Results Kennicutt 1998, ARAA, 36, 189 Brinchmann et al. 2004, MNRAS, 351, 1151 • spectra best fitted with IMF ~ Salpeter for M* > 1 Mo • SF is ubiquitous when cold gas is present - <4% S-Irr non-detects in H , nearly all show trace SF in UV • average SFR/mass increases by 5 -10 x per type bin (S 0 - Sa - Sb, etc) – proportional changes in disk SF history with type - changes in frequency and characteristic mass of SF events • large residual variation in SFR within a given type – most variation in disk SFR vs B/D ratio – more strongly correlated with mean gas density – temporal SFR variations (bursts) • strong bimodality seen in SFR/mass vs galaxy mass – extension to dwarfs shows evidence for third mode • radial gradients in disk age and metallicity

Disk Star Formation Rates and Histories • evolutionary synthesis of integrated colors Tinsley 1968, Ap. J, 151, 547 Searle et al. 1973, Ap. J, 179, 427 Larson, Tinsley 1978, Ap. J, 219, 46 • results – disk colors consistent with sequence of constant age, IMF, Z, and variable SF history y(t) – best fit for ~Salpeter IMF – spectra fit with similar model sequence Kennicutt 1983, Ap. J, 272, 54

Bruzual, Charlot 1993, Ap. J, 405, 538

Kennicutt 1992, Ap. JS, 79, 255

Disk SF – Global Trends Kennicutt 1998, ARAA, 36, 189 Bendo et al. 2002, AJ, 124, 1380

Kennicutt, Tamblyn, Congdon 1994, Ap. J, 435, 22

Sandage 1986, A&A, 161, 89

Kennicutt 1998, ARAA, 36, 189

Bell, de Jong 2000, MNRAS, 312, 497

• Gas consumption – typical timescales for depletion ~few Gyr – stellar recycling of gas is significant factor!

SFR increase reflects an increase in frequency of SF events, and a shift in the mass spectrum of single events

Brinchmann et al. 2004, MNRAS, 351, 1151

blue sequence red sequence

Kauffmann et al. 2003, MNRAS, 341, 54

Lee & Kennicutt, in preparation

Janice Lee, Ph. D thesis
")
starburst duty cycle in dwarf galaxies (Lee 2006)

see poster by Lee et al.

Application to Starburst Duty Cycles • bursts produce 20 -40% of present-day SF in dwarfs • fraction of bursting dwarfs in same sample is 5 -10% • the galaxies are bursting 5 -10% of the time • average burst amplitude is ~4 -8 x the background SFR • typical burst durations are 10 -100 Myr (e. g. , Gallagher, Harris, Calzetti, Zaritsky, Hunter…) - a typical burst lasts for 0. 1 -1% of Hubble time • a typical galaxy bursts ~10 -20 times over a Hubble time, each time producing a few percent of its stars (every 500 -1000 Myr)

Disk SFRs: Main Results Kennicutt 1998, ARAA, 36, 189 Brinchmann et al. 2004, MNRAS, 351, 1151 • spectra best fitted with IMF ~ Salpeter for M* > 1 Mo • SF is ubiquitous when cold gas is present - <4% S-Irr non-detects in H , nearly all show trace SF in UV • average SFR/mass increases by 5 -10 x per type bin (S 0 - Sa - Sb, etc) – proportional changes in disk SF history with type - changes in frequency and characteristic mass of SF events • large residual variation in SFR within a given type – most variation in disk SFR vs B/D ratio – more strongly correlated with mean gas density – temporal SFR variations (bursts) • strong bimodality seen in SFR/mass vs galaxy mass – extension to dwarfs shows evidence for third mode • radial gradients in disk age and metallicity
")
NGC 1512 (HST)
")
NGC 1512 (GALEX FUV/NUV)

Kormendy & Kennicutt 2004, ARAA, 42, 603 Sakamoto et al. 1999, Ap. J, 525, 691

M 82 NGC 3034

Lo et al. 1987, Ap. J, 312, 574
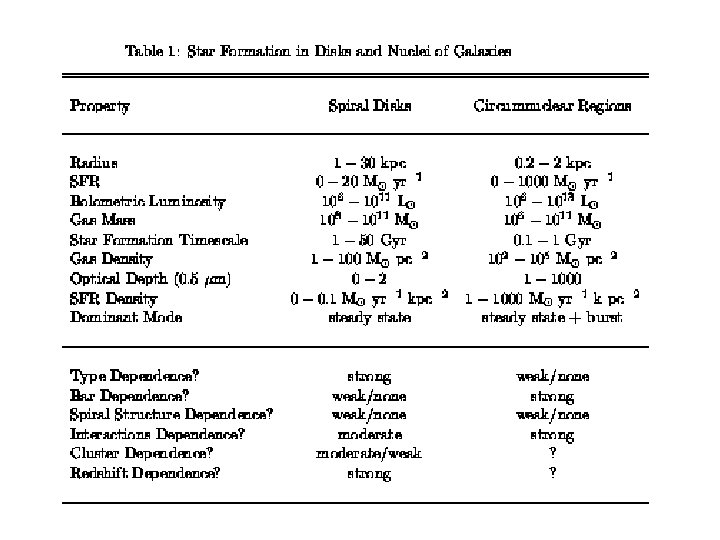

IR-luminous galaxies ELS limit normal galaxies Kennicutt 1998, ARAA, 36, 189

Circumnuclear Star Formation - Trends with Type ellipticals too? ! Yi et al. 2005, Ap. J, 619, L 111 Ho et al. 1997, Ap. J, 487, 595

Borne et al. 2000, Ap. J, 529, L 77

Contributions to the global star formation budget IR-luminous: ~5 -8% circumnuclear: ~3 -4% BCGs, ELGs: ~5 -8% Total fraction ~10 -20%

total IR-luminous starbursts L’Floch et al. 2005, Ap. J, 632, 169
- Slides: 101