Background Clinical collaboratives have important potential to improve

Background • Clinical collaboratives have important potential to improve outcomes and facilitate the quality improvement process (1, 2). A quality improvement (QI) collaborative involves five features: • 1) a specified topic with variations in care or gaps between current and best practice, 2) clinical and QI experts provide ideas and support, sharing knowledge and best practice, 3) a critical mass of interprofessional teams from multiple sites willing to improve and share, 4) setting clear and measurable targets, collecting data, and testing changes on a small scale to learn by doing 5) collaborative process involving structured activities to advance improvement and share ideas (1). Interprofessional collaboration is critical to optimize safety and quality (3, 4). • • •
 Clinical Collaborative among")
Background • 2009: Guided by this framework, an Infection Control (IC) Clinical Collaborative among UT Health Centers was formed • Goal: decreasing the emergence of multi-drug resistant organisms (MDROs) through sharing scientific knowledge and best practices. • Interprofessional team from each UT Health Center was identified and established communication and collaboration. • Team members included: – – a physician leader with expertise in healthcare epidemiology infection preventionist Pharmacist QI expert involved with the UT System Clinical Safety and Effectiveness Steering Committee

Background • Aims for the FY 09 -10 IC collaborative were achieved as follows: • Clinical experts in healthcare epidemiology, infection control, pharmacy and QI from UT Health Centers were identified and organized to share scientific knowledge and best practices for MDRO control. • Regular communication and collaboration in infection control practices took place between multiple UT Health Center sites. – Two face-to-face meetings (Texas ID Society Annual Meeting, June 2009; ID Society of America Annual Meeting, October 2009) – 2 webinars – Several teleconferences • Webinar topics • “Hand Hygiene Compliance” (Jan Patterson MD MS, Patti Grota Ph. D RN) • “Measuring Compliance with Isolation and Environmental Cleaning Policy” (Luis Ostrosky -Zeichner MD, Virgie Fisher CIC). • Experiences and best practices for MDRO control and, also for the unexpected epidemic of H 1 N 1 influenza, were shared. Measurable targets were set and data was collected

2011 -2012 Infection Control and Prevention Clinical Collaborative • 2011 -2012 Infection Control and Prevention Collaborative was assembled to build on the work started by the FY 09 -10 collaborative • 2011 -12 Collaborative focused on meeting mandatory reporting requirements of HAI’s implemented in 2011 -2012 by the Texas Department of State Health Services (DSHS). • Initial HAIs to be reported in Texas included: – Central line-associated blood stream infections (CLABSIs) in intensive care units (ICUs) – Selected surgical site infections (SSIs) (5). • For the SSIs, the 2011 -12 Collaborative targeted knee and hip arthroplasties since these were among the first procedures scheduled to be publically reported.

Scope of problem • CLABSIs are a major HAI problem in the United States. • Estimated that 80, 000 CLABSIs occur in ICUs each year (at an average cost of $45, 000 per patient), and are associated with 17, 000 deaths (6) • 2006 Pronovost et al reported a remarkable study in which rates of CLABSIs approached zero, using a checklist for evidence-based process measures and a teamwork culture (7). In this study, ICUs in the state of Michigan functioned as a collaborative, sharing data and best practices to facilitate improvement at each facility. • Implementation of process measures and teamwork to prevent CLABSI can vary between institutions, and Pronovost’s study documented that CLABSI rates can improve by sharing of best practices.

2011 – 2012 Infection Prevention Collaborative Methods and Achievements

Who was involved? • Enrolled 9 hospital sites associated with 5 UT System Health Center sites in the Infection Prevention collaborative: – – – – – Memorial Hermann Hospital Memorial Hermann Children’s Hospital University Health System South Texas Veterans Health Care System UT MD Anderson Cancer Center John Sealy Hospital Parkland Hospital Zale Lipshy Hospital University Hospital • Survey of the types of ICU’s located at each hospital was completed

Participants by UT System Site • • • • • Principal Investigator: Jason Bowling, MD - University of Texas Health Science Center at San Antonio (University Health System) Co-Principal Investigator: Jose Cadena, MD - University of Texas Health Science Center at San Antonio (South Texas Veterans Health Care System) Co-Investigators and Collaborators: UT Health Science Center at Houston (Memorial Hermann Hospital) Luis Ostrosky-Zeichner, MD, Natalie Blum, MPH Galit Holzman-Pazgal, MD, Charles Monney, MS (Children’s Hospital) UT Health Science Center at San Antonio (University Health System and South Texas Veterans Health Care System) Jan E. Patterson, MD, MS; Beth Ann Kavanagh, MT(ASCP)MS, MBA; James Lewis, Pharm. D; James Jorgensen, Ph. D UT Health Science Center at San Antonio (South Texas Veterans Health Care System) Carrie Tierney, RN, MSN, Kelly Echevarria, Pharm. D UT M. D. Anderson Cancer Center, Houston Roy Chemaly, MD, MPH; Cheryl Perego, MPH, MT (ASCP), Linda Graviss, MT (ASCP) UT Medical Branch at Galveston (John Sealy Hospital) Glenn Mayhall, MD, Shirley Shores, MA, Amy Schilling, Pharm. D UT Southwestern Medical Center, Dallas (Parkland Hospital) Pranavi Sreeramoju, MD, MPH; Janet Glowicz, MPH, MSN, RN, Sylvia Trevino, MT, Maria Fernandez-Rojas, MPH, Kavita Bhavan, Pharm. D, Natalie Boyd, Pharm. D UT Southwestern Medical Center, Dallas (Zale Lipshy Hospital, University Hospital) James Luby, MD; Francesca Lee, MD, Doramarie Arocha, MS, MT (ASCP), SM

Types of ICUs

Public Reporting • Shared enrollment and implementation experience regarding the National Healthcare Safety Network (NHSN) for Department of State Health Services (DSHS) public reporting of healthcare associated infections (HAIs). • Specifically, the collaborative assured that all sites were enrolled in NHSN and conferred rights to DSHS prior to January 1, 2012. • A log of noteworthy experiences maintained throughout the project timeframe indicates that, while the website provides User Guides for navigating and utilizing the website, a couple hospitals required additional assistance to meet the deadline.

Demographic survey • Completed a survey on the staffing patterns of the Infection Control and Prevention departments and a demographic dashboard was compiled to provide a perspective of the collaborative membership and encourage benchmarking amongst the members

Demographics
 to bed")
Demographics • ICP departments – variable staffing • Infection Control Preventionist (ICP) to bed ratio range: • 1: 73 up to 1: 155 • Median 1: 126

Regular communication • Primary goal of the Collaborative leadership - assure regular communication on infection control and prevention practices to sustain collaboration amongst the multiple UT Health Center sites. • This served as the means of building on the collective knowledge base with the goal of improving patient safety. • Specifically, on a monthly basis, the collaborative either conducted a teleconference or scheduled a face-to-face meeting at professional conferences • Face-to-face meetings: – Society for Healthcare Epidemiology of America, April, 2012 – Texas ID Society Annual Meeting, June, 2012 • Invaluable in strengthening the collaborative as the individuals were able to put faces to names, continue individual discussions, further establish connections • Several of the monthly teleconferences included educational webinars.

Timeline of meetings • • November-December 2011 Multiple introductory and organizational activities occurred during the initial monthly teleconferences and via e-mail and telephone communications to include: *Introductions of collaborative participants with descriptions of their backgrounds and health care facilities *Introduction and detailed discussions of project objectives and timeline *Creation of a directory to facilitate rapid communication and serve as a distribution for e-mail communication between members *Discussion of NHSN enrollment, conferral of rights to DSHS, experiences and challenges in the evolving arena of public reporting *Development of budget and internal accounting system for appropriate usage of grant funds *Identification of contacts in participating health care facilities who could provide SCIP process measure data as this was generally outside the purview of the respective Infection Prevention departments

Timeline • • January, 2012 Central Line Associated Blood Stream Infection Prevention Program at the South Texas Veterans Administration Hospital presented by Jose Cadena, MD, Medical Director, IC, Assistant Professor of Medicine, Infectious Diseases, UTHSCSA. February, 2012 Decreasing CLABSI’s in the NICU: The Line Maintenance Team presented by Galit Holzman-Pazgat, MD, Medical Director for IC, Memorial Hermann-Children’s, Division of Pediatric Infectious Diseases, UT Health Science Center, Houston, Texas. March, 2012 Cost Effectiveness of Pre-operative Nasal Mupirocin Treatment in Patients Undergoing Total Hip and Knee Arthroplasty: A Cost Effectiveness Analysis, a journal article review presented by Jason Bowling MD, Medical Director, IC, Assistant Professor of Medicine, Infectious Diseases, UTHSCSA Authors: Xan F. Courville, MD, MS, Ivan M. Tomek, MD, FRCS(C), Kathryn B. Kirkland, MD, Marian Birhle, MPH, Stephen R. Kantor, MD, Samuel R. G. Finlayson, MD, MPH. Infection Control and Hospital Epidemiology, Feb, 2012, Vol. 33, No. 2.

Central Line Associated Blood Stream Infection Prevention STVHCS Jose Cadena, MD Medical Director Infection Control Assistant Professor of Medicine, Infectious Diseases, UTHSCSA

1. CHG dressing for all central lines. 2. Bedside observations 3. CL and bundle insertion compliance rates reported 1. New blood culture process 2. Policy updates based on CDC guidelines. 3. Unit-based modular education initiated 1. Units with elevated risks and rates identified. 2. Bedside observations 3. CL insertion observations in CC, OR, PICC nurses. 1. Unit based modular education continued 2. Bedside In-time coaching of CL Care 3. Monthly CL rates, BC rates, and process change feedback to committees 1. Monthly Intern/Resident Education 2. Changed to clear Micro-clave end cap with improved infection control properties. 1 0. 8 2010 0. 6 2011 0. 4 0. 2 0 QTR 1 CL Days 11, 078 20% Reduction QTR 2 QTR 3 QTR 4 50% Reduction in overall Infections 2010 (n=40 2011 (n=20) QTR 1 Overall Rate Reduction by 38% in 2011 QTR 2 QTR 3 QTR 4 Represents $500, 000. 00 attributable cost reduction.

More recently… Enrolled in the Target Solutions Tool from the Joint Commission ØGet baseline data based with unannounced reviews. ØFind out why people are noncompliant and provide in-time coaching on required central line practice. ØMonitor and instruct on hand hygiene. ØCorrect misperceptions and problems. ØSustain change.

Nurses initiate central insertion bundle compliance checks in the critical care units. Forms sent to Infection Control

Surveillance Monthly feedback to the units ØReview by Vascular Access Committee ØReview by Infection Control Committee ØReported to all Critical Care Committees ØReport to Chief Executive Board

Monthly flyer s distributed to units and provides: 1. CL Rates 2. New practice requirements 3. New equipment Nurse Managers: 1. Present in staff meetings 2. Encourage staff to read. 3. Involved with development through Vascular Access Committee

Education Created cards that summarize proper insertion and care of central lines Feedback on best practices Process improvement

Additional interventions CHG bath in intensive care units CHG bath in spinal cord injury Vernon MO et al. Arch Intern Med 2006; 166: 302 -12 Popovich K et al. Infect Control Hosp Epidemiol 2009; 30: 959 -963

Blood Culture Contamination Rates • Blood culture contamination rates are tracked. • Goal < 3.

Future Directions • All central line kits are continuously reassessed and upgrades are in progress. • Indwelling catheter insertion kits have been developed inclusive of all needed supplies. • System-wide nursing education on insertion, management, and assessment of indwelling ports.

Decreasing CLABSI in the NICU: The Line Maintenance Team Galit Holzmann-Pazgal, MD Medical Director for Infection Control, CMHH Division of Pediatric Infectious Diseases, UTHealth, Houston G a l i t H o

NICU at CMHH decides to initiate a line team-Mar 2008 • Headed by Ann Kubanda, RN • 14 -16 members initially • Line team nurses perform all aspects of central line care – Dressing changes – Tubing changes – Blood draws from central lines

Mar 08 – Line Team Initiated Before Line Team: Avg 11. 6 Upper Control 18. 8 Lower Control 4. 4 After Line Team: Avg 3. 5 Upper Control 9. 8 Lower Control -2. 8

Modifications over time • Increased effort to “protect” line team members and avoid pulling them into bedside staffing. • October 2009, line team takes over medication administration through central lines.

Mar 08 – Line Team Initiated

Results • CLABSI rates significantly decreased after implementation of the line team. • Overall CLABSI decreased from 11. 6/1000 pre line team to 3. 5/1000 (P<. 001). • Birth weight specific rates also decreased significantly • Device utilization (catheter days/patient days) actually increased between the two time periods: not significant difference: 0. 29 to 0. 31

Infections avoided • Between 3/08 -12/11, 475 CLABSI would have been expected at a CLABSI rate comparable to the pre line team time period. • 144 Actually occurred • 331 CLABSI avoided!

Why is the line team successful? • Maximize adherence with known interventions/maintenance bundles to insure sterility of the central catheter post insertion. • Line team members perform that same tasks repeatedly and often = become more proficient, less error • Line maintenance processes occur consistently even in times of increased census, increased nurse: patient ratios • End result: Minimize variation in practice, leading to more consistent desired outcome.
 Conference -")
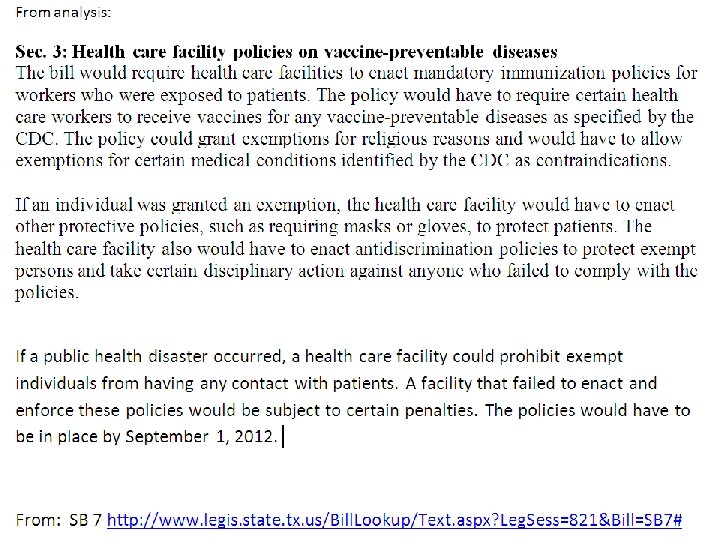
Timeline • • April, 2012 Society for Hospital Epidemiologists of America (SHEA) Conference - Jacksonville, Florida. First opportunity for members to meet face-to-face. Various topics were discussed such as experiences with the NHSN website and the increased burden on hospitals related to manual data entry on SSI’s and subsequent efforts to purchase software that will auto-populate SSI data in the NHSN system. The aggregate CLABSI cause and effect diagram worksheet was presented to the group and the remainder of the meeting was spent on this activity. May, 2012 Senate Bill 7 Sec. 3: Health care facility policies on vaccine-preventable diseases. A summary and implications for hospitals was presented by Jason Bowling, MD, Collaborative PI. The bill requires health care facilities to enact mandatory immunization policies for workers who were exposed to patients. . The health care facility also would have to enact antidiscrimination policies to protect exempt persons and take certain disciplinary action against anyone who failed to comply with the policy. The policies have to be in place by September 1, 2012.
 Conference – San Antonio")
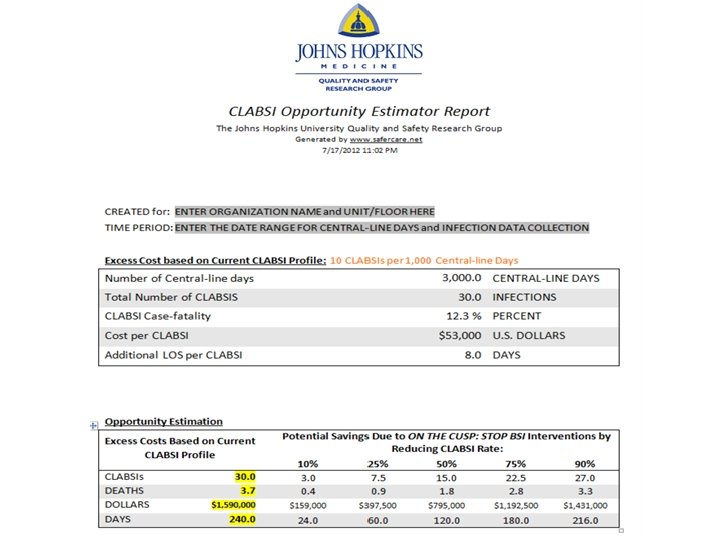
Timeline • June, 2012 • Texas Infectious Diseases Society (TIDS) Conference – San Antonio • Dr. Bowling met with the members who attended TIDS as well as many participants of the conference who walked into the meeting. • Presented the opportunity to describe the work of the collaborative to hospitals outside the UT system. Also, Dr. Ed Septimus discussed the new surveillance definition for ventilator-associated pneumonia and the potential impact it will have on data collection and reporting. • July, 2012 • Wrap-Up The final webinar centered on a discussion of areas targeted in the renewal proposal since an expansion of the type/amount of data shared on the NHSN Group would be necessary. • Hope Nora, Ph. D, Data Coordinator, presented information on the CLABSI Opportunity Estimator developed by Johns Hopkins Hospital - utilized to calculate the Collaborative prevention results at the end of the grant period.

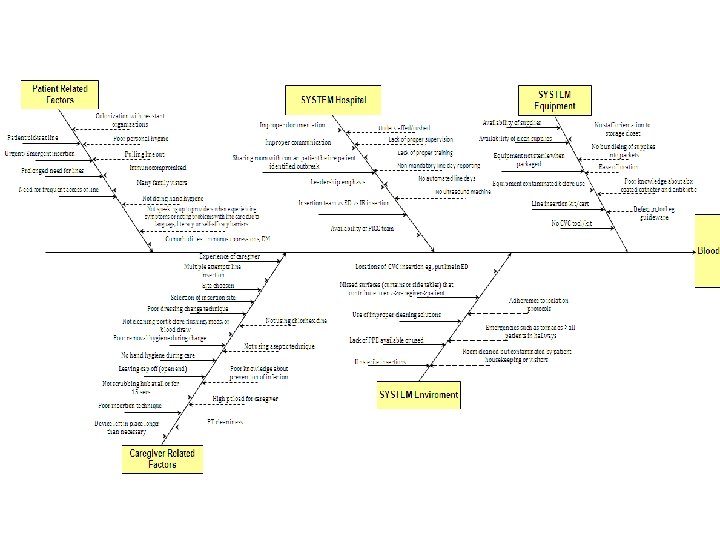
Cause and Effect diagram • At the face-to-face meeting held at the SHEA conference, the group completed an aggregate Cause and Effect Diagram reflecting the causes of CLABSI. This diagram will provide guidance for future, targeted improvement initiatives.

NHSN working group • First quarter of 2012: created a NHSN working group managed by the principal investigator consisting of all 8 eligible hospital sites (note: South Texas Veterans Health Care System does not participate in NHSN). • Group membership increased transparency among the collaborative hospitals, provided for more timely collection of the data, and increased familiarity with the NHSN website. • Close communication and follow-up was used to make sure that all 8 facilities successfully enrolled. • Demonstrated the utility of the NHSN website as a means to access data for ongoing trending and benchmarking purposes as well as summative evaluation of performance improvement initiatives.

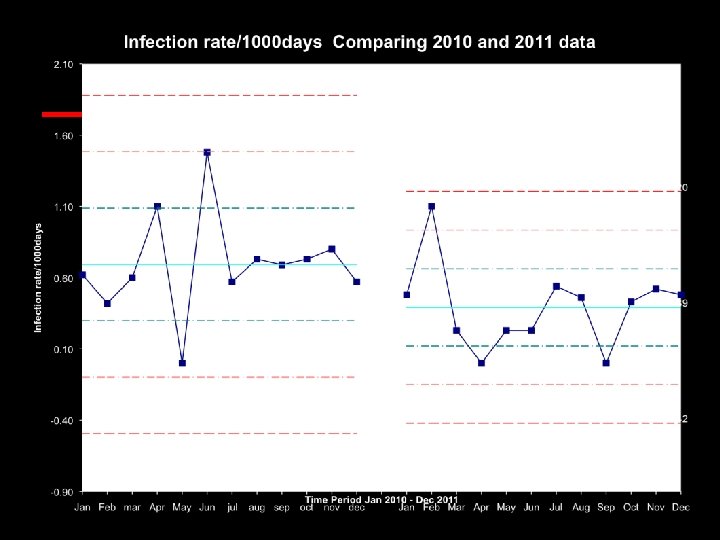
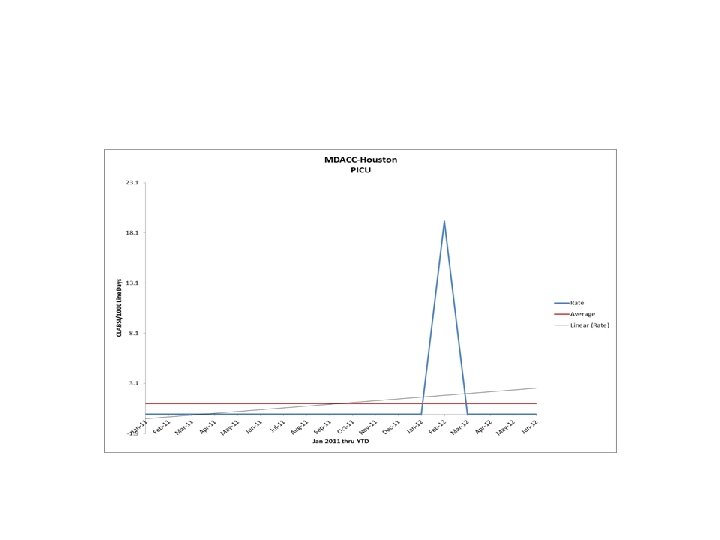
Data Review • CLABSI rates per month were collected on each eligible hospital/unit. • CY 2011 was used as a baseline reference since the Collaborative was activated late CY 2011. • Monthly reports consisting of rate tables as well as run charts for each hospital/unit were distributed to the participating hospitals. • *Since the South Texas VA was not eligible to participate on the NHSN system, data was submitted on Excel tables and included in the monthly feedback reports.
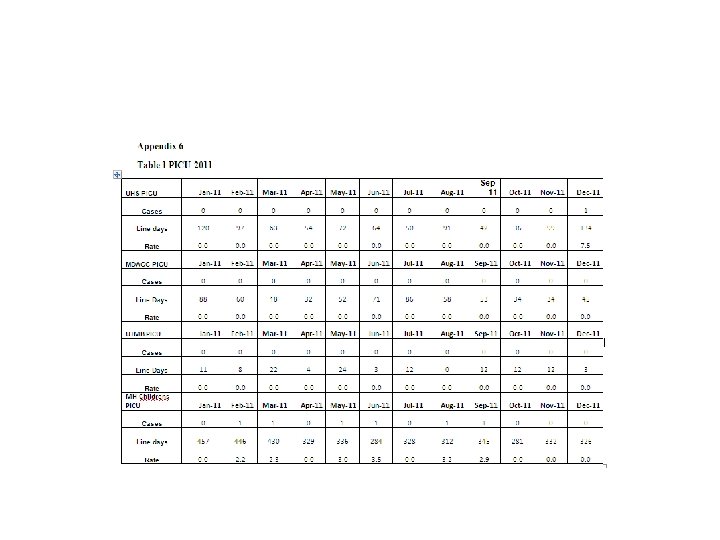
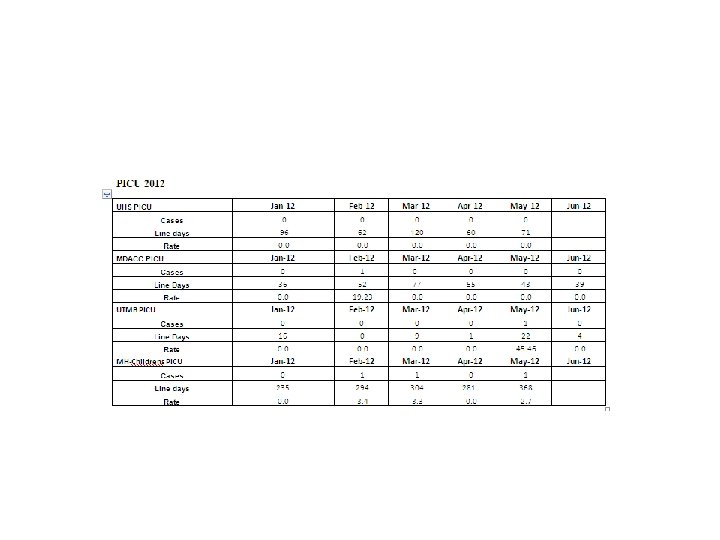
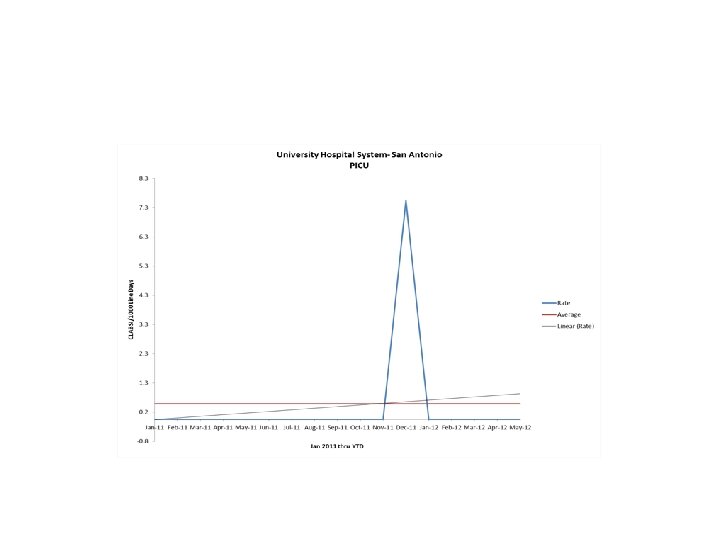

Data Highlights • • • • The following are Hospitals that achieved an infection rate of zero for the six months following the baseline period of CY 2011 by unit type. PICU-University Hospital System-San Antonio NICU (<750 g) -University Hospital System-San Antonio, UTMB- Galveston NICU (751 -1000 g) - University Hospital System-San Antonio, Parkland Hospital-Dallas, UTSWUniversity Hospital-Dallas NICU (1001 -1500 g)-Memorial Hermann Children’s-Houston, UTMB-Galveston NICU (1501 -2500 g) - University Hospital System-San Antonio, Parkland Hospital-Dallas NICU (>2500 g) - University Hospital System-San Antonio, Memorial Hermann Children’s-Houston, UTMB-Galveston SICU- University Hospital System-San Antonio, MD Anderson Cancer Center-Houston Neuro- University Hospital System-San Antonio, Memorial Hermann-Houston, UTSW Zale Lipshy. Dallas MICU- Memorial Hermann-Houston Trauma- University Hospital System-San Antonio, Memorial Hermann-Houston Burn- Memorial Hermann-Houston, UTMB-Galveston Transplant- - Memorial Hermann-Houston

Data Analysis • To measure prevention gains made by the end of the Collaborative period, the NHSN site was utilized to generate aggregate reports across all participating hospitals on total infections and central line days for both the baseline and Collaborative timeframes. • Separate aggregate scores were generated for NICU’s and Other Units (including PICU) for the period of January through June, 2012. The South VA data was added to these scores. • The CLABSI Opportunity Estimator developed by the Johns Hopkins University Quality and Safety Research Group was used to calculate prevention gains achieved by the end of the collaborative period. • Overall, the Adult and PICU units achieved a 28. 2% improvement over the baseline period and the NICU’s achieved a 25. 4% improvement.

Data Analysis

CLABSI Opportunity Calculator July 18, 2012

CLABSI Calculator Assumptions • To use the opportunity estimator you need to provide the total number of line days and the CLABSI rate for the unit of analysis you are looking at (unit, hospital or system) • The estimator requires estimates of the mortality rate, costs associated with treating a CLABSI and number of additional hospital days due to the CLABSI • The calculator provides estimates of these parameters based on a review of the literature • But if you know estimates specific to your unit, hospital or system, you can change the default values by sliding the vertical bars on the tool.

Collaborative results

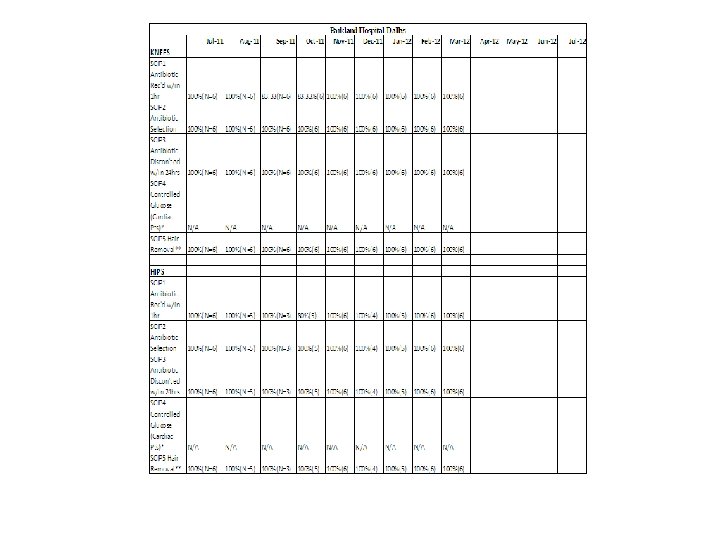
Knee and Hip SSI data • Collected and shared knee and hip surgical site infection (SSI) rate data. • Tables reflecting these rates by hospital were distributed to the hospitals on a monthly basis for comparison and discussion. • Currently, there is not enough data for any valid analyses though the tables do indicate that the hospitals are doing as well in preventing SSI’s as they have done with CLABSI’s.

Knee SSI data table

Hip SSI rate data table

SCIP measures • Provided feedback on membership compliance with implementation of relevant Surgical Care Improvement Project (SCIP) measures. • Because of the very disparate timeframes for reporting SCIP measure compliance to CMS and SSI’s to NHSN, further comparative analyses between the process and the outcome measures is not possible. • However, it was clearly evident that all of the participating sites had implemented at least five SCIP process measures. • Timeframe for data reporting differs by hospital depending on individual data abstraction process, resources and internal data management policies.

Compendium of additional resources • A compendium of additional available pertinent resources was reviewed and compiled to provide supplementary information.

Conclusions • Extremely valuable to have a local group of Infection Prevention experts available as a resource. • All of the facilities were doing well overall in reducing CLABSIs and SSIs – allowed discussions to move beyond the standard accepted strategies to additional measures. • Other issues in the infection control and prevention domain were also discussed. • May teleconference focused on Senate Bill 7 and creating a policy for mandating vaccines for health care workers. Some of the participating sites had already initiated a policy and they shared their experiences - great benefit for other sites drafting their policies.

SHEA position paper Program should be: Comprehensive Ready access to vaccine Free vaccine to HCP Targeted education that emphasizes rationale for mandate • Leadership commitment • • • Essential elements: • Visible & emphatic leadership endorsement • Accountability (performance evals, MD credentialing) • Compliance data Talbot T, et al. Infect Control Hosp Epidemiol 2010; 31(10): 987 -995

Interactive discussion • How is your facility approaching this policy? • Which employees are targeted: only people with direct patient care? All employees? • What exemptions are being allowed? • How are people with exemptions addressed? • Which vaccines? • Resources available to track data? • Disciplinary measures for non-compliant?

Excerpt from May teleconference minutes • • Senate Bill 7 – Pranavi Sreeramoju stated that Children’s, Parkland & UTSW collaborated on policies – consequences at Parkland were termination, modified the performance evaluation process for employees so that those who were not vaccinated could only receive an evaluation no higher than “meets expectations. ” Compliance increased from 60% - 96% with employee staff and 94% with medical staff. Children’s increased flu vaccine compliance from 88% to 99. 5%. UTSW did not mandate - if not vaccinated, must wear mask. Compliance increased from 47 -51% to 85%. Tdap (pertussis vaccination) is not mandated Luis Ostrosky stated that series of vaccines have always been mandatory. This year, CEO announced flu vaccine as mandatory. Compliance increased from 60% - 95%. There is an allowance for those who decline - must sign form and must wear mask. Biggest challenge was dealing with medical students/nursing students & medical staffs are not employed by hospital. (difficult to track) Next year will be mandatory. Cheryl Perego stated that task force which grew out of ICC was convened. Influenza vaccination has been mandatory for two years. Can be declined if waiver is signed. Compliance rates went from 72% to 82 -83%. Are now focusing on MMR. Policy has gone through preliminary review. SB 7 will be followed – have clause which states that you will not be fired if decline but must wear mask, gloves if within six feet of patient. Have a process to track vaccinations. Contingency plan would state that there will be repercussions if non-compliant. Note of non-compliance would be in evaluation. Jason Bowling raised questions about UT System health policy related to health vaccines and that vaccination rates are tied to pay for performance beginning in 2013. Pranavi Sreeramoju said that capturing names is difficult. Letters are sent out to those who showed no vaccinations. Data collection template with two identifiers has been developed as a new strategy. Luis Ostrosky said one difficulty is people getting vaccinated elsewhere. For those who have no proof, affidavit must be signed. Time limit on Flu vaccination : – – • • • UTSW – 1 -15 -12 for 2012, 12 -1 -12 for 2013 UTH – Employees given until the end of month, if not have to wear mask, sticker put on badge, go through disciplinary process UHS, MDACC – one month time limit. UTMB – one month, masking not required until flu season starts. Institutions who have implemented mandatory vaccine policies- All agreed that Chiefs of Service, Directors played big role in tracking people who did not get vaccine. Student Affairs tracked vaccination rates for students. Pranavi Sreeramoju said educational communications were sent stating importance of vaccines which were then followed up by policy communications. Screensavers and fliers were used. Luis Ostrosky communicated that in their institution a GI virus was going around and that it had nothing to do with the flu vaccine given. Communication was promptly done through mass email to inform staff that GI symptoms were due to virus and not due to vaccine to assuage concerns. Committee was formed to handle campaign.

Conclusions • Sharing the experiences of data collection, NHSN enrollment, and public reporting was key to understanding that the importance and benefit of these practices comes at a significant cost of resources and time investment. • Balancing the increasing demands on time for data reporting in the context of stable resources and a contracting economic environment was recognized as a concern.

Conclusions • Most importantly, communication cannot be overemphasized as the most important component of this collaborative project. • Progression of interaction and discussions was notable during the course of the project. • We hope to maintain the positive momentum achieved by this experience by continuing regular communication among the participating sites. • Continued collaboration will be a powerful tool for successfully meeting the ongoing challenge of preventing health care-associated infections.

References – Schouten L, Hulscher M, van Everdingen J, Huijsman R, Grol R. Evidence for the impact of quality improvement collaboratives: systematic review. British Med J 2008; 28; 336(7659): 1491– 1494. – Newton PJ, Davidson PM, Halcomb EJ, Denniss AR, Westgarth F. An introduction to the collaborative methodology and its potential use for the management of heart failure. J Cardiovasc Nurs 2006; 21: 161 -8. – Institute of Medicine, Committee on Quality of Health Care in America. Crossing the quality chasm: a new health system for the 21 st century. Washington DC: National Academy Press; 2001. – Shine KI. Health care quality and how to achieve it. Acad Med 2002; 77(1): 91 -9. – Chapter 98. Texas Health and Safety Code. Reporting of Healthcare Associated Infections. Senate Bill 288 of the 89 th Texas Legislature, 2007. www. capitol. state. tx. us/tlodocs/80 R/billtext/doc/SB 00288 F. doc – Wenzel RP, Edmond MB. Team-based prevention of catheter related bloodstream infections. New Engl J Med 2006; 355(26): 2781 -3. – Pronovost P, Needham D, Berenholtz S, Sinolopi D, Chu H, Cosgrove S, et al. An intervention to decrease catheter-related bloodstream infections in the ICU. New Engl J Med 2006; 355(26): 25 -32.

Special Thanks • • Jan Patterson Hope Nora Leticia Bresnahan Wes Hodgson

Questions? Comments? Thank you
- Slides: 69