Avoiding Budget Catastrophe Len Burman Syracuse University and

Avoiding Budget Catastrophe Len Burman Syracuse University and NBER Central New York Council for the Social Studies October 4, 2011

Deficit Projections for Obama Budget, in $billions 2

3

Major Foreign Holders of US Debt, in $billions, December 2010

Distribution of Debt Crises by Debt Level, Middle-Income Countries, 1970 -2008 Maximum external debt/GNP at time of crisis 40 60 80 100 > 100 Cumulative % of total debt crises 19 52 68 84 100 Source: Reinhart and Rogoff (2009), p. 24. 5

The Longer we Delay, the More Painful the Adjustment: Required Tax Increase or Spending Cut to Stabilize the Debt Year Action is Taken Raise Tax Rates Cut Benefits % of GDP % of Revenues % of GDP % of Spending 2015 2 11 2½ 12 ½ 2025 5½ 26 ½ 6 26 Effect on GDP (2050) -7 -2½ Source: CBO, “Economic Impacts of Waiting to Resolve the Long-term Budget Imbalance, ” Economic and Budget Issue Brief, December 2010. 6

10

Major Foreign Holders of US Debt, in $billions, December 2010

Distribution of Debt Crises by Debt Level, Middle-Income Countries, 1970 -2008 Maximum external debt/GNP at time of crisis 40 60 80 100 > 100 Cumulative % of total debt crises 19 52 68 84 100 Source: Reinhart and Rogoff (2009), p. 24. 12

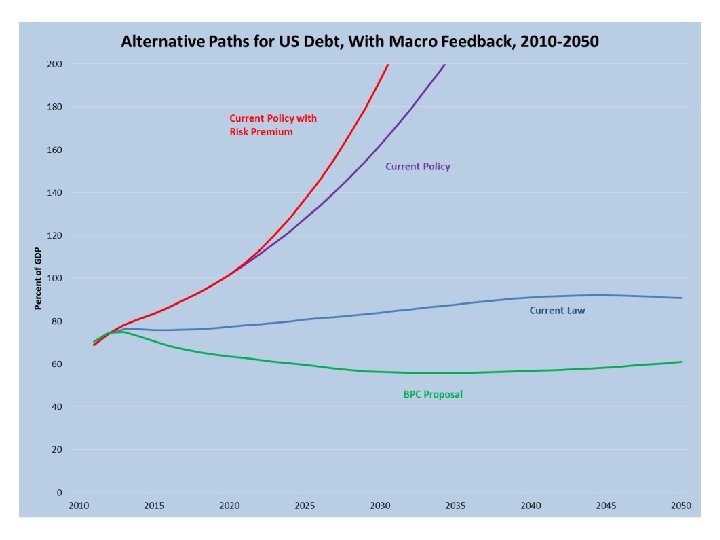
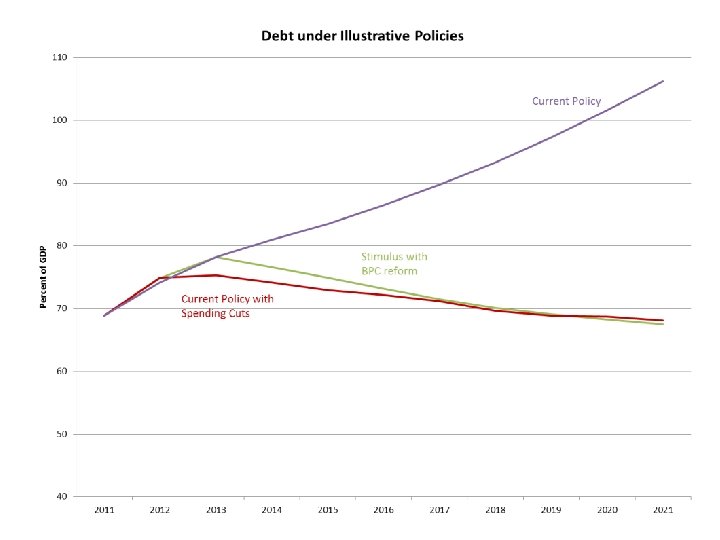
Current Policy with Risk Premium Current Policy BPC Plan

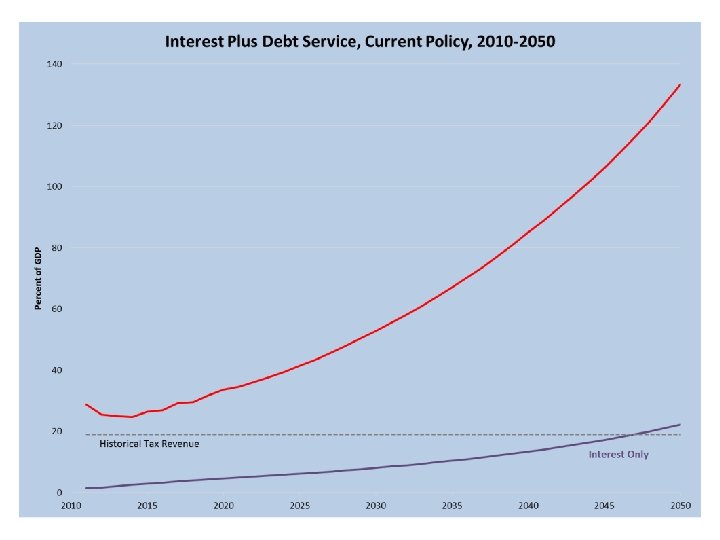
Interest Plus Debt Service

The Longer we Delay, the More Painful the Adjustment: Required Tax Increase or Spending Cut to Stabilize the Debt Year Action is Taken Raise Tax Rates Cut Benefits % of GDP % of Revenues % of GDP % of Spending 2015 2 11 2½ 12 ½ 2025 5½ 26 ½ 6 26 Effect on GDP (2050) -7 -2½ Source: CBO, “Economic Impacts of Waiting to Resolve the Long-term Budget Imbalance, ” Economic and Budget Issue Brief, December 2010. 15

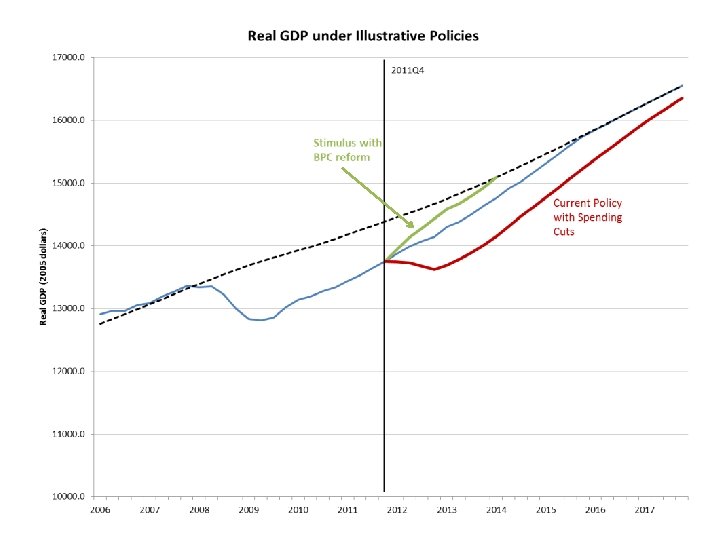
But Can we Act too Soon? Source: CBO 16

How would you deal with the debt? • • • Cut foreign aid? Tax corporate jets? Eliminate waste fraud and abuse? Eliminate earmarks? Raise tax rates on rich people?

The Solution!!! • Talk about how urgent the problem is, threaten to default on our obligations, almost shut down the government, and then promise painful cuts to discretionary spending and leave the hard decisions to a bipartisan super committee where half the members have vowed to never raise taxes while the other half has promised to never touch mandatory spending? ? ?

But seriously… • We must cut spending and raise taxes • Fiscal tightening too soon could throw the economy into a depression • Waiting too long could also produce a crisis • Fortunately, we are governed by wise and

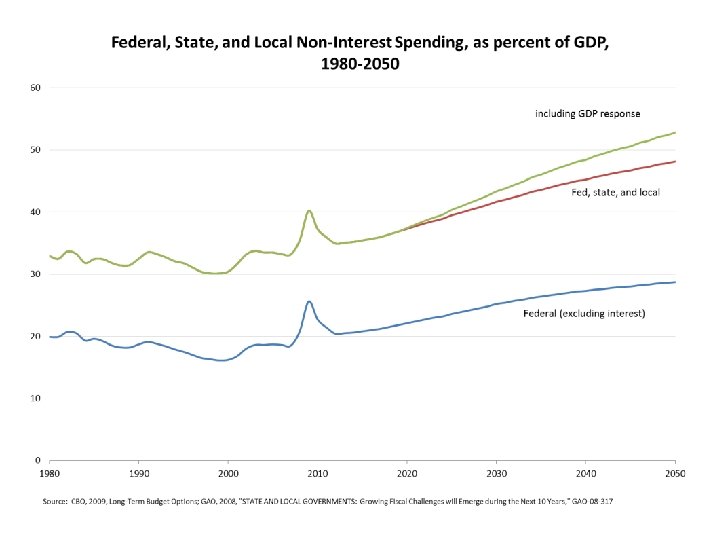
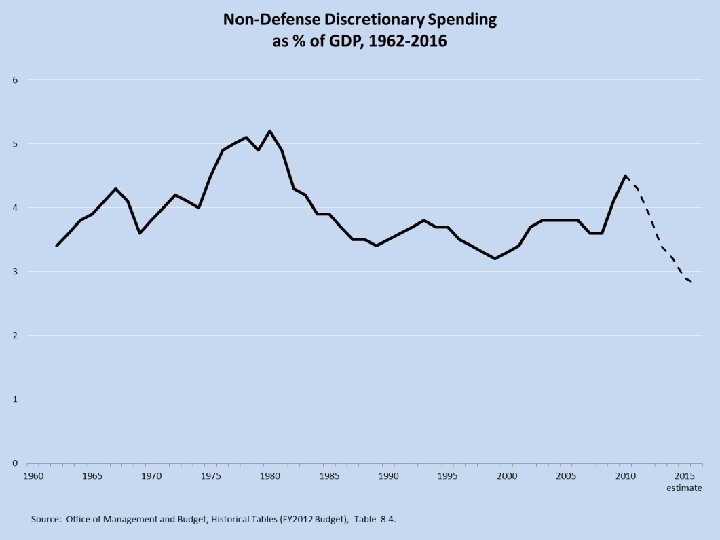
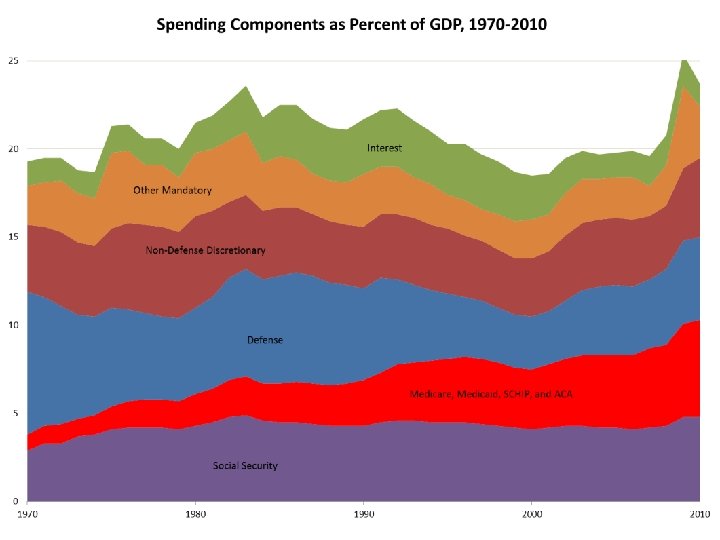
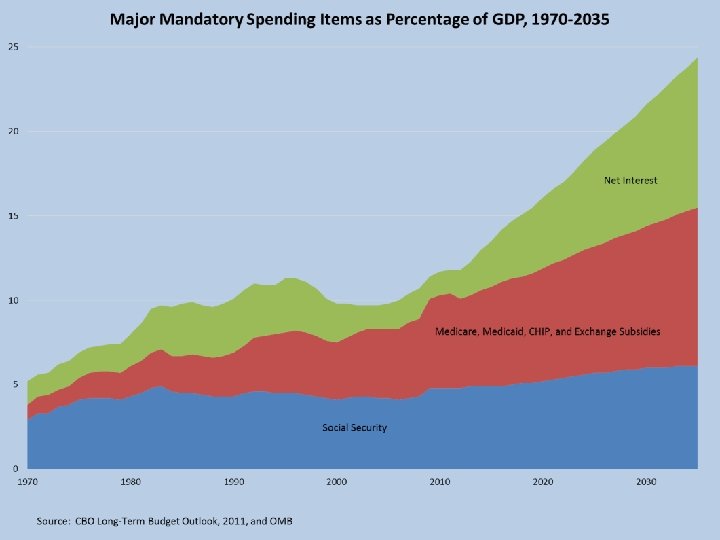
Spending • Barring enormous cuts, spending will increase because of demographics and health care • Discretionary spending increased as part of economic stimulus, but is expected to return to modest levels • Spending pressures exist at all levels of government—it’s not just a federal problem

Non-Defense Primary Spending as % of GDP, 1962 -2016 20 18 16 14 12 10 8 6 4 2 0 1965 1970 1975 1980 1985 1990 1995 2000 2005 2010 2015 estimate

Ratio of Workers to Retirees 26

Primary Spending as % of GDP, with and without Excess Health Costs, 2062 -2080 28

Federal+State+Local Federal

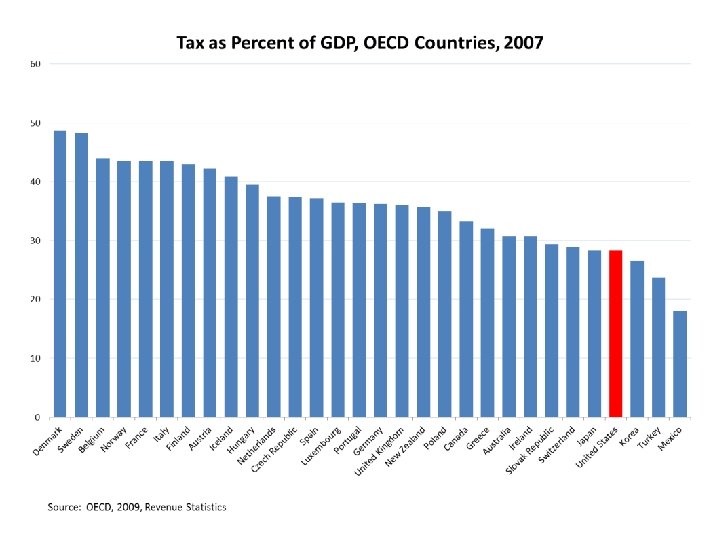
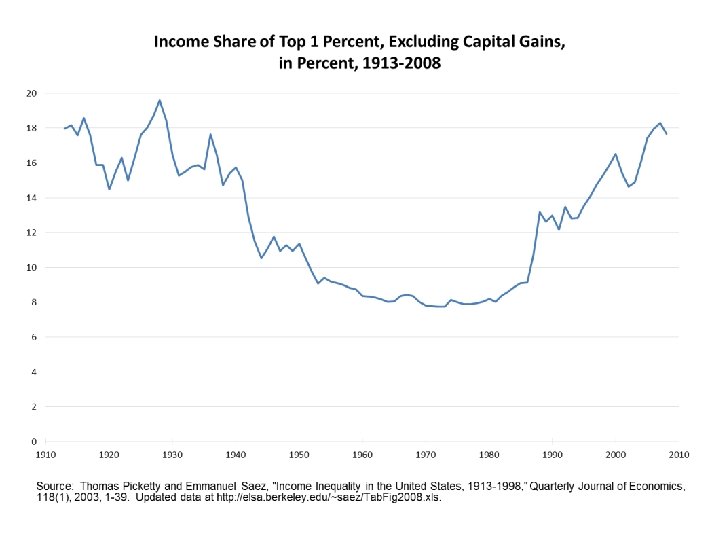
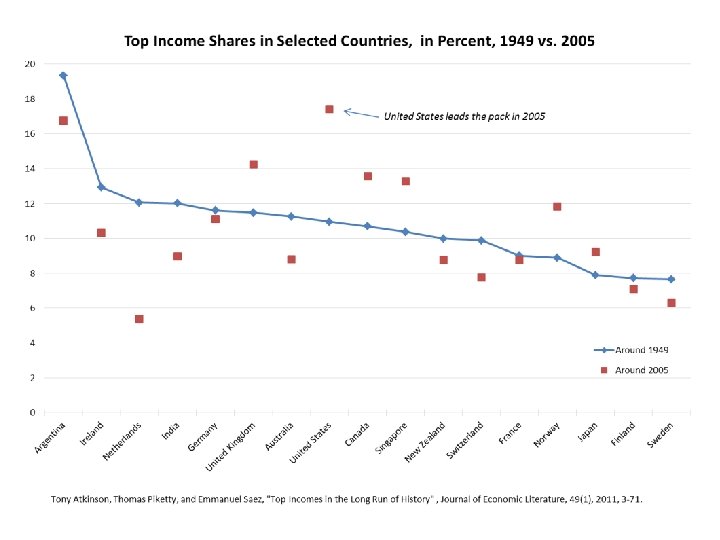
Taxes • Tax revenues in US are low by international standards • We don’t have a VAT • Our corporate tax rate is high • Our income tax is full of subsidies and loopholes (“tax expenditures”) • And it’s complicated, unfair, and doesn’t raise enough revenue to pay for government • Economic inequality is at the highest level since the Great Depression

Consumption Tax as Percent of GDP, OECD Countries, 2007

Combined Federal, State, and Local Corporate Tax Rate in OECD Countries, 2011 34

Value and Number of Tax Expenditures

Tax Expenditures Compared to Other Spending, FY 2011 Income Tax Expenditure Mandatory Discretionary $ Billions 1, 177 2, 165 1, 415 744 671 Percent 24. 7 45. 5 29. 7 15. 6 14. 1 % of GDP 7. 6 14. 0 9. 1 4. 8 4. 3 Tax expenditures are not chump change! Non. Defense defense

Tax Expenditures Compared to Other Taxes, FY 2011 Income Tax Expenditures Net Individual Income Tax Corporate Income Tax Payroll Tax Other $ Billions 1, 177 1, 121 297 935 214 Percent 31. 4 29. 9 7. 9 25. 0 5. 7 % of GDP 7. 6 7. 2 1. 9 6. 0 1. 4

Median Earnings for Full-Time, Full-Year Workers, in 2009$ 1974 -2009

Highest Individual Income Tax Bracket, in percent, 1913 -2011
- Slides: 40