
Average Rates of Change 1 3 OBJECTIVE Compute
Average Rates of Change 1. 3 OBJECTIVE • • Compute an average rate of change. Find a simplified difference quotient. Copyright © 2014 Pearson Education, Inc.

1. 3 Average Rates of Change DEFINITION: The average rate of change of y with respect to x, as x changes from x 1 to x 2, is the ratio of the change in output to the change in input: where x 2 ≠ x 1. Copyright © 2014 Pearson Education, Inc. Slide 1 - 2
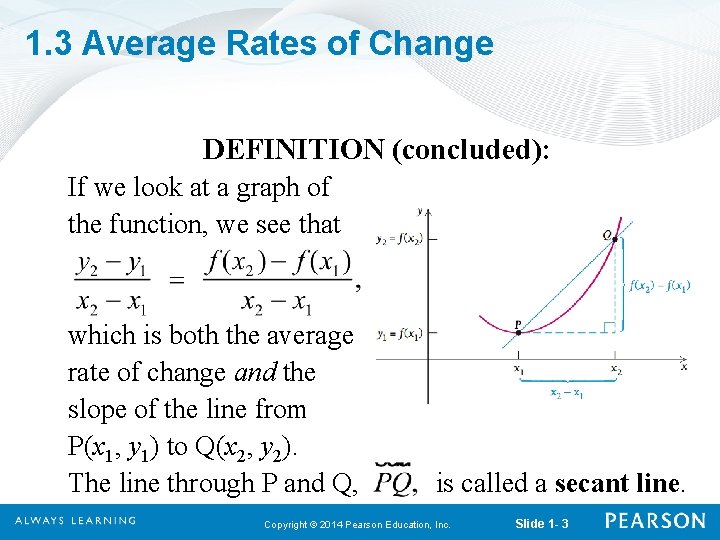
1. 3 Average Rates of Change DEFINITION (concluded): If we look at a graph of the function, we see that which is both the average rate of change and the slope of the line from P(x 1, y 1) to Q(x 2, y 2). The line through P and Q, is called a secant line. Copyright © 2014 Pearson Education, Inc. Slide 1 - 3
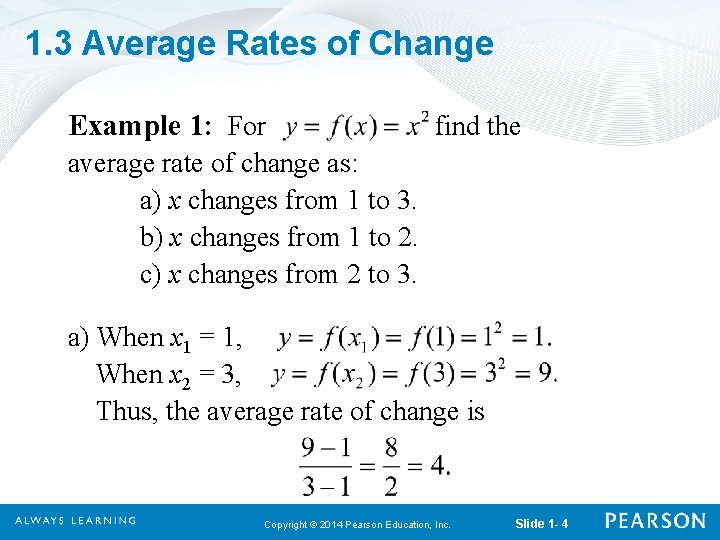
1. 3 Average Rates of Change Example 1: For find the average rate of change as: a) x changes from 1 to 3. b) x changes from 1 to 2. c) x changes from 2 to 3. a) When x 1 = 1, When x 2 = 3, Thus, the average rate of change is Copyright © 2014 Pearson Education, Inc. Slide 1 - 4
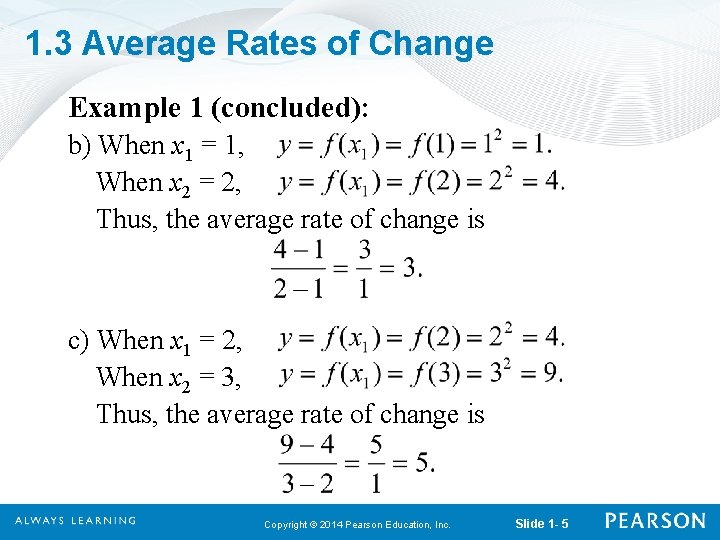
1. 3 Average Rates of Change Example 1 (concluded): b) When x 1 = 1, When x 2 = 2, Thus, the average rate of change is c) When x 1 = 2, When x 2 = 3, Thus, the average rate of change is Copyright © 2014 Pearson Education, Inc. Slide 1 - 5
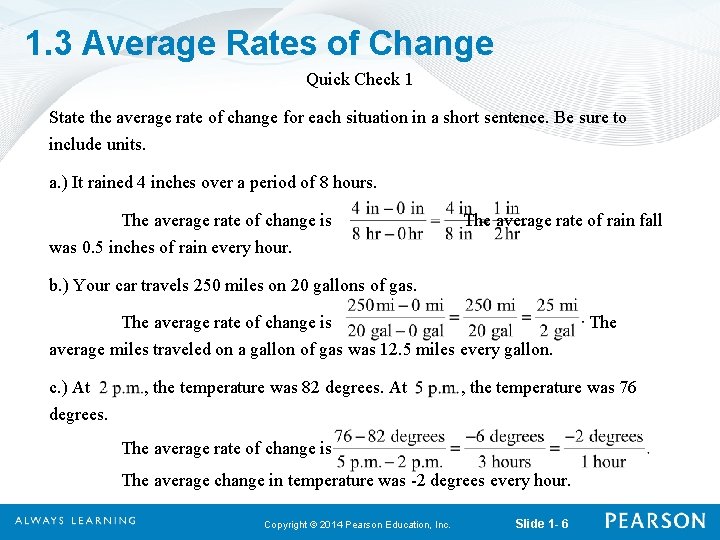
1. 3 Average Rates of Change Quick Check 1 State the average rate of change for each situation in a short sentence. Be sure to include units. a. ) It rained 4 inches over a period of 8 hours. The average rate of change is was 0. 5 inches of rain every hour. The average rate of rain fall b. ) Your car travels 250 miles on 20 gallons of gas. The average rate of change is average miles traveled on a gallon of gas was 12. 5 miles every gallon. c. ) At degrees. , the temperature was 82 degrees. At , the temperature was 76 The average rate of change is The average change in temperature was -2 degrees every hour. Copyright © 2014 Pearson Education, Inc. The Slide 1 - 6
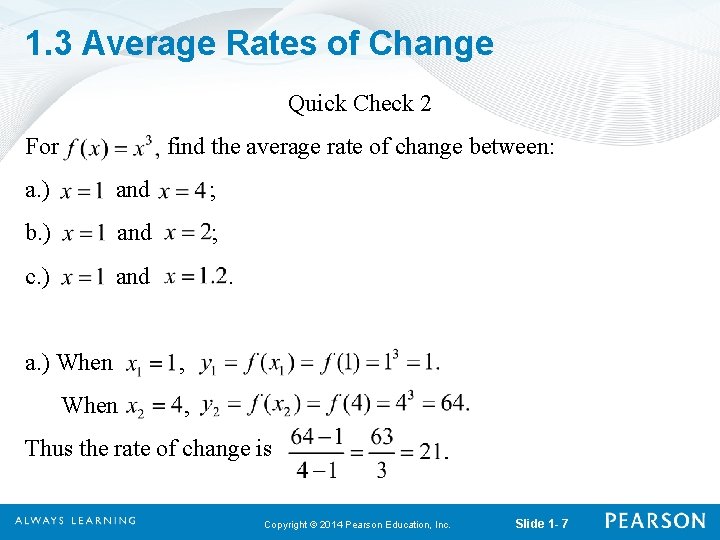
1. 3 Average Rates of Change Quick Check 2 For find the average rate of change between: a. ) and ; b. ) and ; c. ) and . a. ) When , Thus the rate of change is Copyright © 2014 Pearson Education, Inc. Slide 1 - 7
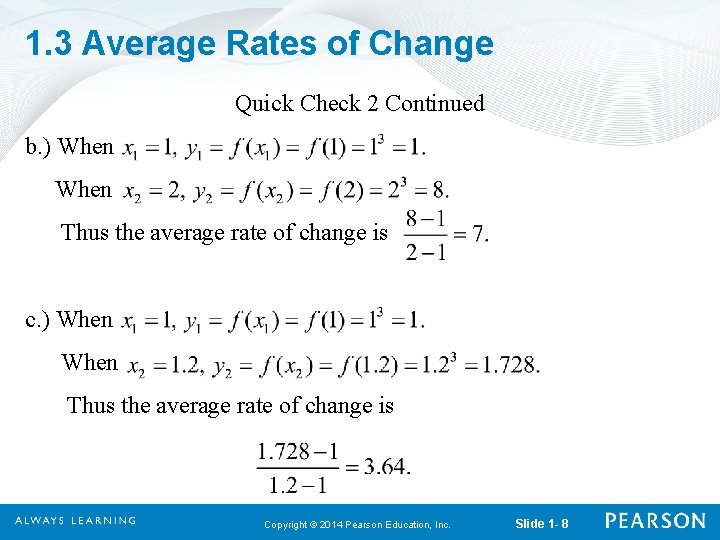
1. 3 Average Rates of Change Quick Check 2 Continued b. ) When Thus the average rate of change is c. ) When Thus the average rate of change is Copyright © 2014 Pearson Education, Inc. Slide 1 - 8
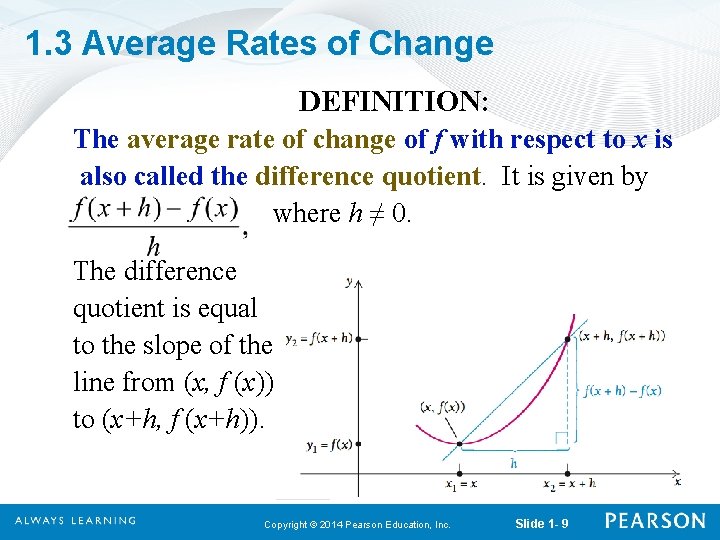
1. 3 Average Rates of Change DEFINITION: The average rate of change of f with respect to x is also called the difference quotient. It is given by where h ≠ 0. The difference quotient is equal to the slope of the line from (x, f (x)) to (x+h, f (x+h)). Copyright © 2014 Pearson Education, Inc. Slide 1 - 9
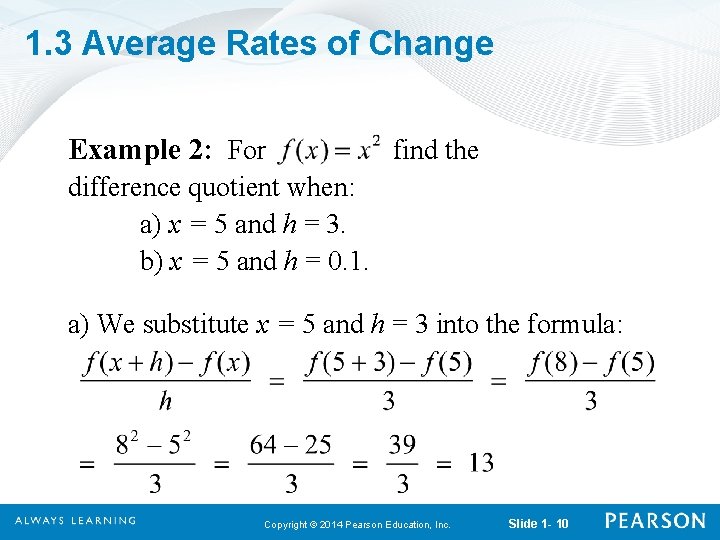
1. 3 Average Rates of Change Example 2: For find the difference quotient when: a) x = 5 and h = 3. b) x = 5 and h = 0. 1. a) We substitute x = 5 and h = 3 into the formula: Copyright © 2014 Pearson Education, Inc. Slide 1 - 10
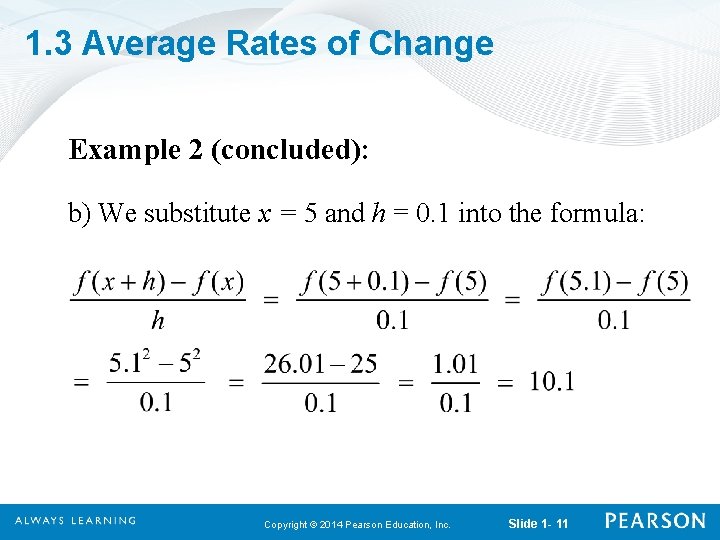
1. 3 Average Rates of Change Example 2 (concluded): b) We substitute x = 5 and h = 0. 1 into the formula: Copyright © 2014 Pearson Education, Inc. Slide 1 - 11
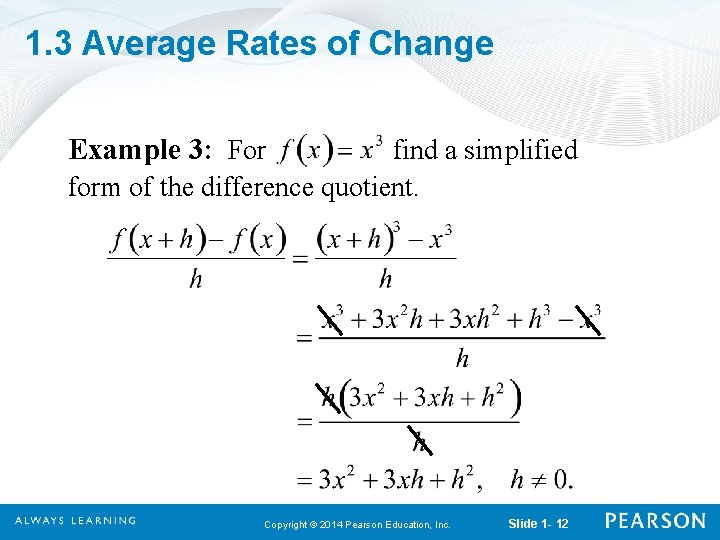
1. 3 Average Rates of Change Example 3: For find a simplified form of the difference quotient. Copyright © 2014 Pearson Education, Inc. Slide 1 - 12
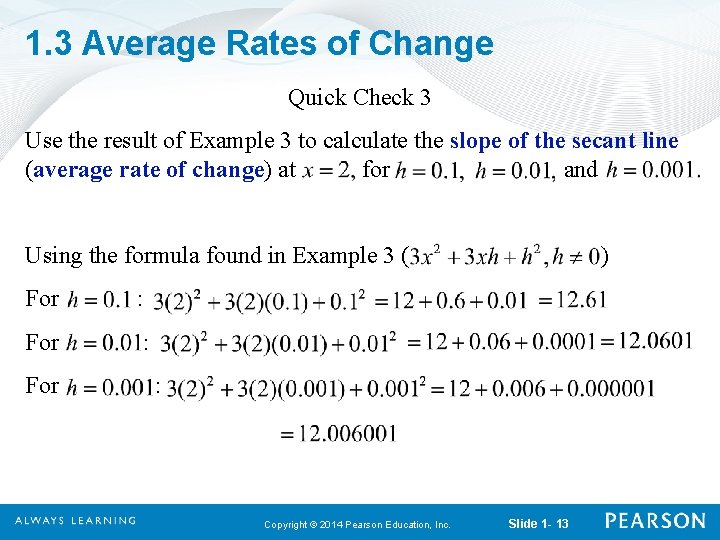
1. 3 Average Rates of Change Quick Check 3 Use the result of Example 3 to calculate the slope of the secant line (average rate of change) at for and Using the formula found in Example 3 ( For : For ) : Copyright © 2014 Pearson Education, Inc. Slide 1 - 13
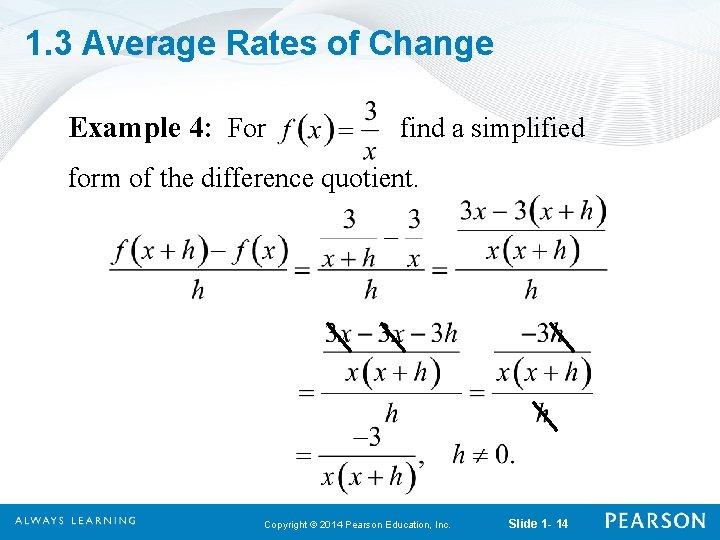
1. 3 Average Rates of Change Example 4: For find a simplified form of the difference quotient. Copyright © 2014 Pearson Education, Inc. Slide 1 - 14
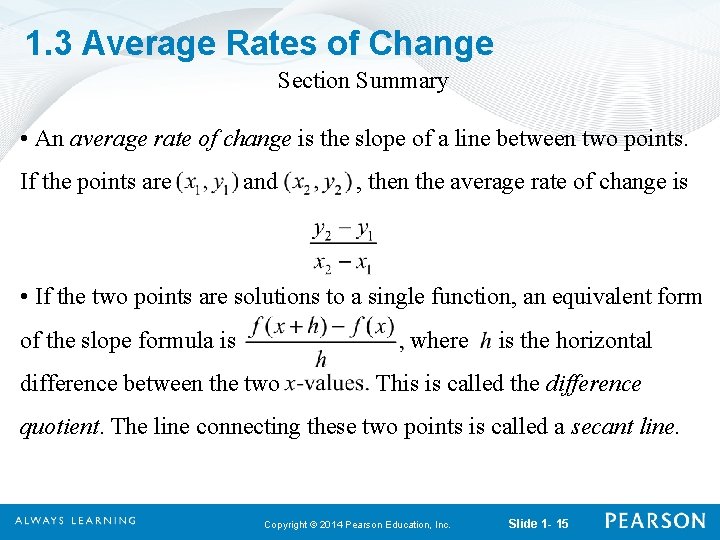
1. 3 Average Rates of Change Section Summary • An average rate of change is the slope of a line between two points. If the points are and , then the average rate of change is • If the two points are solutions to a single function, an equivalent form of the slope formula is where difference between the two is the horizontal This is called the difference quotient. The line connecting these two points is called a secant line. Copyright © 2014 Pearson Education, Inc. Slide 1 - 15
1. 3 Average Rates of Change Section Summary Continued • The difference quotient is the same as the slope formula. Both give the slope of the line between two points. • The difference quotient gives the average rate of change between two points on a graph, represented by the secant line. • It is preferable to simplify a difference quotient algebraically before evaluating it for particular values of and. Copyright © 2014 Pearson Education, Inc. Slide 1 - 16
- Slides: 16