
Available and affordable Is the rapid rise of
Available and affordable – Is the rapid rise of packaged foods in Asia driving malnutrition? Presentation for Food Vision Asia 29 April 2016, Singapore Presenter Regina Moench-Pfanner, Ph. D ibn 360 Pte Ltd, Singapore 1
CORE MESSAGES Ø Despite improvements in food security, nutrition and health statistics in Asia still need improvement Ø A holistic understanding of how people get and consume food and nutrients in the present environment must inform solutions to improve nutrition and health Ø Collaboration needed to lowering the barriers for lowest income populations to obtain a nutritionally complete diet
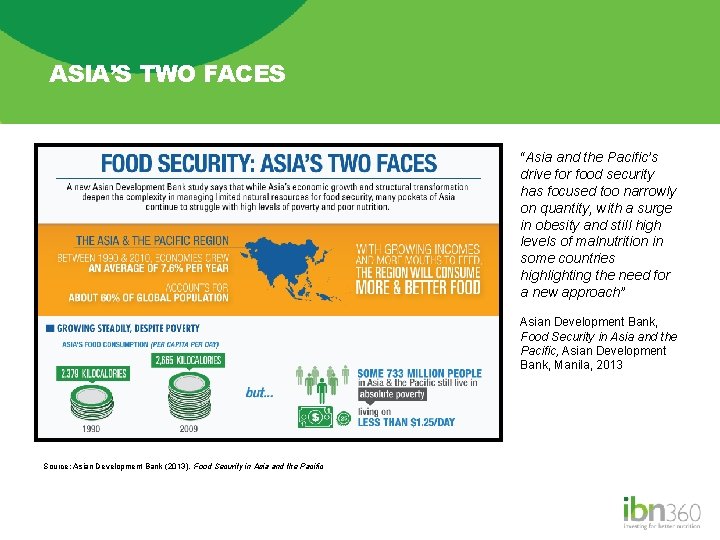
ASIA’S TWO FACES “Asia and the Pacific’s drive for food security has focused too narrowly on quantity, with a surge in obesity and still high levels of malnutrition in some countries highlighting the need for a new approach” Asian Development Bank, Food Security in Asia and the Pacific, Asian Development Bank, Manila, 2013 Source: Asian Development Bank (2013). Food Security in Asia and the Pacific
ASIA HEALTH NUTRITION STATISTICS Asia (East & South Asia): home to almost 4 billion people 34% of children under 5 years stunted (too short for their age) 18% of babies are born with low birth weight 27% of under 5’s weigh too little for their age (underweight) 13% of under 5’s are wasted (i. e. rapid weight loss due to illness/lack of food) The New Norm of Malnutrition: Obesity and NCDs are on the rise alongside undernutrition
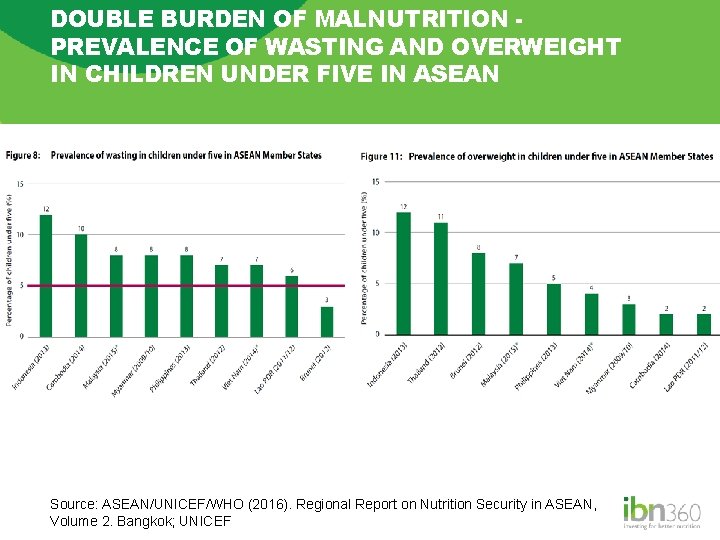
DOUBLE BURDEN OF MALNUTRITION PREVALENCE OF WASTING AND OVERWEIGHT IN CHILDREN UNDER FIVE IN ASEAN Source: ASEAN/UNICEF/WHO (2016). Regional Report on Nutrition Security in ASEAN, Volume 2. Bangkok; UNICEF
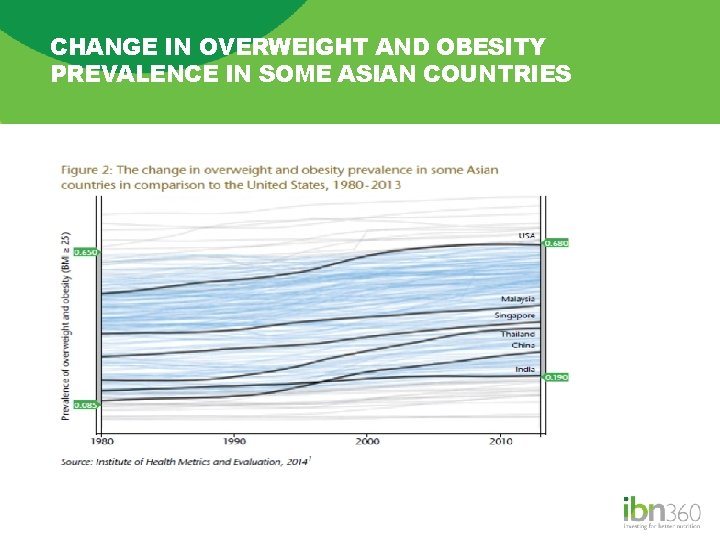
CHANGE IN OVERWEIGHT AND OBESITY PREVALENCE IN SOME ASIAN COUNTRIES
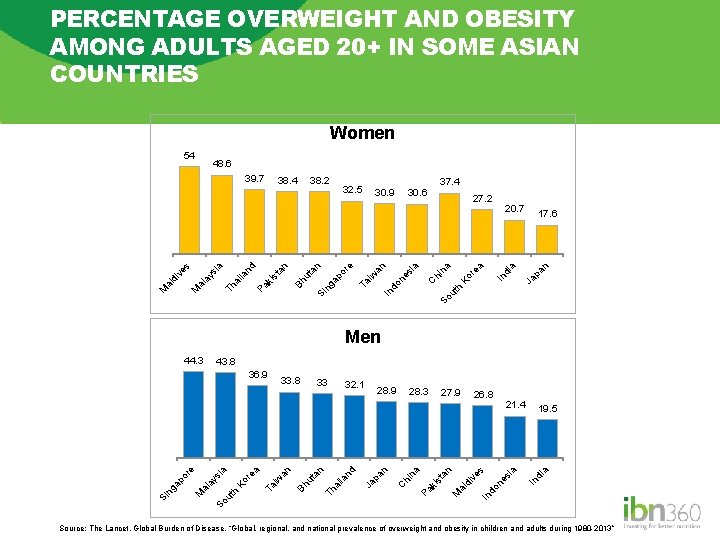
PERCENTAGE OVERWEIGHT AND OBESITY AMONG ADULTS AGED 20+ IN SOME ASIAN COUNTRIES Women 54 48. 6 37. 4 20. 7 17. 6 pa n a di In Ko re a C hi n a a 27. 2 So ut h Ja 30. 6 ne si an Si ng Ta ap ut a 30. 9 iw n or e 32. 5 In do 38. 2 Bh st ki ai la Th an nd 38. 4 Pa a si ay al M M al di ve s 39. 7 Men 44. 3 43. 8 26. 8 a di es i on 19. 5 In a 21. 4 s ve di al M Pa ki st a an 27. 9 In d 28. 3 hi n pa n 28. 9 Ja nd ai la Th ut a n 32. 1 C 33 Bh h ut So 33. 8 Ko re a Ta iw an a si ay al M Si ng ap or e 36. 9 Source: The Lancet. Global Burden of Disease, “Global, regional, and national prevalence of overweight and obesity in children and adults during 1980 -2013”
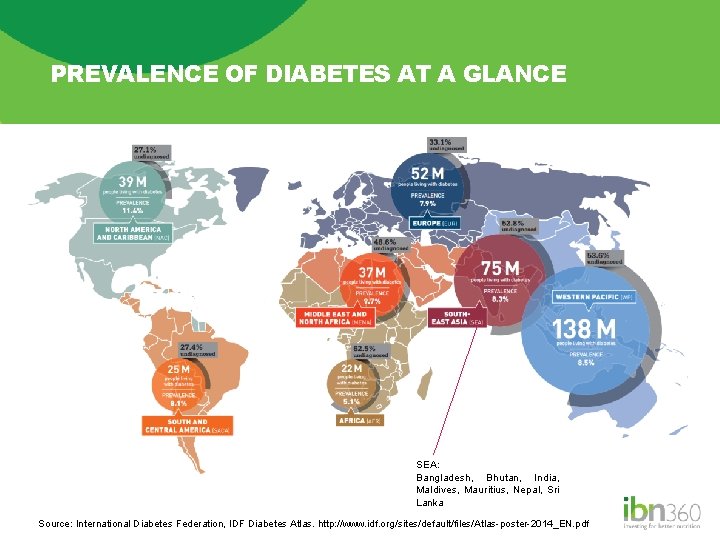
PREVALENCE OF DIABETES AT A GLANCE SEA: Bangladesh, Bhutan, India, Maldives, Mauritius, Nepal, Sri Lanka Source: International Diabetes Federation, IDF Diabetes Atlas. http: //www. idf. org/sites/default/files/Atlas-poster-2014_EN. pdf
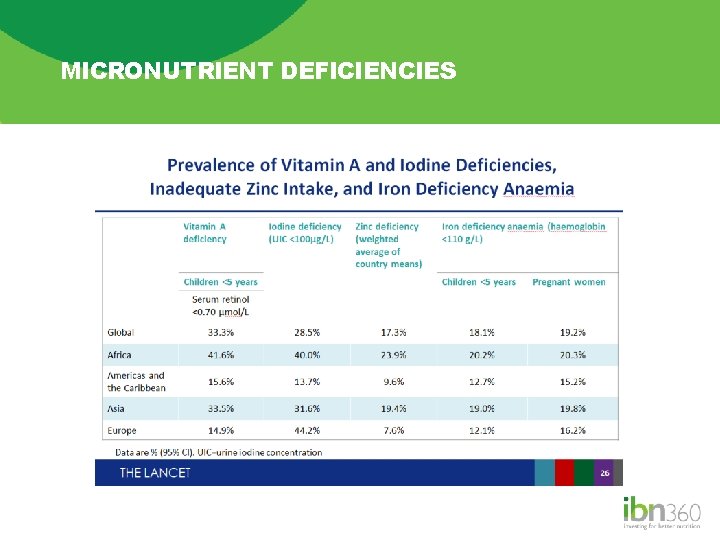
MICRONUTRIENT DEFICIENCIES
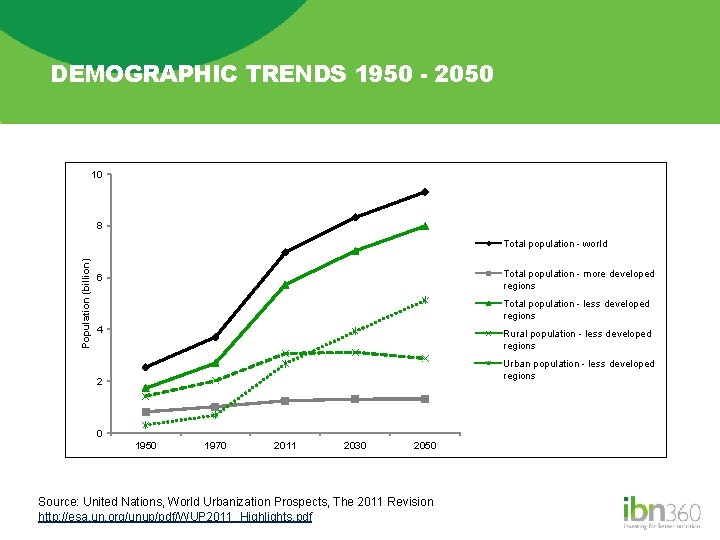
DEMOGRAPHIC TRENDS 1950 - 2050 10 8 Population (billion) Total population - world Total population - more developed regions 6 Total population - less developed regions 4 Rural population - less developed regions Urban population - less developed regions 2 0 1950 1970 2011 2030 2050 Source: United Nations, World Urbanization Prospects, The 2011 Revision http: //esa. un. org/unup/pdf/WUP 2011_Highlights. pdf

A holistic understanding of how people get and consume food and nutrients in the present environment must inform solutions to improve nutrition and health
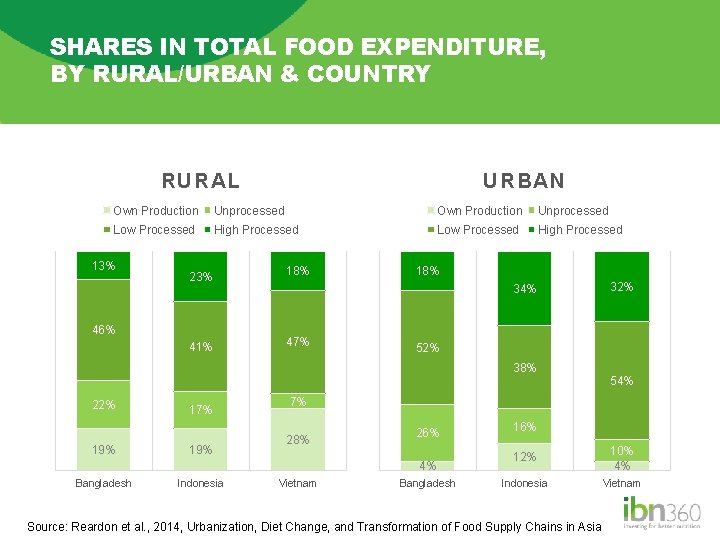
SHARES IN TOTAL FOOD EXPENDITURE, BY RURAL/URBAN & COUNTRY RURAL URBAN Own Production Unprocessed Low Processed High Processed 13% 23% 18% 41% 47% 46% 18% 34% 52% 38% 22% 19% 17% 19% Indonesia 54% 7% 28% 26% 4% Bangladesh 32% Vietnam Bangladesh 16% 12% 10% 4% Indonesia Vietnam Source: Reardon et al. , 2014, Urbanization, Diet Change, and Transformation of Food Supply Chains in Asia
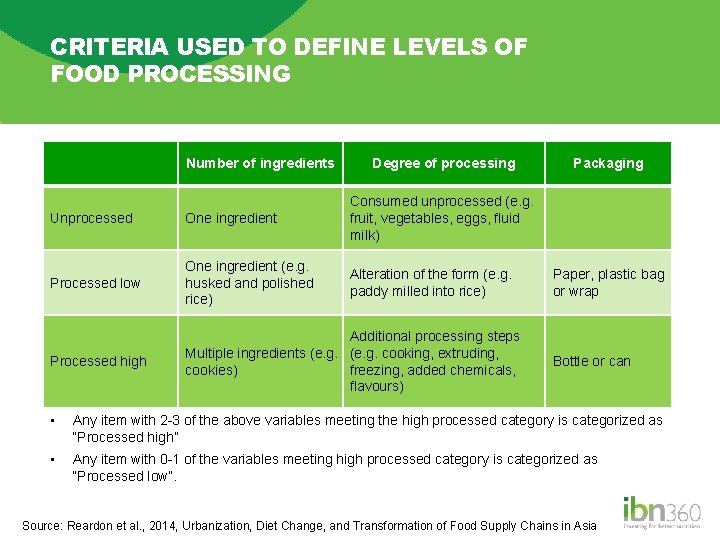
CRITERIA USED TO DEFINE LEVELS OF FOOD PROCESSING Number of ingredients Degree of processing Unprocessed One ingredient Consumed unprocessed (e. g. fruit, vegetables, eggs, fluid milk) Processed low One ingredient (e. g. husked and polished rice) Alteration of the form (e. g. paddy milled into rice) Processed high Additional processing steps Multiple ingredients (e. g. cooking, extruding, cookies) freezing, added chemicals, flavours) Packaging Paper, plastic bag or wrap Bottle or can • Any item with 2 -3 of the above variables meeting the high processed category is categorized as “Processed high” • Any item with 0 -1 of the variables meeting high processed category is categorized as “Processed low”. Source: Reardon et al. , 2014, Urbanization, Diet Change, and Transformation of Food Supply Chains in Asia
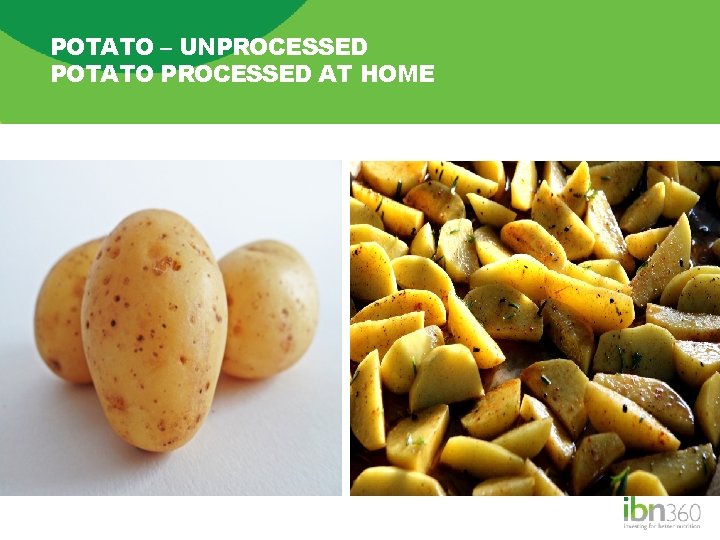
POTATO – UNPROCESSED POTATO PROCESSED AT HOME
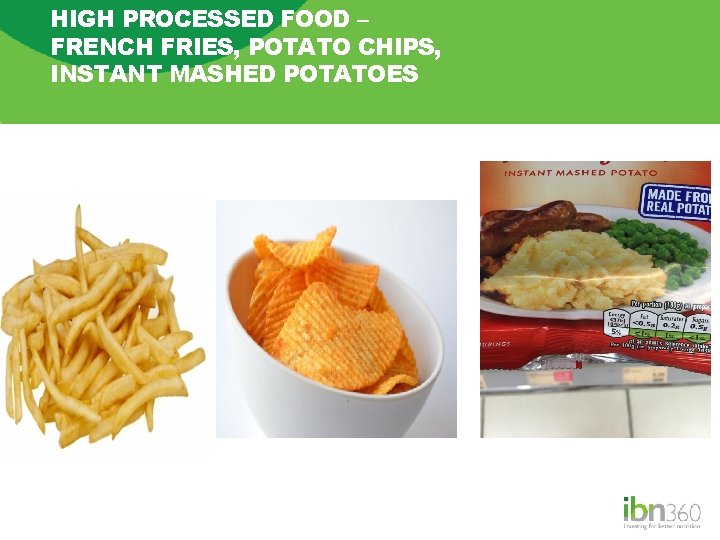
HIGH PROCESSED FOOD – FRENCH FRIES, POTATO CHIPS, INSTANT MASHED POTATOES
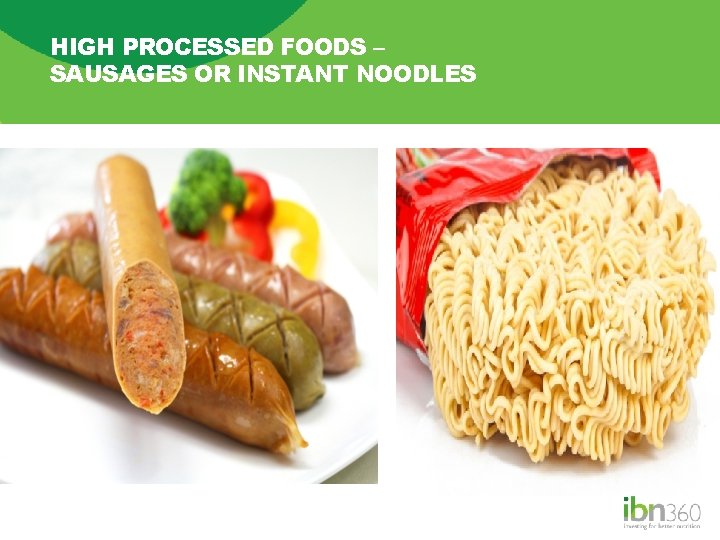
HIGH PROCESSED FOODS – SAUSAGES OR INSTANT NOODLES
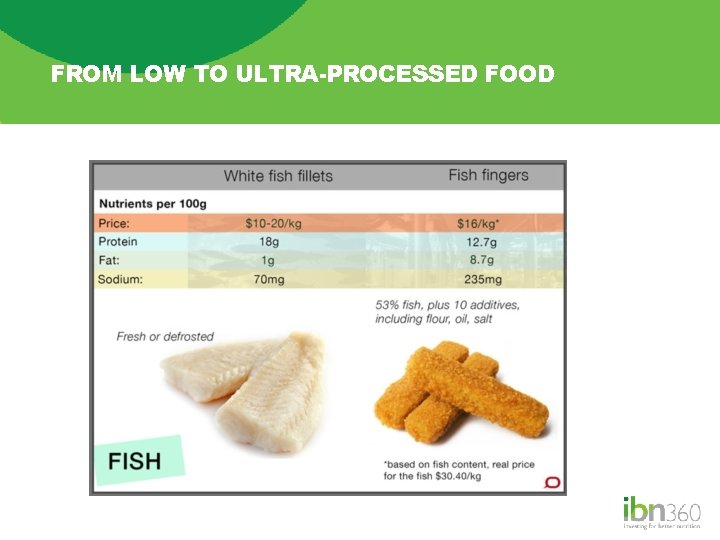
FROM LOW TO ULTRA-PROCESSED FOOD
PROCESSED FOODS – BRIEF HISTORY • Industrialization: § efficient formulation § mass manufacture § distribution and sale of processed foods • Declines in food insecurity and nutrient deficiencies of public health concern in early 20 th century • Cheap surplus grain + food science/technology advances → processed products made from cheap ingredients and additives • Rapid increases in NCDs at first in high -income countries, then globally
DEFNITION OF ULTRA-PROCESSED PRODUCTS • “Ultra-processed products are made from processed substances extracted or refined from whole foods – e. g. oils, hydrogenated oils and fats, flours and starches, variants of sugar, and cheap parts or remnants of animal foods – with little or no whole foods. “ • “[They] are typically energy dense; have a high glycaemic load; are low in dietary fibre, micronutrients, and phytochemicals; and are high in unhealthy types of dietary fat, free sugars, and sodium. ”
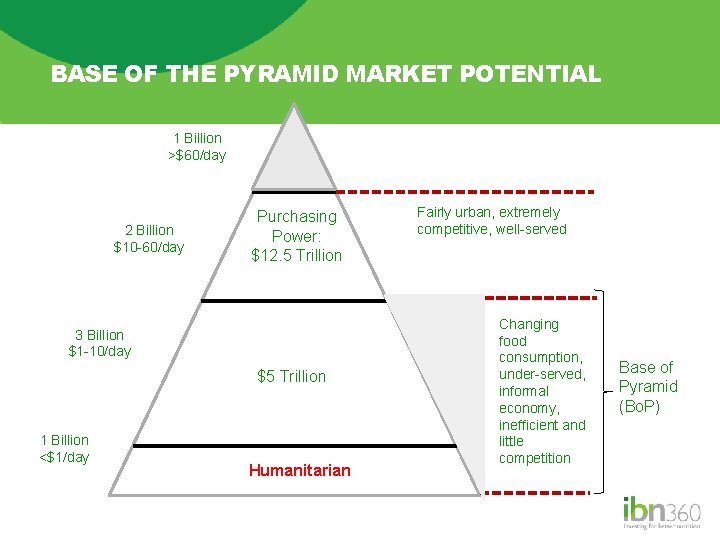
BASE OF THE PYRAMID MARKET POTENTIAL 1 Billion >$60/day 2 Billion $10 -60/day Purchasing Power: $12. 5 Trillion 3 Billion $1 -10/day $5 Trillion 1 Billion <$1/day Humanitarian Fairly urban, extremely competitive, well-served Changing food consumption, under-served, informal economy, inefficient and little competition Base of Pyramid (Bo. P)
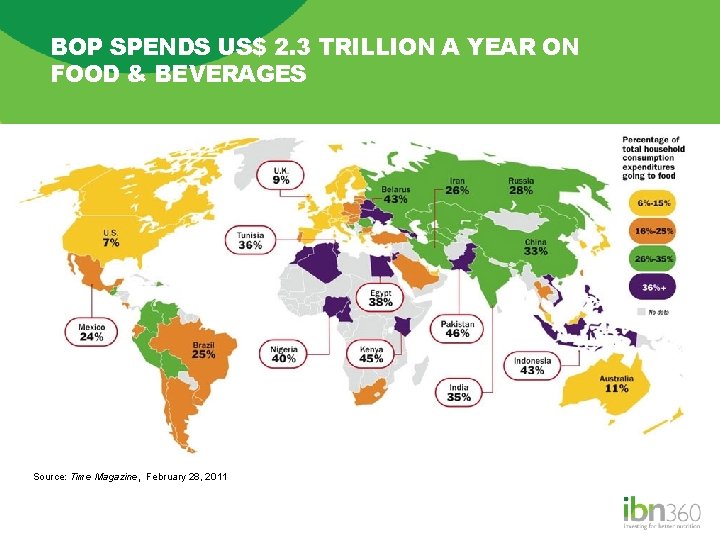
BOP SPENDS US$ 2. 3 TRILLION A YEAR ON FOOD & BEVERAGES Source: Time Magazine, February 28, 2011
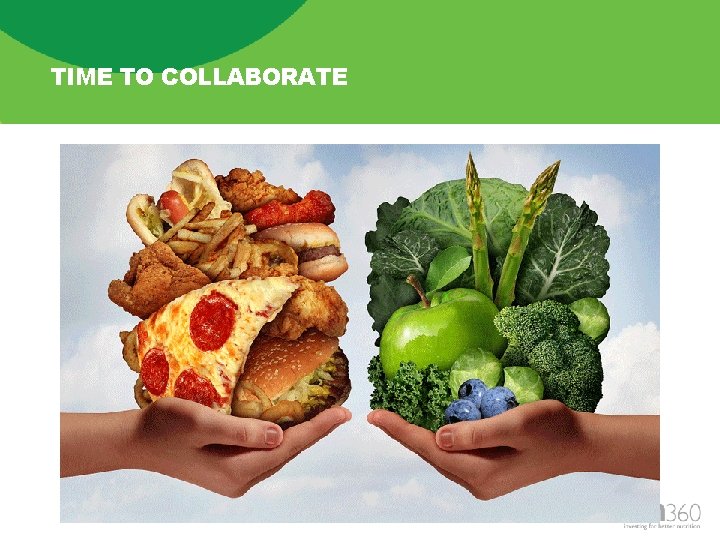
TIME TO COLLABORATE ‘promoting a healthy, affordable nutritious diet for all’ + healthy lifestyle
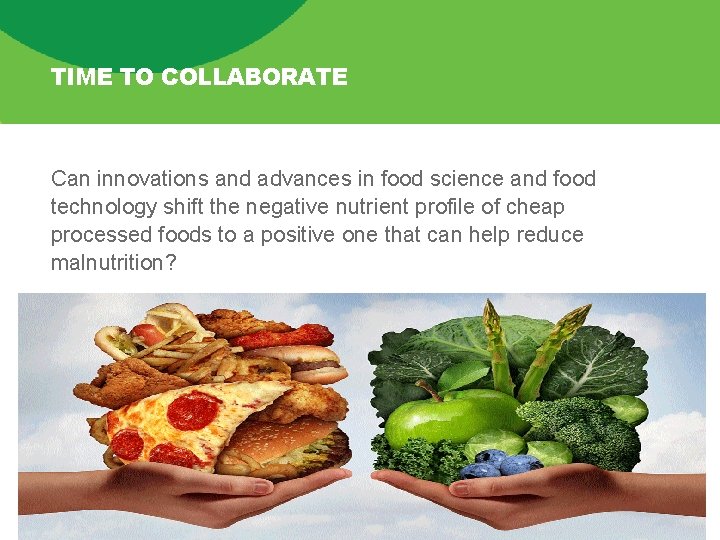
TIME TO COLLABORATE Can innovations and advances in food science and food technology shift the negative nutrient profile of cheap processed foods to a positive one that can help reduce malnutrition?
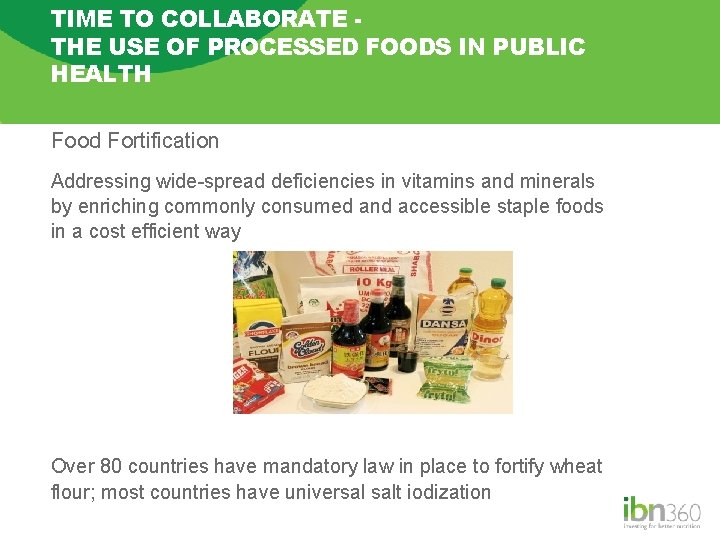
TIME TO COLLABORATE THE USE OF PROCESSED FOODS IN PUBLIC HEALTH Food Fortification Addressing wide-spread deficiencies in vitamins and minerals by enriching commonly consumed and accessible staple foods in a cost efficient way Over 80 countries have mandatory law in place to fortify wheat flour; most countries have universal salt iodization
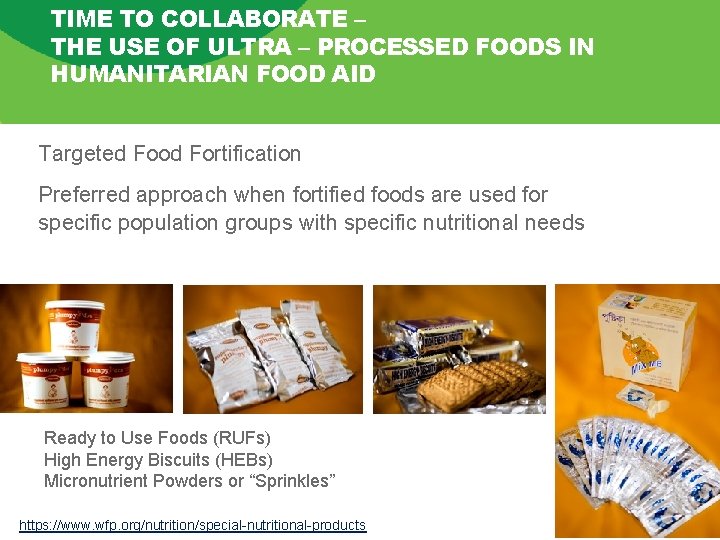
TIME TO COLLABORATE – THE USE OF ULTRA – PROCESSED FOODS IN HUMANITARIAN FOOD AID Targeted Food Fortification Preferred approach when fortified foods are used for specific population groups with specific nutritional needs Ready to Use Foods (RUFs) High Energy Biscuits (HEBs) Micronutrient Powders or “Sprinkles” https: //www. wfp. org/nutrition/special-nutritional-products
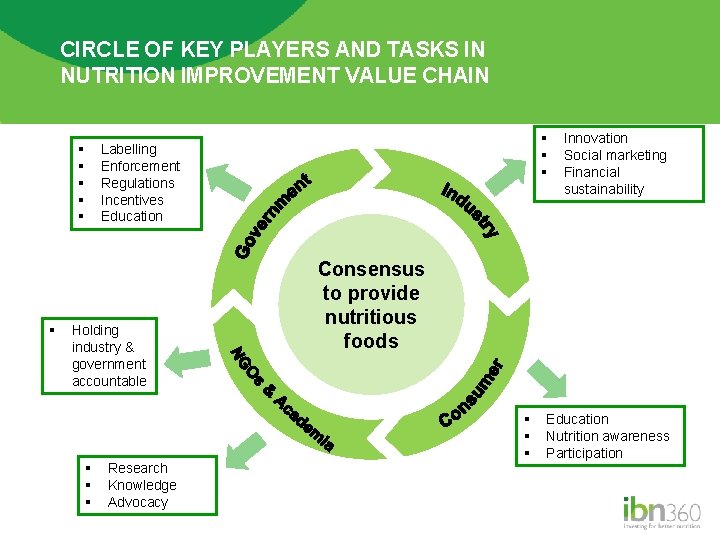
CIRCLE OF KEY PLAYERS AND TASKS IN NUTRITION IMPROVEMENT VALUE CHAIN § § § § § Labelling Enforcement Regulations Incentives Education Holding industry & government accountable § § § Research Knowledge Advocacy Innovation Social marketing Financial sustainability Consensus to provide nutritious foods § § § Education Nutrition awareness Participation
MULTISECTORAL COLLABORATIONS BEYOND NUTRITION ARE NEEDED TO FIX NUTRITION ► Nutrition-specific interventions, if scaled up to 90% coverage, could reduce stunting by 20. 3%; the remaining efforts need to come from nutrition-sensitive interventions Source: Lancet Maternal and Child Nutrition Series, 2013
CORE MESSAGE FOR ACTION ► Given the scale of private sector’s influence on dietary intake, the private sector needs to be co-opted into creating solutions for reducing double burden of malnutrition ► Expand the circles of (existing) collaborations to be inclusive of all relevant actors and sectors across the nutrition improvement value chain
CORE MESSAGE FOR ACTION Let’s harness existing and future innovation in food science, technology and delivery systems to… expand access to a nutritionally optimal diet by… ► Improving the nutrient profiles of processed foods ► Maintaining low cost for the consumer and profitability for the manufacturer/producer ► Reducing food waste/loss post-harvest ► Anchoring these in food policies and regulations

Q&A

Information & correspondence: Regina Moench-Pfanner, Ph. D Chief Executive Officer, Ibn 360 Pte Ltd 3 Pickering Street, #02 -36 Nankin Row, China Square Central, Singapore 048660 m +65 8387 2535 • t +65 6327 8824 • f +65 6223 7314 regina@ibn-360. com • www. ibn-360. com • @Moenchpfanner 31
- Slides: 31