Availability and Maintainability Benchmarks A Case Study of
Availability and Maintainability Benchmarks A Case Study of Software RAID Systems Aaron Brown, Eric Anderson, and David A. Patterson Computer Science Division University of California at Berkeley 2000 Summer IRAM/ISTORE Retreat 13 July 2000 Slide 1
Overview • Availability and Maintainability are key goals for the ISTORE project • How do we achieve these goals? – start by understanding them – figure out how to measure them – evaluate existing systems and techniques – develop new approaches based on what we’ve learned » and measure them as well! Slide 2
Overview • Availability and Maintainability are key goals for the ISTORE project • How do we achieve these goals? – start by understanding them – figure out how to measure them – evaluate existing systems and techniques – develop new approaches based on what we’ve learned » and measure them as well! • Benchmarks make these tasks possible! Slide 3
Part I Availability Benchmarks Slide 4
Outline: Availability Benchmarks • Motivation: why benchmark availability? • Availability benchmarks: a general approach • Case study: availability of software RAID – Linux (RH 6. 0), Solaris (x 86), and Windows 2000 • Conclusions Slide 5
Why benchmark availability? • System availability is a pressing problem – modern applications demand near-100% availability » e-commerce, enterprise apps, online services, ISPs » at all scales and price points – we don’t know how to build highly-available systems! » except at the very high-end • Few tools exist to provide insight into system availability – most existing benchmarks ignore availability » focus on performance, and under ideal conditions – no comprehensive, well-defined metrics for availability Slide 6
Step 1: Availability metrics • Traditionally, percentage of time system is up – time-averaged, binary view of system state (up/down) • This metric is inflexible – doesn’t capture degraded states » a non-binary spectrum between “up” and “down” – time-averaging discards important temporal behavior » compare 2 systems with 96. 7% traditional availability: • system A is down for 2 seconds per minute • system B is down for 1 day per month • Our solution: measure variation in system quality of service metrics over time – performance, fault-tolerance, completeness, accuracy Slide 7
Step 2: Measurement techniques • Goal: quantify variation in Qo. S metrics as events occur that affect system availability • Leverage existing performance benchmarks – to measure & trace quality of service metrics – to generate fair workloads • Use fault injection to compromise system – hardware faults (disk, memory, network, power) – software faults (corrupt input, driver error returns) – maintenance events (repairs, SW/HW upgrades) • Examine single-fault and multi-fault workloads – the availability analogues of performance micro- and macro-benchmarks Slide 8
Step 3: Reporting results • Results are most accessible graphically – plot change in Qo. S metrics over time – compare to “normal” behavior » 99% confidence intervals calculated from no-fault runs • Graphs can be distilled into numbers Slide 9
Case study • Availability of software RAID-5 & web server – Linux/Apache, Solaris/Apache, Windows 2000/IIS • Why software RAID? – well-defined availability guarantees » RAID-5 volume should tolerate a single disk failure » reduced performance (degraded mode) after failure » may automatically rebuild redundancy onto spare disk – simple system – easy to inject storage faults • Why web server? – an application with measurable Qo. S metrics that depend on RAID availability and performance Slide 10
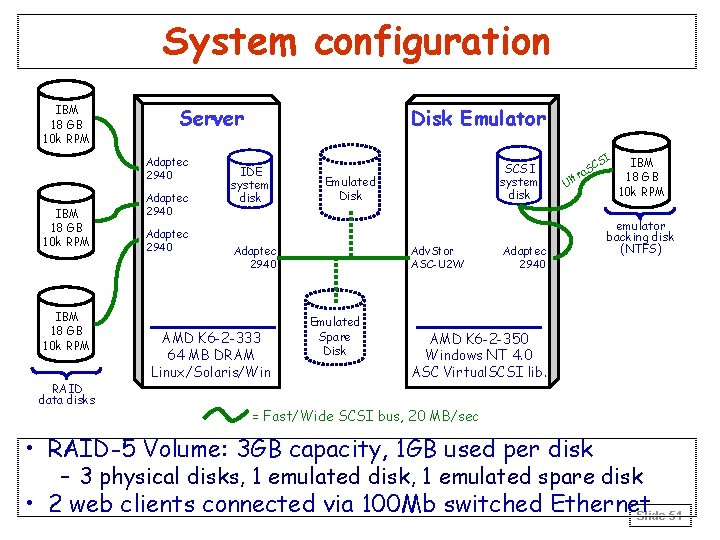
Benchmark environment • RAID-5 setup – 3 GB volume, 4 active 1 GB disks, 1 hot spare disk • Workload generator and data collector – SPECWeb 99 web benchmark » simulates realistic high-volume user load » mostly static read-only workload » modified to run continuously and to measure average hits per second over each 2 -minute interval • Qo. S metrics measured – hits per second » roughly tracks response time in our experiments – degree of fault tolerance in storage system Slide 11
Benchmark environment: faults • Focus on faults in the storage system (disks) • Emulated disk provides reproducible faults – a PC that appears as a disk on the SCSI bus – I/O requests intercepted and reflected to local disk – fault injection performed by altering SCSI command processing in the emulation software • Fault set chosen to match faults observed in a long-term study of a large storage array – media errors, hardware errors, parity errors, power failures, disk hangs/timeouts – both transient and “sticky” faults Slide 12
Single-fault experiments • “Micro-benchmarks” • Selected 15 fault types – 8 benign (retry required) – 2 serious (permanently unrecoverable) – 5 pathological (power failures and complete hangs) • An experiment for each type of fault – only one fault injected per experiment – no human intervention – system allowed to continue until stabilized or crashed Slide 13
Multiple-fault experiments • “Macro-benchmarks” that require human intervention • Scenario 1: reconstruction (1) disk fails (2) data is reconstructed onto spare (3) spare fails (4) administrator replaces both failed disks (5) data is reconstructed onto new disks • Scenario 2: double failure (1) disk fails (2) reconstruction starts (3) administrator accidentally removes active disk (4) administrator tries to repair damage Slide 14
Comparison of systems • Benchmarks revealed significant variation in failure-handling policy across the 3 systems – transient error handling – reconstruction policy – double-fault handling • Most of these policies were undocumented – yet they are critical to understanding the systems’ availability Slide 15
Transient error handling • Transient errors are common in large arrays – example: Berkeley 368 -disk Tertiary Disk array, 11 mo. » 368 disks reported transient SCSI errors (100%) » 13 disks reported transient hardware errors (3. 5%) » 2 disk failures (0. 5%) – isolated transients do not imply disk failures – but streams of transients indicate failing disks » both Tertiary Disk failures showed this behavior • Transient error handling policy is critical in long-term availability of array Slide 16
Transient error handling (2) • Linux is paranoid with respect to transients – stops using affected disk (and reconstructs) on any error, transient or not » fragile: system is more vulnerable to multiple faults » disk-inefficient: wastes two disks per transient » but no chance of slowly-failing disk impacting perf. • Solaris and Windows are more forgiving – both ignore most benign/transient faults » robust: less likely to lose data, more disk-efficient » less likely to catch slowly-failing disks and remove them • Neither policy is ideal! – need a hybrid that detects streams of transients Slide 17
Reconstruction policy • Reconstruction policy involves an availability tradeoff between performance & redundancy – until reconstruction completes, array is vulnerable to second fault – disk and CPU bandwidth dedicated to reconstruction is not available to application » but reconstruction bandwidth determines reconstruction speed – policy must trade off performance availability and potential data availability Slide 18
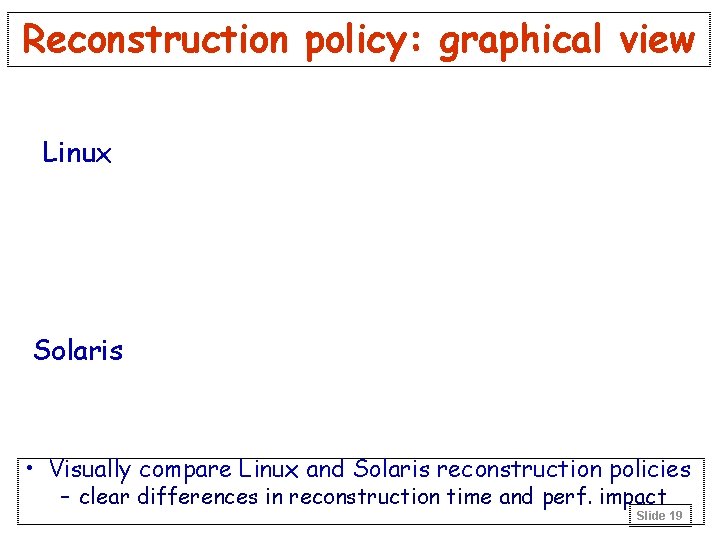
Reconstruction policy: graphical view Linux Solaris • Visually compare Linux and Solaris reconstruction policies – clear differences in reconstruction time and perf. impact Slide 19
Reconstruction policy (2) • Linux: favors performance over data availability – automatically-initiated reconstruction, idle bandwidth – virtually no performance impact on application – very long window of vulnerability (>1 hr for 3 GB RAID) • Solaris: favors data availability over app. perf. – automatically-initiated reconstruction at high BW – as much as 34% drop in application performance – short window of vulnerability (10 minutes for 3 GB) • Windows: favors neither! – manually-initiated reconstruction at moderate BW – as much as 18% app. performance drop – somewhat short window of vulnerability (23 min/3 GB) Slide 20
Double-fault handling • A double fault results in unrecoverable loss of some data on the RAID volume • Linux: blocked access to volume • Windows: blocked access to volume • Solaris: silently continued using volume, delivering fabricated data to application! – clear violation of RAID availability semantics – resulted in corrupted file system and garbage data at the application level – this undocumented policy has serious availability implications for applications Slide 21
Availability Conclusions: Case study • RAID vendors should expose and document policies affecting availability – ideally should be user-adjustable • Availability benchmarks can provide valuable insight into availability behavior of systems – reveal undocumented availability policies – illustrate impact of specific faults on system behavior • We believe our approach can be generalized well beyond RAID and storage systems – the RAID case study is based on a general methodology Slide 22
Conclusions: Availability benchmarks • Our methodology is best for understanding the availability behavior of a system – extensions are needed to distill results for automated system comparison • A good fault-injection environment is critical – need realistic, reproducible, controlled faults – system designers should consider building in hooks for fault-injection and availability testing • Measuring and understanding availability will be crucial in building systems that meet the needs of modern server applications – our benchmarking methodology is just the first step towards this important goal Slide 23
Availability: Future opportunities • Understanding availability of more complex systems – availability benchmarks for databases » inject faults during TPC benchmarking runs » how well do DB integrity techniques (transactions, logging, replication) mask failures? » how is performance affected by faults? – availability benchmarks for distributed applications » discover error propagation paths » characterize behavior under partial failure • Designing systems with built-in support for availability testing • You can help! Slide 24
Part II Maintainability Benchmarks Slide 25
Outline: Maintainability Benchmarks • Motivation: why benchmark maintainability? • Maintainability benchmarks: an idea for a general approach • Case study: maintainability of software RAID – Linux (RH 6. 0), Solaris (x 86), and Windows 2000 – User trials with five subjects • Discussion and future directions Slide 26
Motivation • Human behavior can be the determining factor in system availability and reliability – high percentage of outages caused by human error – availability often affected by lack of maintenance, botched maintenance, poor configuration/tuning – we’d like to build “touch-free” self-maintaining systems • Again, no tools exist to provide insight into what makes a system more maintainable – our availability benchmarks purposely excluded the human factor – benchmarks are a challenge due to human variability – metrics are even sketchier here than for availability Slide 27
Metrics & Approach • A system’s overall maintainability cannot be universally characterized with a single number – too much variation in capabilities, usage patterns, administrator demands and training, etc. • Alternate approach: characterization vectors – capture detailed, universal characterizations of systems and sites as vectors of costs and frequencies – provide the ability to distill the characterization vectors into site-specific metrics Slide 28
Methodology • Characterization-vector-based approach 1) build an extensible taxonomy of maintenance tasks 2) measure the normalized cost of each task on system » result is a vector of costs that characterizes the possible components of a system’s maintainability 3) measure task frequencies for a specific site/system » result is a frequency vector characterizing a site/sys 4) apply a site-specific cost function » distills cost and frequency characterization vectors » captures site-specific usage patterns, administrative policies, administrator priorities, . . . Slide 29
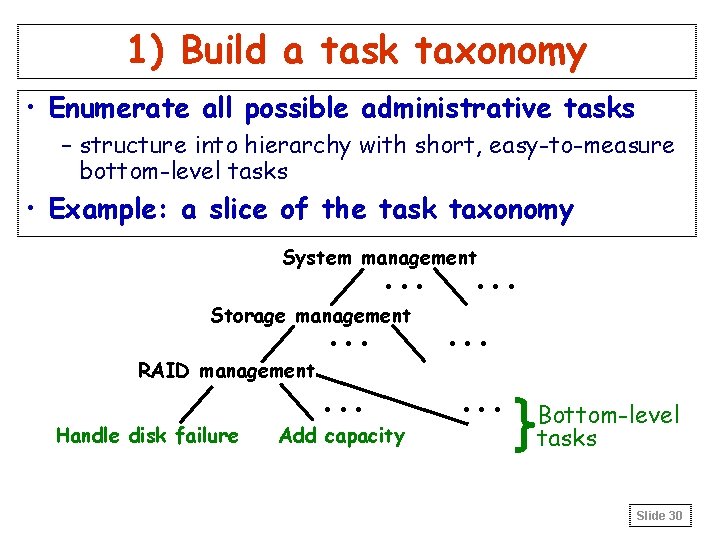
1) Build a task taxonomy • Enumerate all possible administrative tasks – structure into hierarchy with short, easy-to-measure bottom-level tasks • Example: a slice of the task taxonomy System management . . . Storage management . . . RAID management Handle disk failure . . . Add capacity . . Bottom-level tasks Slide 30
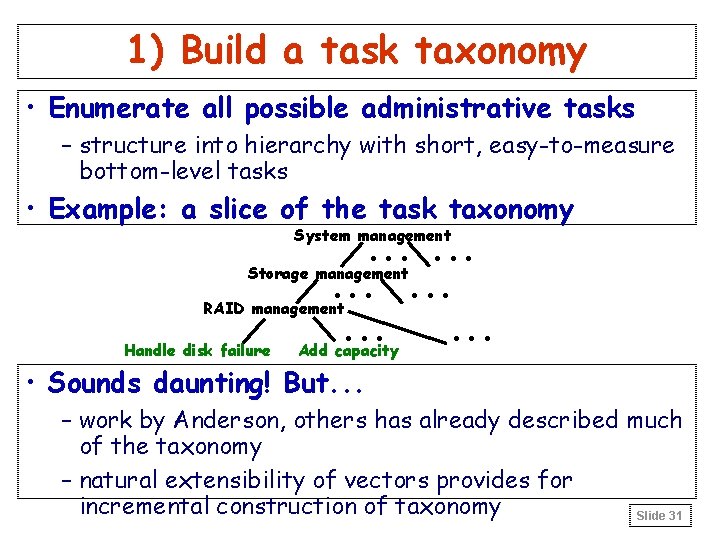
1) Build a task taxonomy • Enumerate all possible administrative tasks – structure into hierarchy with short, easy-to-measure bottom-level tasks • Example: a slice of the task taxonomy . . . Storage management. . . RAID management. . . Handle disk failure Add capacity System management • Sounds daunting! But. . . – work by Anderson, others has already described much of the taxonomy – natural extensibility of vectors provides for incremental construction of taxonomy Slide 31
2) Measure a task’s cost • Multiple cost metrics – time: how long does it take to perform the task? » ideally, measure minimum time that user must spend • no “think time” • experienced user should achieve this minimum » subtleties in handling periods where user waits for sys. – impact: how does the task affect system availability? » use availability benchmarks, distilled into numbers – learning curve: how hard is it to reach min. time? » this one’s a challenge since it’s user-dependent » measure via user studies • how many errors do users make while learning tasks? • how long does it take for users to reach min. time? • does frequency of user errors decrease with time? Slide 32
3) Measure task frequencies • Goal: determine relative importance of tasks – inherently site- and system-specific • Measurement options – administrator surveys – logs (machine-generated and human-generated) • Can we keep site and system orthogonal? – orthogonality simplifies measurement task » can develop frequency vector before system’s installed – but, while some frequencies are site-specific. . . » planned events like backup & upgrade schedules –. . . others depend on both the site and system » some systems will require less frequent maintenance than others Slide 33
4) Apply a cost function • Human time cost: – take dot product of time-cost characterization vector with frequency vector (weighted sum) – use learning-curve characterization as a “fudge factor” based on experience of administrators (? ) » also, frequency of task and learning curve interact • Availability cost: – dot product of availability-impact characterization vector with frequency vector • Any arbitrary cost function possible – characterization vectors include all raw information – sites can define their own Slide 34
Case Study • Goal is to gain experience with a small piece of the problem – can we measure the time and learning-curve costs for one task? – how confounding is human variability? – what’s needed to set up experiments for human participants? • Task: handling disk failure in RAID system – includes detection and repair Slide 35
Experimental platform • 5 -disk software RAID backing web server – all disks emulated (50 MB each) – 4 data disks, one spare – emulator modified to simulate disk insertion/removal – light web server workload » non-overlapped static requests issued every 200 us • Same test systems as availability case study – Windows 2000/IIS, Linux/Apache, Solaris/Apache • Five test subjects – 1 professor, 3 grad students, 1 sysadmin – each used all 3 systems (in random order) Slide 36
Experimental procedure • Training – goal was to establish common knowledge base – subjects were given 7 slides explaining the task and general setup, and 5 slides on each system’s details » included step-by-step, illustrated instructions for task Slide 37
Experimental procedure (2) • Experiment – an operating system was selected – users were given unlimited time for familiarization – for 45 minutes, the following steps were repeated: » system selects random 1 -5 minute delay » at end of delay, system emulates disk failure » user must notice and repair failure • includes replacing disks and initiating/waiting for reconstruction – the experiment was then repeated for the other two operating systems Slide 38
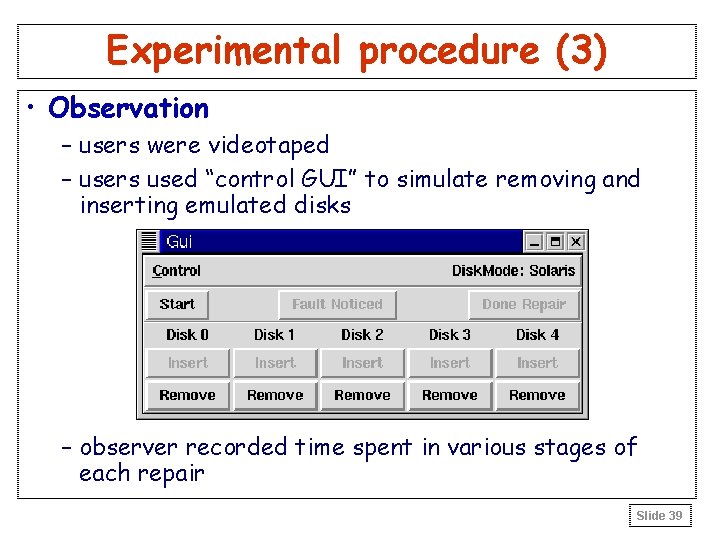
Experimental procedure (3) • Observation – users were videotaped – users used “control GUI” to simulate removing and inserting emulated disks – observer recorded time spent in various stages of each repair Slide 39
Sample results: time • Graphs plot human time, excluding wait time Slide 40
Analysis of time results • Rapid convergence across all OSs/subjects – despite high initial variability – final plateau defines “minimum” time for task – subject’s experience/approach don’t influence plateau » similar plateaus for sysadmin and novice » script users did about the same as manual users • Clear differences in plateaus between OSs – Solaris < Windows < Linux » note: statistically dubious conclusion given sample size! Slide 41
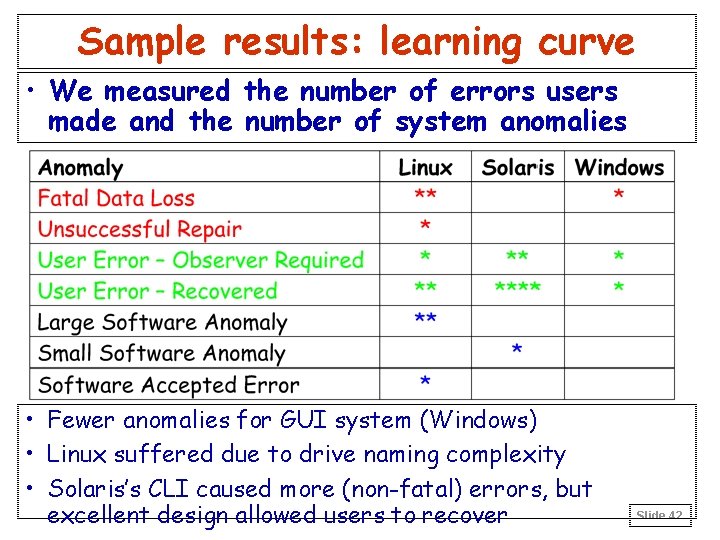
Sample results: learning curve • We measured the number of errors users made and the number of system anomalies • Fewer anomalies for GUI system (Windows) • Linux suffered due to drive naming complexity • Solaris’s CLI caused more (non-fatal) errors, but excellent design allowed users to recover Slide 42
Discussion • Can we draw conclusions about which system is more maintainable? – statistically: no » differences are within confidence intervals for sample » sample size for statistically meaningful results: 10 -25 • But, from observations & learning curve data: – Linux is the least maintainable » more commands to perform task, baroque naming scheme – Windows: GUI helps naïve users avoid mistakes, but frustrates advanced users (no scriptability) – Solaris: good CLI can be as easy to use as a GUI » most subjects liked Solaris the best Slide 43
Discussion (2) • Surprising results – all subjects converged to same time plateau » with suitable training and practice, time cost is independent of experience and approach – some users continued to make errors even after their task times reached the minimum plateau » learning curve measurements must look at both time and potential for error – no obvious winner between GUIs and CLIs » secondary interface issues like naming dominated Slide 44
Early reactions • ASPLOS-00 reviewers – “the work is fundamentally flawed by its lack of consideration of the basic rules of the statistical studies involving humans. . . meaningful studies contain hundreds if not thousands of subjects” – “I didn't feel like there was anything particularly deep or surprising in it” – “The real problem is that, at least in the research community, manageability isn't valued, not that it isn't quantifiable” • We have an uphill battle – to convince people that this topic is important – to transplant understanding of human studies research to the systems community Slide 45
Future Directions: Maintainability • We have a long way to go before these ideas form a workable benchmark – completing a standard task taxonomy – automating and simplifying measurements of task cost » built-in hooks for system-wide fault injection and user response monitoring » can we eventually get the human out of the loop? – developing site profiling techniques to get task freqs – developing useful cost functions • Better human studies technology needed – collaborate with UI or social science groups – larger-scale experiments for statistical significance » collaborate with sysadmin training schools? Slide 46
Searching for feedback. . . • Is manageability interesting enough for the community to care about it? – ASPLOS reviewer: The real problem is that, at least in the research community, manageability isn't valued • Is the human-experiment approach viable? – will the community embrace any approach involving human experiments? – is the cost of performing the benchmark greater than the value of its results? – can we eventually get rid of the human? – what are other possibilities? • What about unexpected non-repetitive tasks? Slide 47
Backup Slides Slide 48
Approaching availability benchmarks • Goal: measure and understand availability – find answers to questions like: » what factors affect the quality of service delivered by the system? » by how much and for how long? » how well can systems survive typical fault scenarios? • Need: – metrics – measurement methodology – techniques to report/compare results Slide 49
Example Quality of Service metrics • Performance – e. g. , user-perceived latency, server throughput • Degree of fault-tolerance • Completeness – e. g. , how much of relevant data is used to answer query • Accuracy – e. g. , of a computation or decoding/encoding process • Capacity – e. g. , admission control limits, access to non-essential services Slide 50
System configuration IBM 18 GB 10 k RPM Server Adaptec 2940 IBM 18 GB 10 k RPM RAID data disks Adaptec 2940 Disk Emulator IDE system disk Emulated Disk Adaptec 2940 AMD K 6 -2 -333 64 MB DRAM Linux/Solaris/Win SCSI system disk Adv. Stor ASC-U 2 W Emulated Spare Disk C a. S U ltr Adaptec 2940 SI IBM 18 GB 10 k RPM emulator backing disk (NTFS) AMD K 6 -2 -350 Windows NT 4. 0 ASC Virtual. SCSI lib. = Fast/Wide SCSI bus, 20 MB/sec • RAID-5 Volume: 3 GB capacity, 1 GB used per disk – 3 physical disks, 1 emulated disk, 1 emulated spare disk • 2 web clients connected via 100 Mb switched Ethernet Slide 51
Single-fault results • Only five distinct behaviors were observed Slide 52
Behavior A: no effect • Injected fault has no effect on RAID system Solaris, transient correctable read Slide 53
Behavior B: lost redundancy • RAID system stops using affected disk – no more redundancy, no automatic reconstruction Windows 2000, simulated disk power failure Slide 54
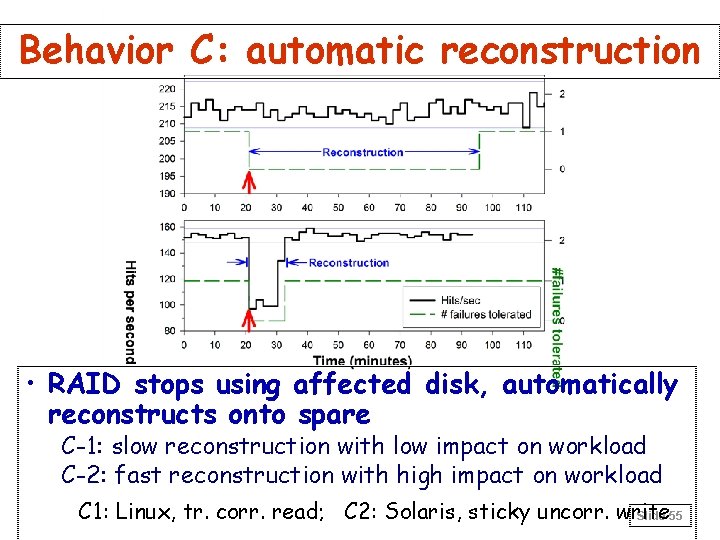
Behavior C: automatic reconstruction • RAID stops using affected disk, automatically reconstructs onto spare C-1: slow reconstruction with low impact on workload C-2: fast reconstruction with high impact on workload C 1: Linux, tr. corr. read; C 2: Solaris, sticky uncorr. write Slide 55
Behavior D: system failure • RAID system cannot tolerate injected fault Solaris, disk hang on read Slide 56
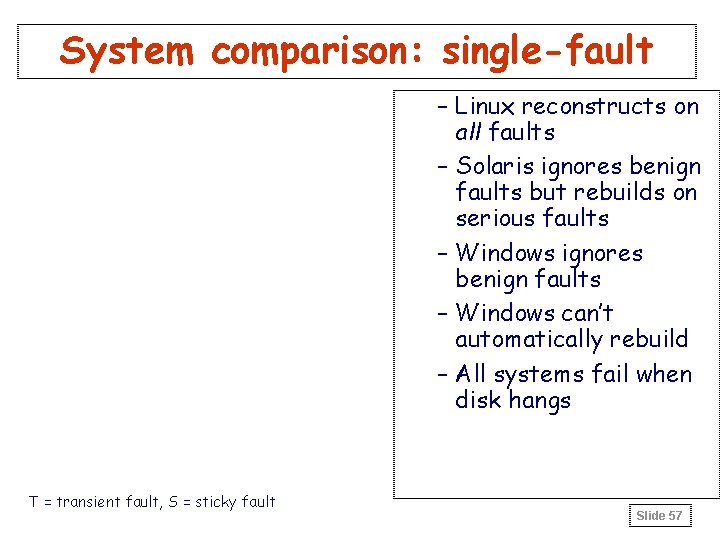
System comparison: single-fault – Linux reconstructs on all faults – Solaris ignores benign faults but rebuilds on serious faults – Windows ignores benign faults – Windows can’t automatically rebuild – All systems fail when disk hangs T = transient fault, S = sticky fault Slide 57
Example multiple-fault result • Scenario 1, Windows 2000 – note that reconstruction was initiated manually Slide 58
Multi-fault results • Linux Slide 59
Multi-fault results (2) • Windows 2000 • Solaris Slide 60
- Slides: 60