
Automatic System Management using Unsupervised Machine Leaning Xiaohui



- Slides: 53
Automatic System Management using Unsupervised Machine Leaning Xiaohui (Helen) Gu North Carolina State University 1
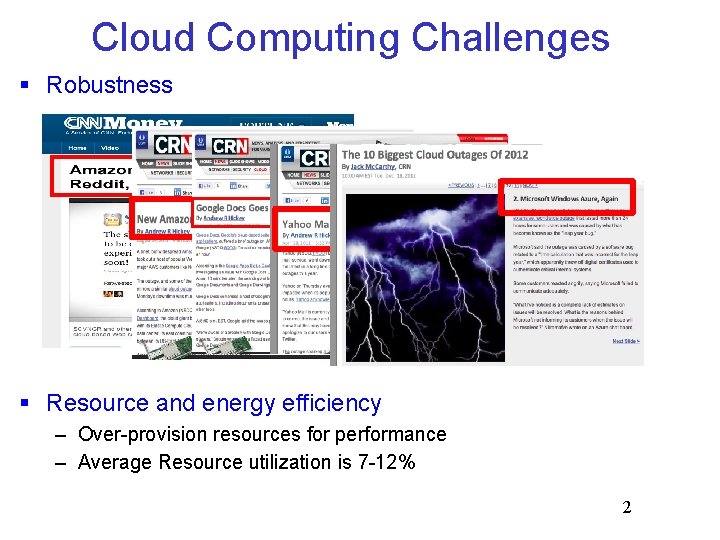
Cloud Computing Challenges § Robustness § Resource and energy efficiency – Over-provision resources for performance – Average Resource utilization is 7 -12% 2
Major Research Projects § Online system anomaly management – [SRDS’ 16, TPDS’ 15, ICAC’ 15, IC 2 E’ 15, SOCC’ 14, Hot. Cloud’ 14, USENIX ATC’ 14, ICDCS’ 13, ICDCS’ 12 (best paper award), ICAC’ 12, TPDS’ 12, SLAML’ 11, SRDS’ 11, PODC’ 10, MACOTS’ 10, ICAC’ 09, ICDE’ 09] – Sponsored by NSF, ARO, IBM, Google § Resource and energy efficient cloud computing – [ICAC’ 13, SOCC’ 11, SOSP’ 11 (poster), CNSM’ 10 (best paper award), MASCOTS’ 10 (best paper nominee), HPDC’ 10, SOSP’ 09 (poster), IWQo. S’ 09] – Sponsored by NSF CSR, two Google research awards, two IBM faculty awards § Security monitoring for cloud and mobile devices – [ACM CSUR’ 16, CODESPY’ 14, TPDS’ 13, IWQo. S’ 11, ASIACCS’ 10, CCS’ 10 (poster), ACSAC’ 09, STC’ 09] – Sponsored by NSA and ARO 3
Cloud Computing Challenges § Robustness § Resource and energy efficiency § Accountability 4
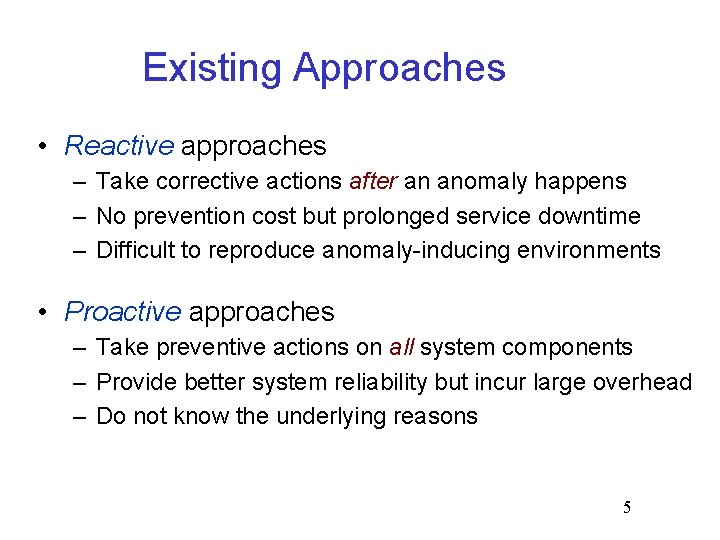
Existing Approaches • Reactive approaches – Take corrective actions after an anomaly happens – No prevention cost but prolonged service downtime – Difficult to reproduce anomaly-inducing environments • Proactive approaches – Take preventive actions on all system components – Provide better system reliability but incur large overhead – Do not know the underlying reasons 5
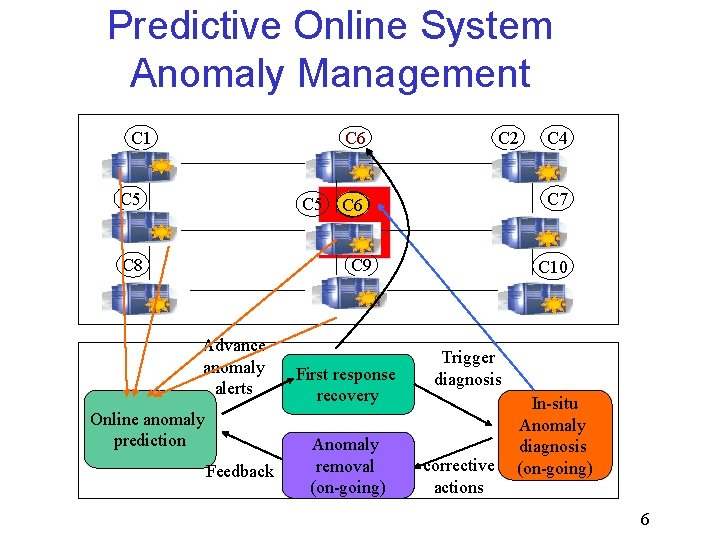
Predictive Online System Anomaly Management C 6 C 1 C 5 C 8 C 2 C 7 C 6 C 9 Advance anomaly alerts Online anomaly prediction Feedback First response recovery Anomaly removal (on-going) C 4 C 10 Trigger diagnosis corrective actions In-situ Anomaly diagnosis (on-going) 6
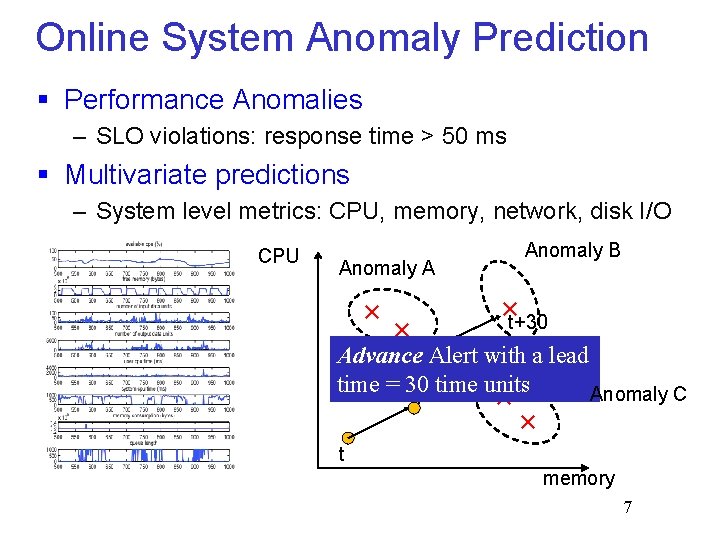
Online System Anomaly Prediction § Performance Anomalies – SLO violations: response time > 50 ms § Multivariate predictions – System level metrics: CPU, memory, network, disk I/O CPU Anomaly B Anomaly A × × ×t+30 t+20 Advance Alert with a lead time = 30 time units t+10 Anomaly C × × t memory 7
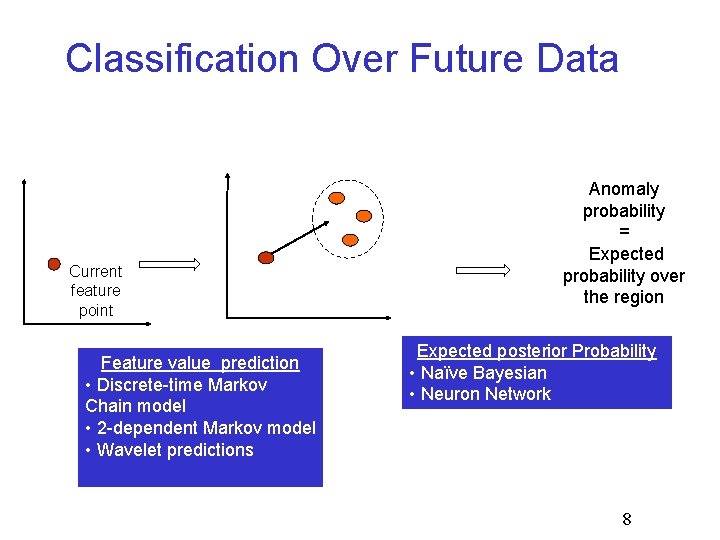
Classification Over Future Data Current feature point Feature value prediction • Discrete-time Markov Chain model • 2 -dependent Markov model • Wavelet predictions Anomaly probability = Expected probability over the region Expected posterior Probability • Naïve Bayesian • Neuron Network 8
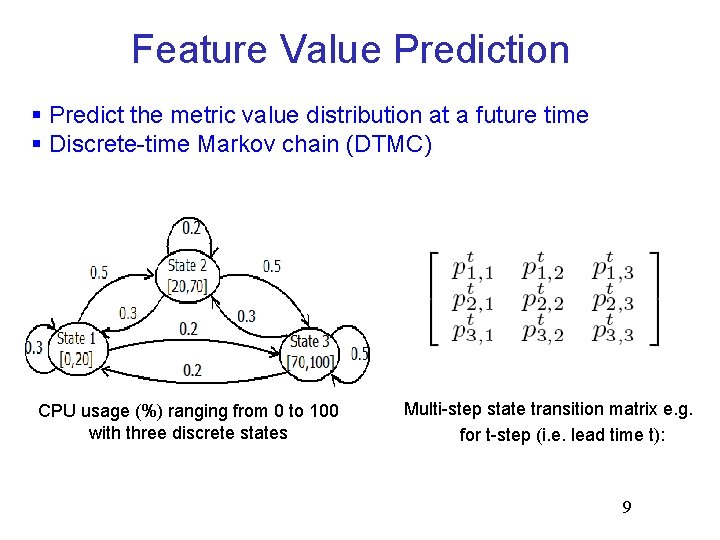
Feature Value Prediction § Predict the metric value distribution at a future time § Discrete-time Markov chain (DTMC) CPU usage (%) ranging from 0 to 100 with three discrete states Multi-step state transition matrix e. g. for t-step (i. e. lead time t): 9
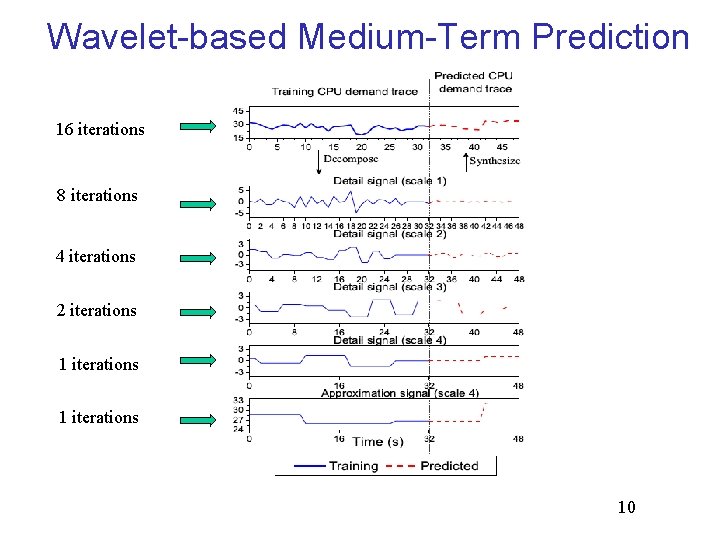
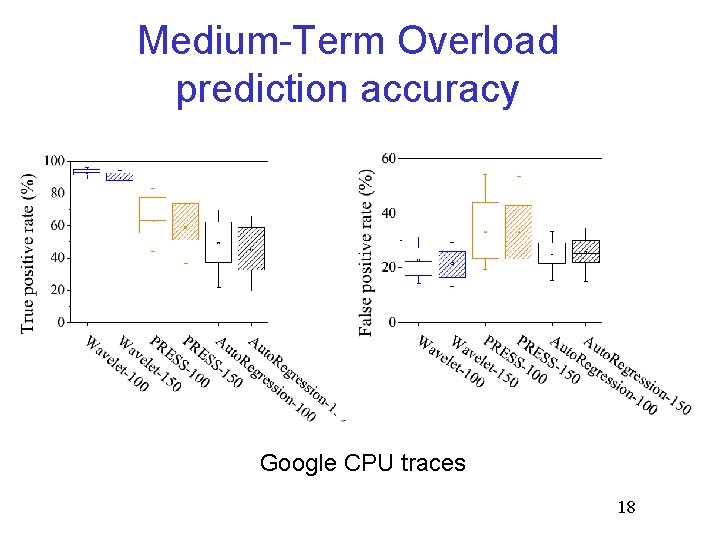
Wavelet-based Medium-Term Prediction 16 iterations 8 iterations 4 iterations 2 iterations 10
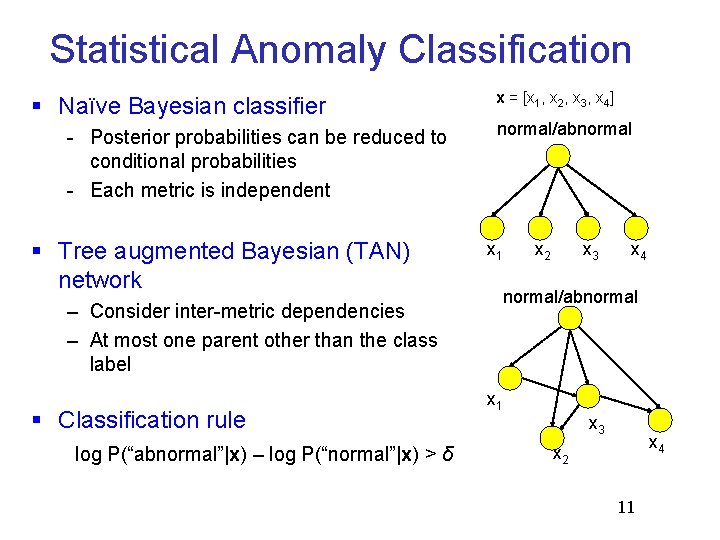
Statistical Anomaly Classification § Naïve Bayesian classifier - Posterior probabilities can be reduced to conditional probabilities - Each metric is independent § Tree augmented Bayesian (TAN) network – Consider inter-metric dependencies – At most one parent other than the class label § Classification rule log P(“abnormal”|x) – log P(“normal”|x) > δ x = [x 1, x 2, x 3, x 4] normal/abnormal x 1 x 2 x 3 x 4 normal/abnormal x 1 x 3 x 4 x 2 11
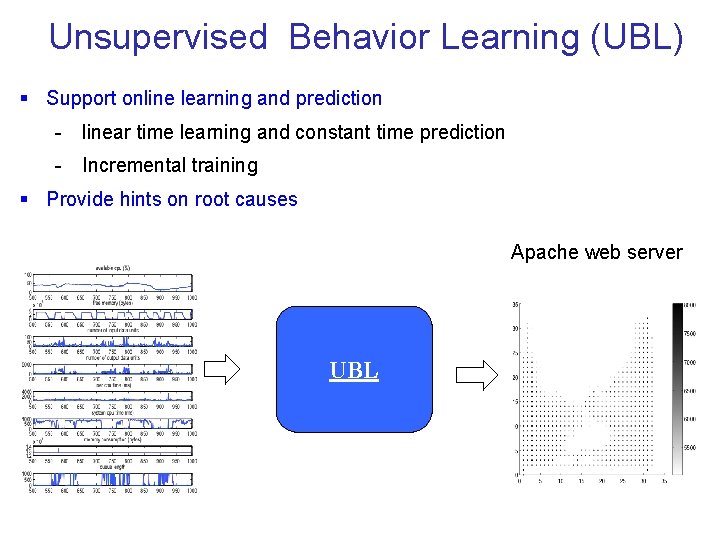
Unsupervised Behavior Learning (UBL) § Support online learning and prediction - linear time learning and constant time prediction - Incremental training § Provide hints on root causes Apache web server UBL
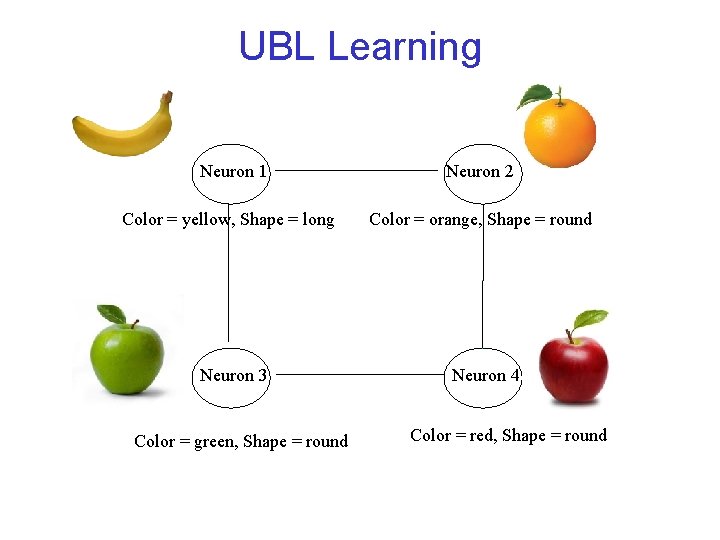
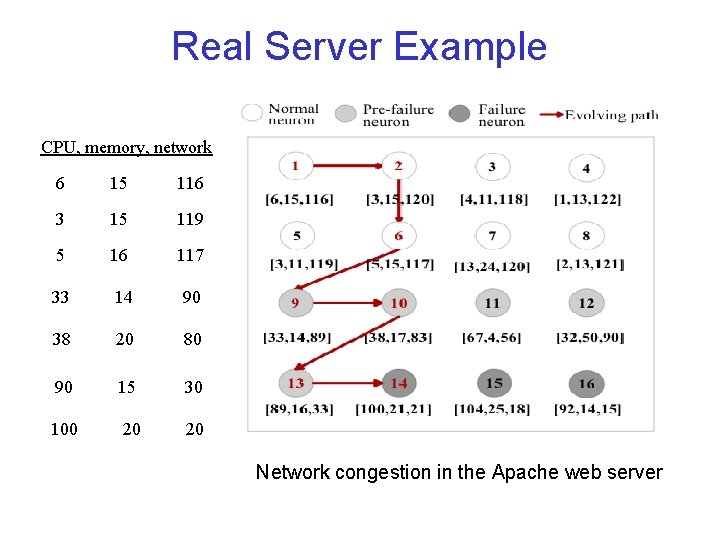
UBL Learning Neuron 1 Color = yellow, Shape = long Neuron 3 Color = green, Shape = round Neuron 2 Color = orange, Shape = round Neuron 4 Color = red, Shape = round
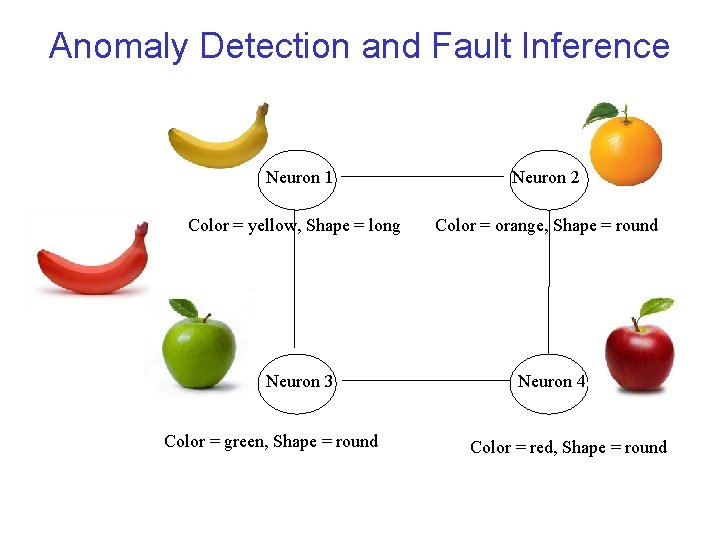
Anomaly Detection and Fault Inference Neuron 1 Color = yellow, Shape = long Neuron 3 Color = green, Shape = round Neuron 2 Color = orange, Shape = round Neuron 4 Color = red, Shape = round
Real Server Example CPU, memory, network 6 15 116 3 15 119 5 16 117 33 14 90 38 20 80 90 15 30 100 20 20 Network congestion in the Apache web server
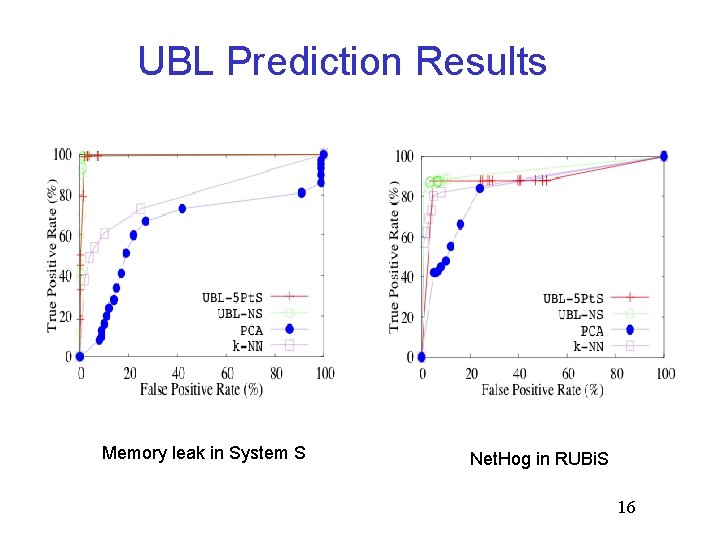
UBL Prediction Results Memory leak in System S Net. Hog in RUBi. S 16
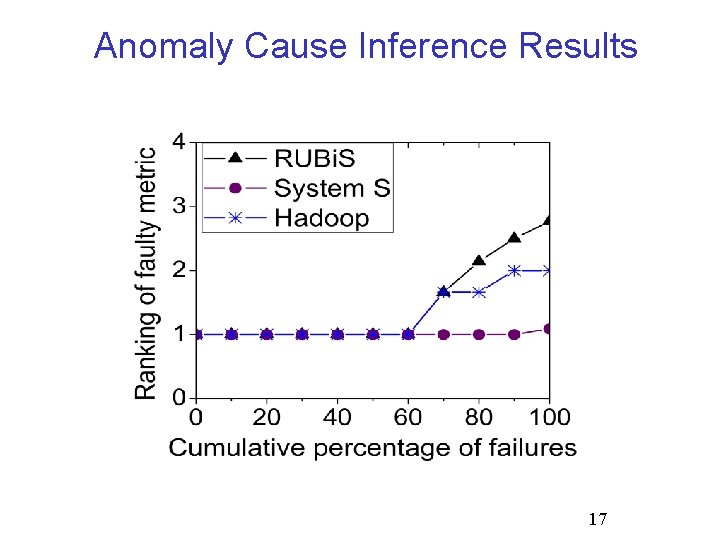
Anomaly Cause Inference Results 17
Medium-Term Overload prediction accuracy Google CPU traces 18
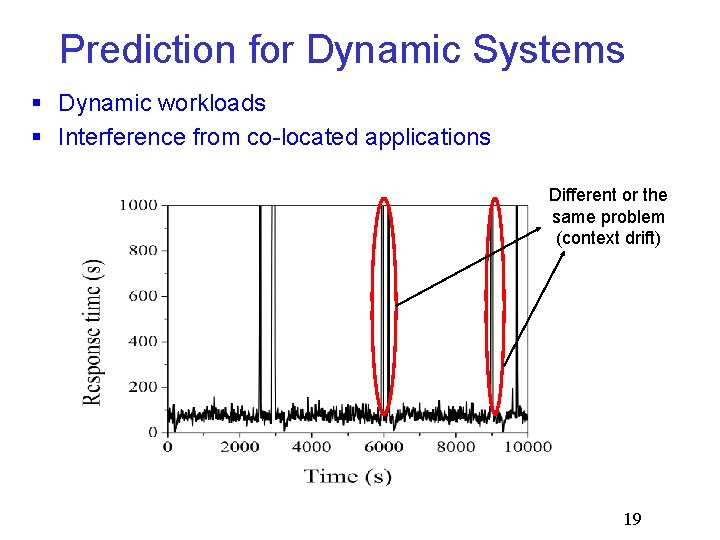
Prediction for Dynamic Systems § Dynamic workloads § Interference from co-located applications Different or the same problem (context drift) 19
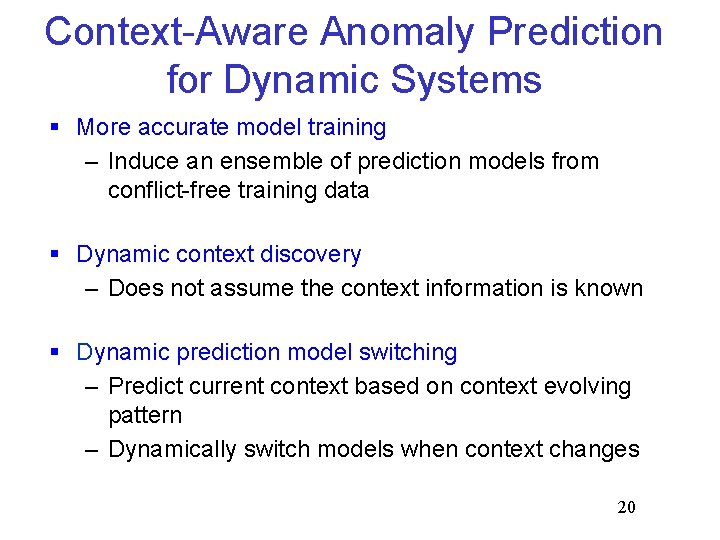
Context-Aware Anomaly Prediction for Dynamic Systems § More accurate model training – Induce an ensemble of prediction models from conflict-free training data § Dynamic context discovery – Does not assume the context information is known § Dynamic prediction model switching – Predict current context based on context evolving pattern – Dynamically switch models when context changes 20
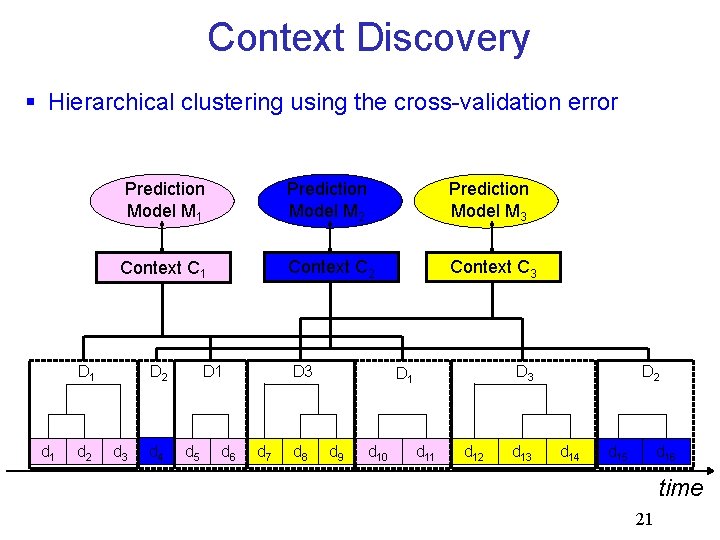
Context Discovery § Hierarchical clustering using the cross-validation error Prediction Model M 1 Prediction Model M 2 Prediction Model M 3 Context C 1 Context C 2 Context C 3 D 1 d 2 D 2 d 3 d 4 D 1 d 5 d 6 D 3 d 7 d 8 D 3 D 1 d 9 d 10 d 11 d 12 d 13 D 2 d 14 d 15 d 16 time 21
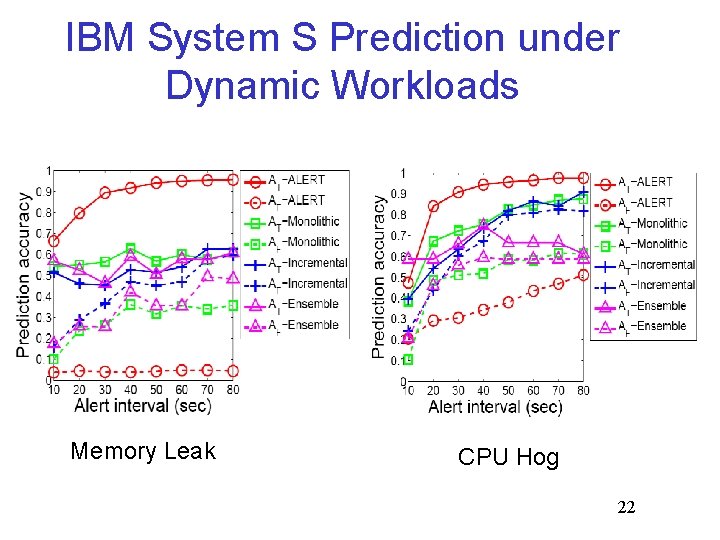
IBM System S Prediction under Dynamic Workloads Memory Leak CPU Hog 22
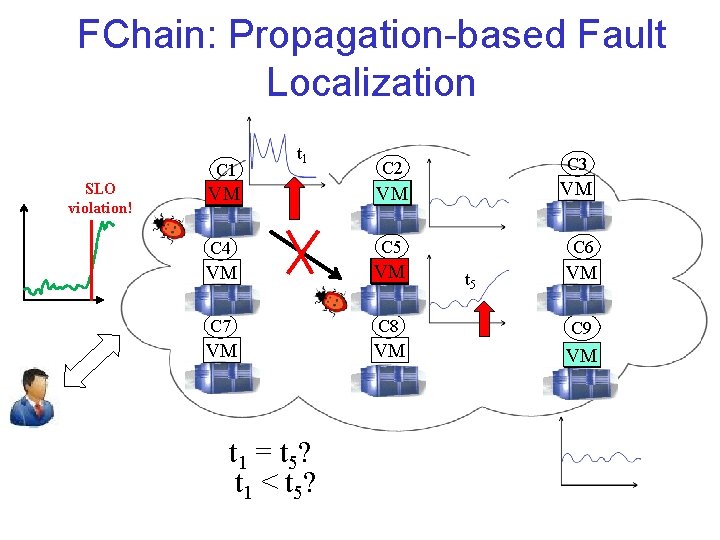
FChain: Propagation-based Fault Localization SLO violation! C 1 t 1 C 3 C 2 VM VM VM C 4 C 5 VM VM C 7 C 8 C 9 VM VM VM t 1 = t 5? t 1 < t 5? C 6 t 5 VM
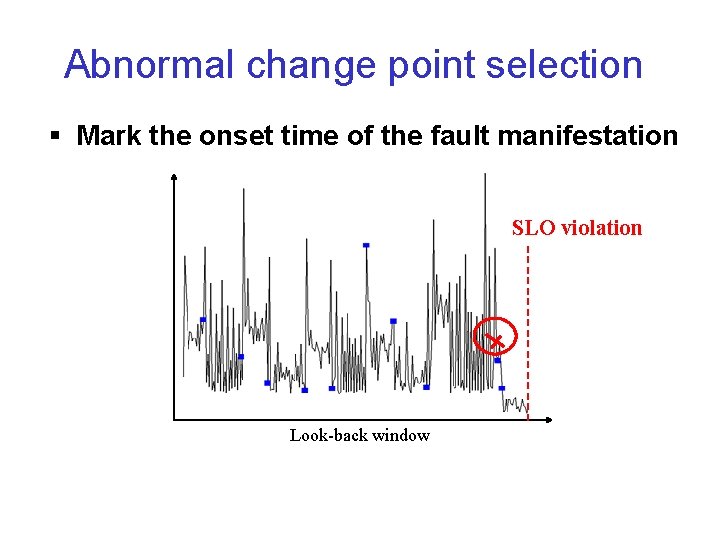
Abnormal change point selection § Mark the onset time of the fault manifestation SLO violation Look-back window
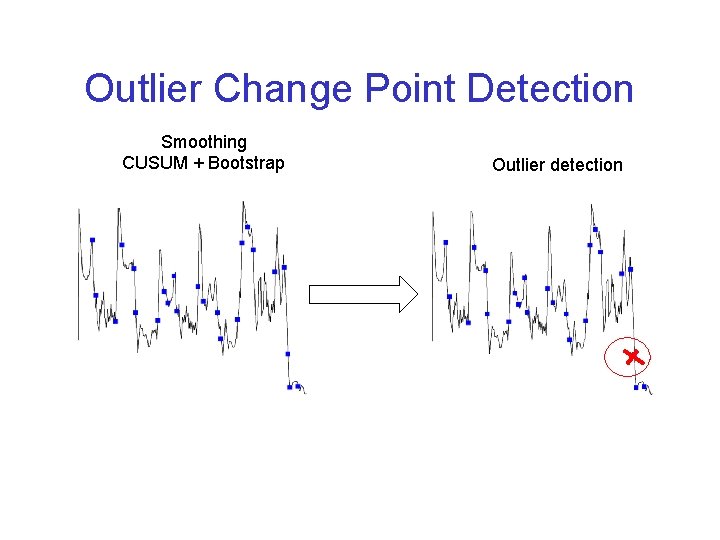
Outlier Change Point Detection Smoothing CUSUM + Bootstrap Outlier detection
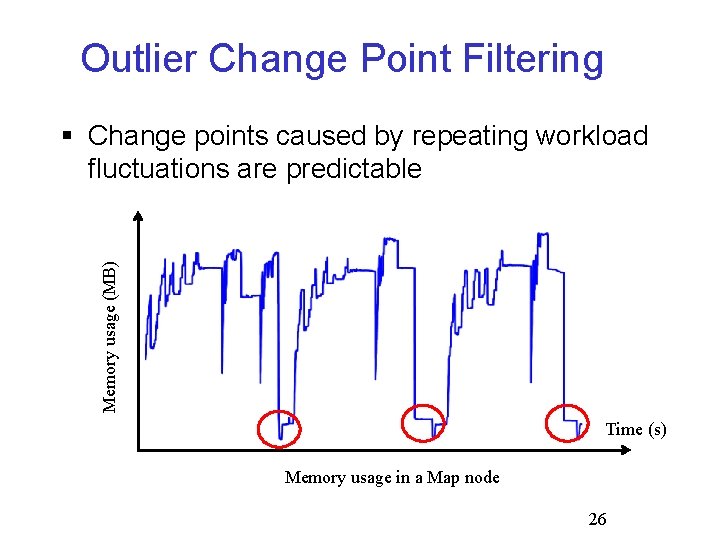
Outlier Change Point Filtering Memory usage (MB) § Change points caused by repeating workload fluctuations are predictable Time (s) Memory usage in a Map node 26
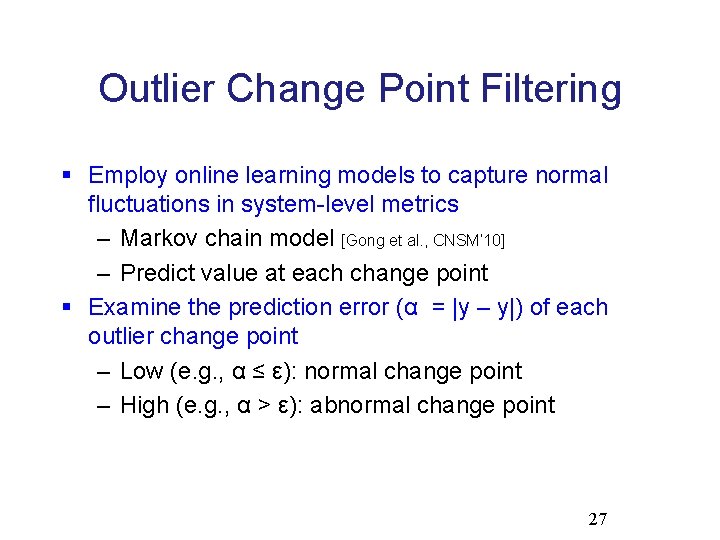
Outlier Change Point Filtering § Employ online learning models to capture normal fluctuations in system-level metrics – Markov chain model [Gong et al. , CNSM’ 10] – Predict value at each change point § Examine the prediction error (α = |y – y|) of each outlier change point – Low (e. g. , α ≤ ε): normal change point – High (e. g. , α > ε): abnormal change point 27
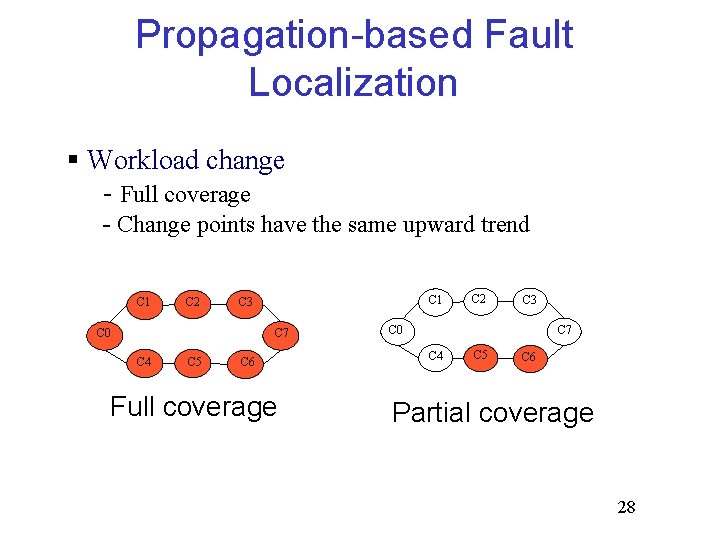
Propagation-based Fault Localization § Workload change - Full coverage - Change points have the same upward trend C 1 C 2 C 1 C 3 C 7 C 0 C 4 C 5 C 6 Full coverage C 2 C 3 C 0 C 7 C 4 C 5 C 6 Partial coverage 28
Faulty Component Pinpointing Results 29
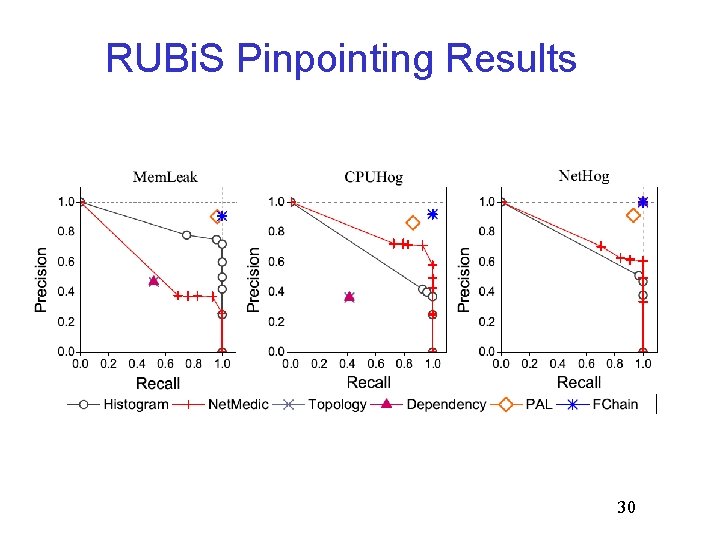
RUBi. S Pinpointing Results 30
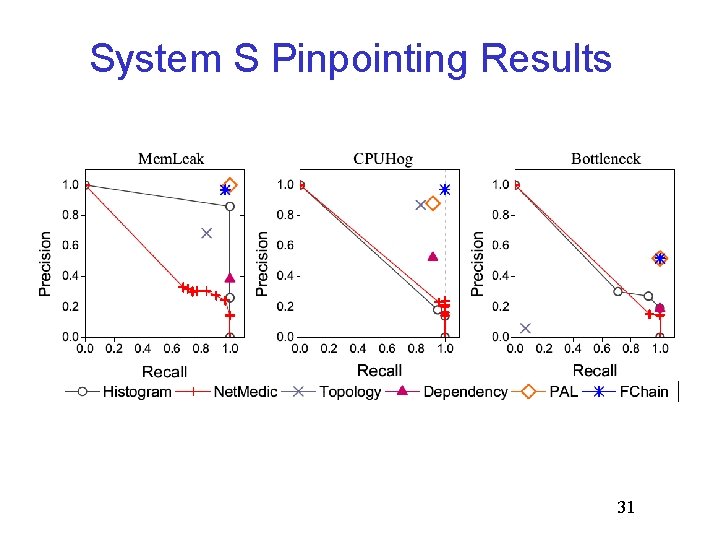
System S Pinpointing Results 31
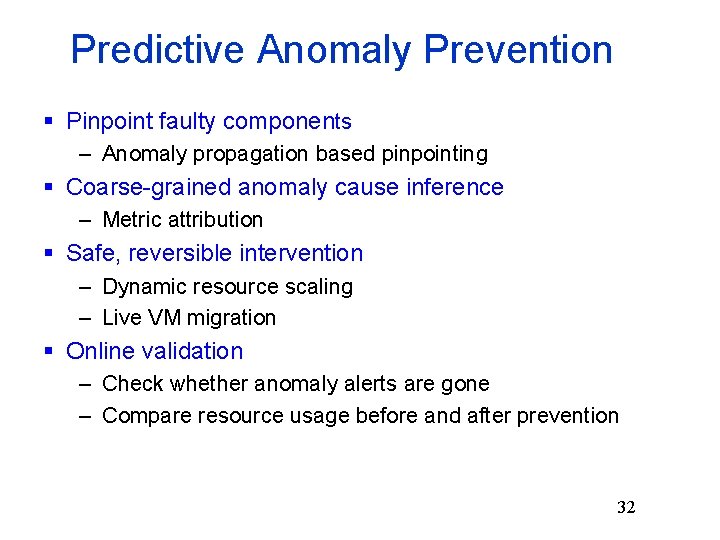
Predictive Anomaly Prevention § Pinpoint faulty components – Anomaly propagation based pinpointing § Coarse-grained anomaly cause inference – Metric attribution § Safe, reversible intervention – Dynamic resource scaling – Live VM migration § Online validation – Check whether anomaly alerts are gone – Compare resource usage before and after prevention 32
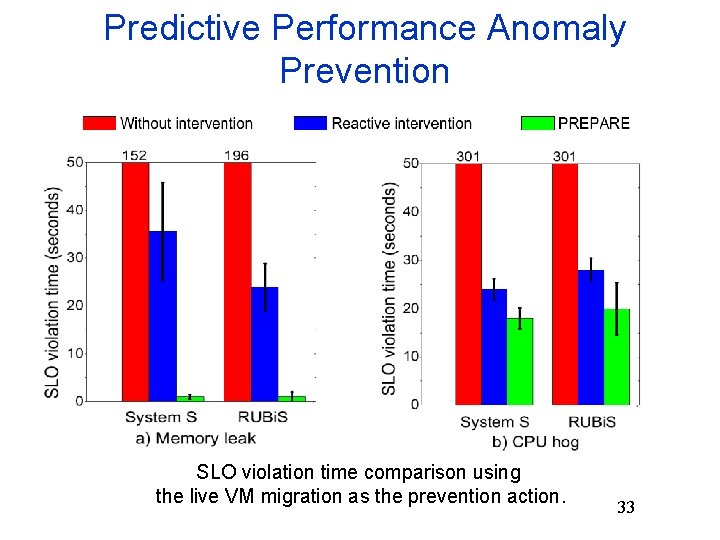
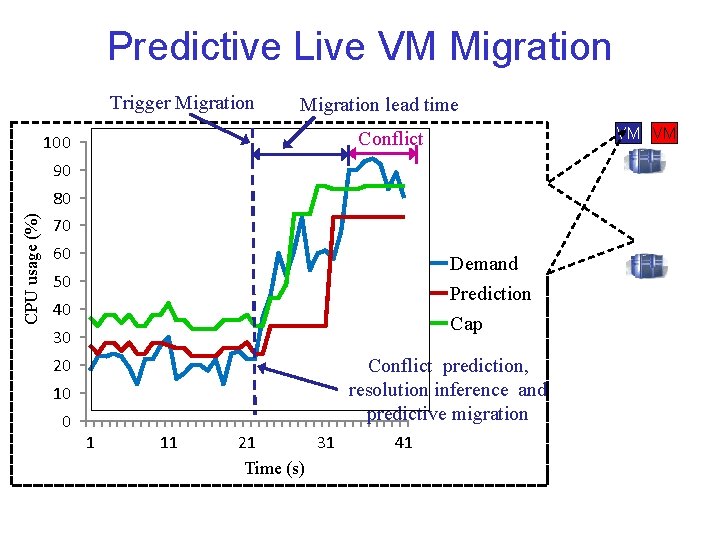
Predictive Performance Anomaly Prevention SLO violation time comparison using the live VM migration as the prevention action. 33
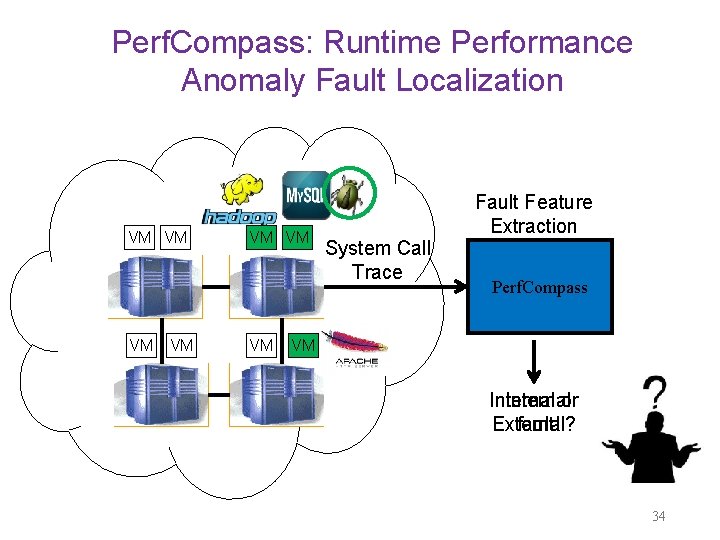
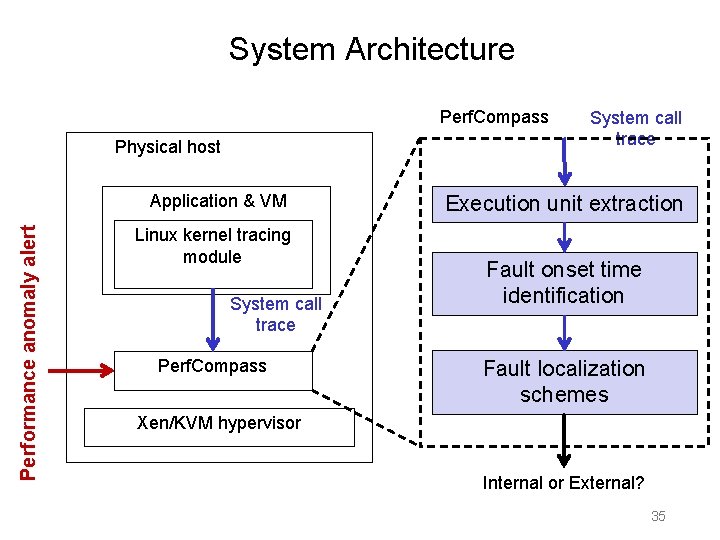
Perf. Compass: Runtime Performance Anomaly Fault Localization VM VM System Call Trace Fault Feature Extraction Perf. Compass VM Internal or External? fault! 34
System Architecture Perf. Compass Physical host Performance anomaly alert Application & VM Linux kernel tracing module System call trace Perf. Compass System call trace Execution unit extraction Fault onset time identification Fault localization schemes Xen/KVM hypervisor Internal or External? 35
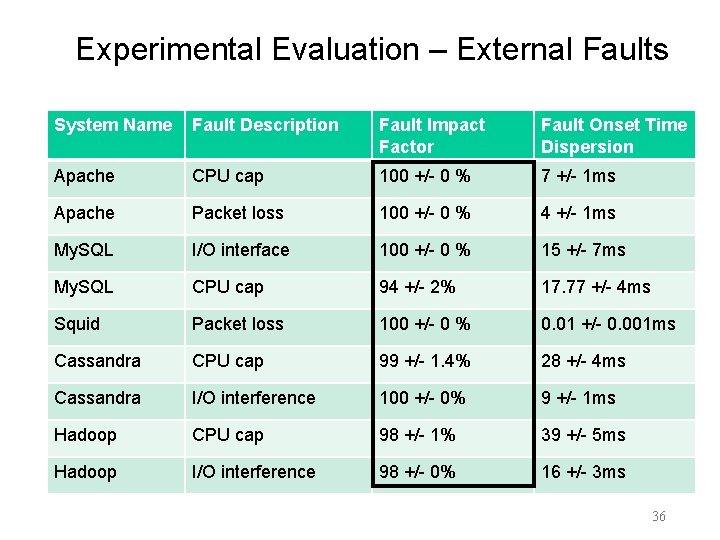
Experimental Evaluation – External Faults System Name Fault Description Fault Impact Factor Fault Onset Time Dispersion Apache CPU cap 100 +/- 0 % 7 +/- 1 ms Apache Packet loss 100 +/- 0 % 4 +/- 1 ms My. SQL I/O interface 100 +/- 0 % 15 +/- 7 ms My. SQL CPU cap 94 +/- 2% 17. 77 +/- 4 ms Squid Packet loss 100 +/- 0 % 0. 01 +/- 0. 001 ms Cassandra CPU cap 99 +/- 1. 4% 28 +/- 4 ms Cassandra I/O interference 100 +/- 0% 9 +/- 1 ms Hadoop CPU cap 98 +/- 1% 39 +/- 5 ms Hadoop I/O interference 98 +/- 0% 16 +/- 3 ms 36
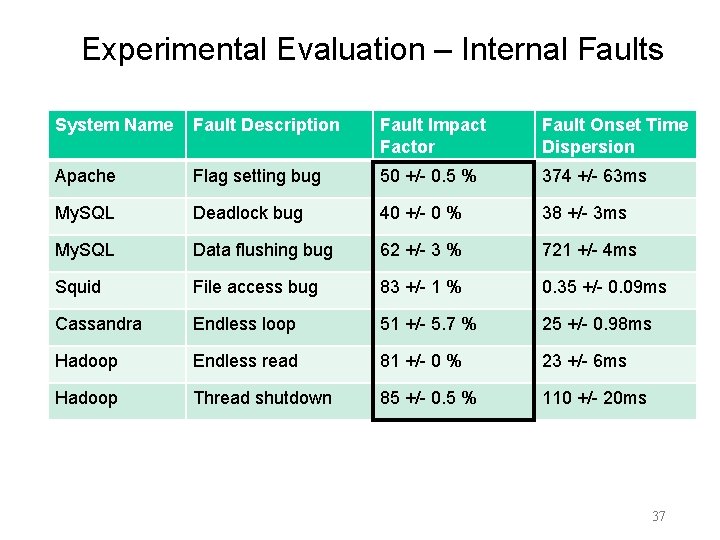
Experimental Evaluation – Internal Faults System Name Fault Description Fault Impact Factor Fault Onset Time Dispersion Apache Flag setting bug 50 +/- 0. 5 % 374 +/- 63 ms My. SQL Deadlock bug 40 +/- 0 % 38 +/- 3 ms My. SQL Data flushing bug 62 +/- 3 % 721 +/- 4 ms Squid File access bug 83 +/- 1 % 0. 35 +/- 0. 09 ms Cassandra Endless loop 51 +/- 5. 7 % 25 +/- 0. 98 ms Hadoop Endless read 81 +/- 0 % 23 +/- 6 ms Hadoop Thread shutdown 85 +/- 0. 5 % 110 +/- 20 ms 37
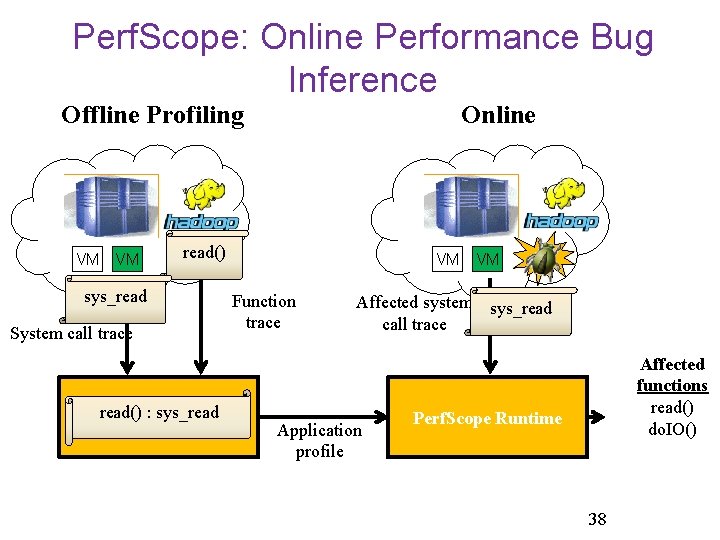
Perf. Scope: Online Performance Bug Inference Offline Profiling VM VM Online read() sys_read System call trace Perf. Scope read() : sys_read Offline VM VM Function trace Affected system sys_read call trace Application profile Affected functions read() do. IO() Perf. Scope Runtime 38
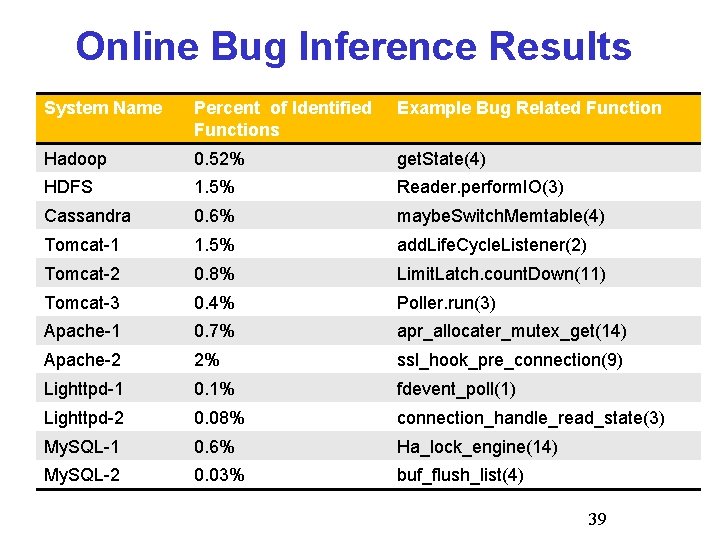
Online Bug Inference Results System Name Percent of Identified Functions Example Bug Related Function Hadoop 0. 52% get. State(4) HDFS 1. 5% Reader. perform. IO(3) Cassandra 0. 6% maybe. Switch. Memtable(4) Tomcat-1 1. 5% add. Life. Cycle. Listener(2) Tomcat-2 0. 8% Limit. Latch. count. Down(11) Tomcat-3 0. 4% Poller. run(3) Apache-1 0. 7% apr_allocater_mutex_get(14) Apache-2 2% ssl_hook_pre_connection(9) Lighttpd-1 0. 1% fdevent_poll(1) Lighttpd-2 0. 08% connection_handle_read_state(3) My. SQL-1 0. 6% Ha_lock_engine(14) My. SQL-2 0. 03% buf_flush_list(4) 39
Cloud Computing Challenges § Robustness § Resource and energy efficiency § Accountability 40
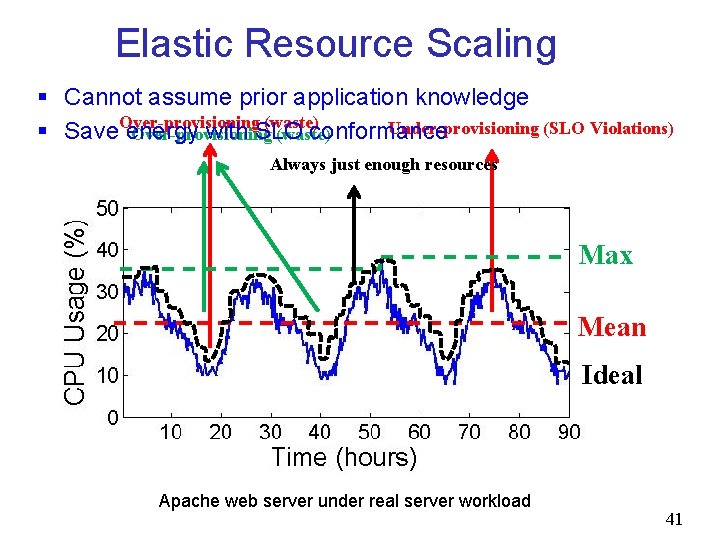
Elastic Resource Scaling § Cannot assume prior application knowledge (waste) Under-provisioning (SLO Violations) § Save. Over-provisioning energy with SLO conformance Over-provisioning (waste) Always just enough resources Max Mean Ideal Apache web server under real server workload 41
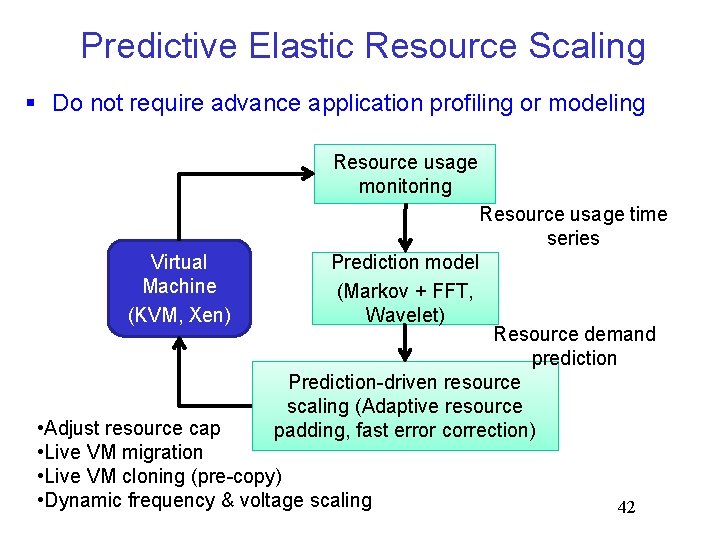
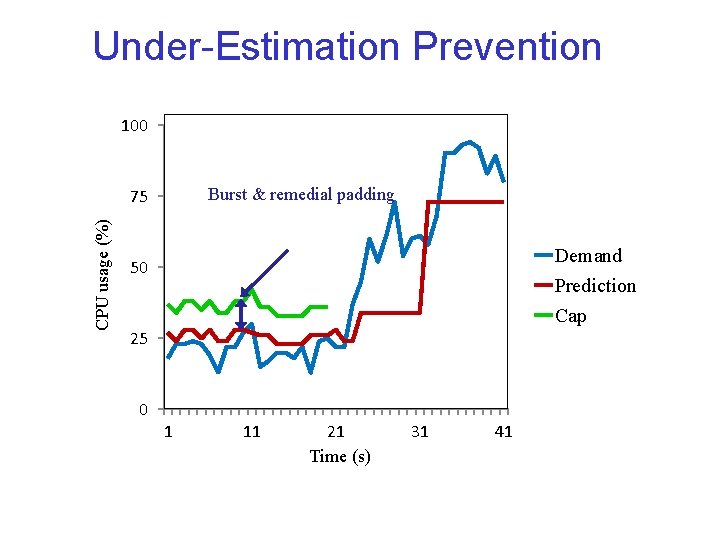
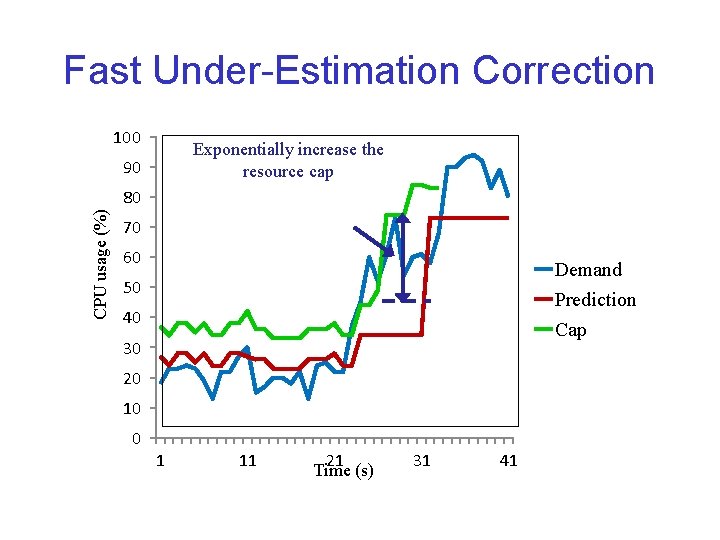
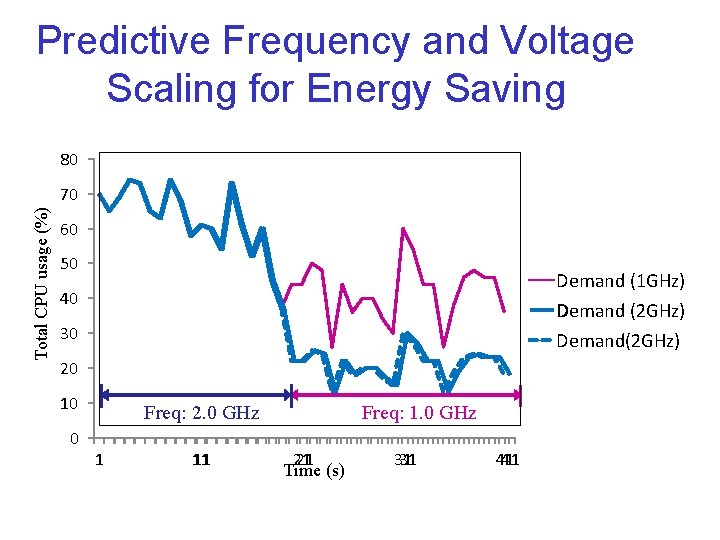
Predictive Elastic Resource Scaling § Do not require advance application profiling or modeling Resource usage monitoring Virtual Machine (KVM, Xen) Resource usage time series Prediction model (Markov + FFT, Wavelet) Resource demand prediction Prediction-driven resource scaling (Adaptive resource padding, fast error correction) • Adjust resource cap • Live VM migration • Live VM cloning (pre-copy) • Dynamic frequency & voltage scaling 42
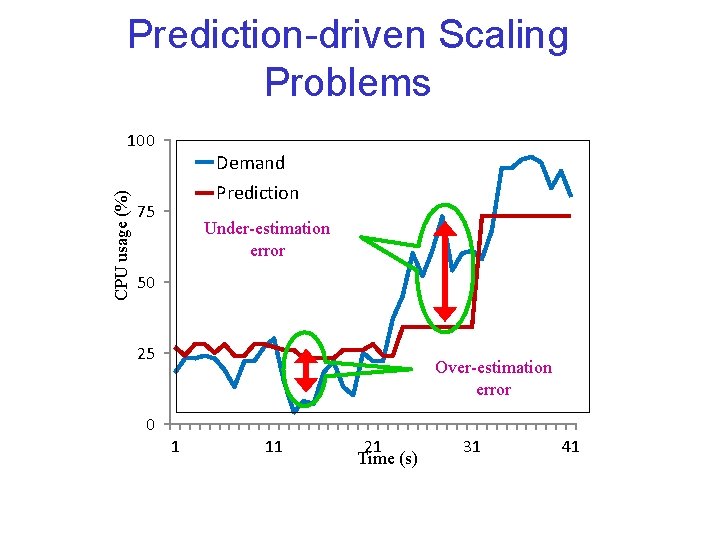
Prediction-driven Scaling Problems CPU usage (%) 100 Demand Prediction 75 Under-estimation error 50 25 0 Over-estimation error 1 11 21 Time (s) 31 41
Under-Estimation Prevention 100 Burst & remedial padding CPU usage (%) 75 Demand 50 Prediction Cap 25 0 1 11 21 Time (s) 31 41
Fast Under-Estimation Correction 100 Exponentially increase the resource cap 90 CPU usage (%) 80 70 60 Demand Prediction Cap 50 40 30 20 10 0 1 11 21 Time (s) 31 41
Predictive Frequency and Voltage Scaling for Energy Saving 80 Total CPU usage (%) 70 60 50 Demand (1 GHz) Demand (2 GHz) Demand(2 GHz) 40 30 20 10 0 Freq: 2. 0 GHz 1 11 Freq: 1. 0 GHz 21 21 Time (s) 31 31 41 41
Predictive Live VM Migration Trigger Migration lead time VM VM Conflict 100 90 CPU usage (%) 80 70 60 Demand Prediction Cap 50 40 30 20 Conflict prediction, resolution inference and predictive migration 10 0 1 11 21 31 Time (s) 41
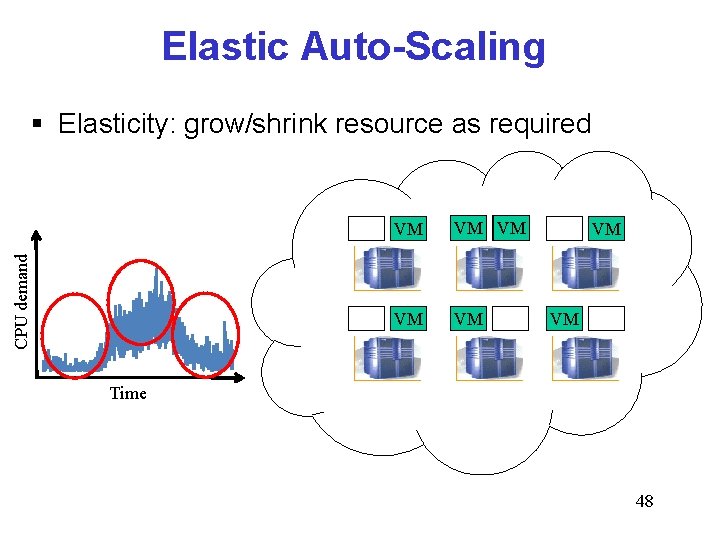
Elastic Auto-Scaling CPU demand § Elasticity: grow/shrink resource as required VM VM Time 48
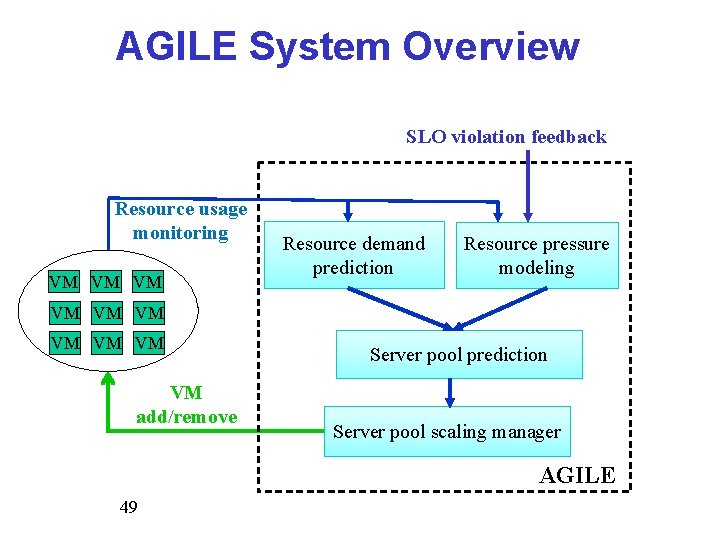
AGILE System Overview SLO violation feedback Resource usage monitoring VM VM VM Resource demand prediction Resource pressure modeling VM VM add/remove Server pool prediction Server pool scaling manager AGILE 49
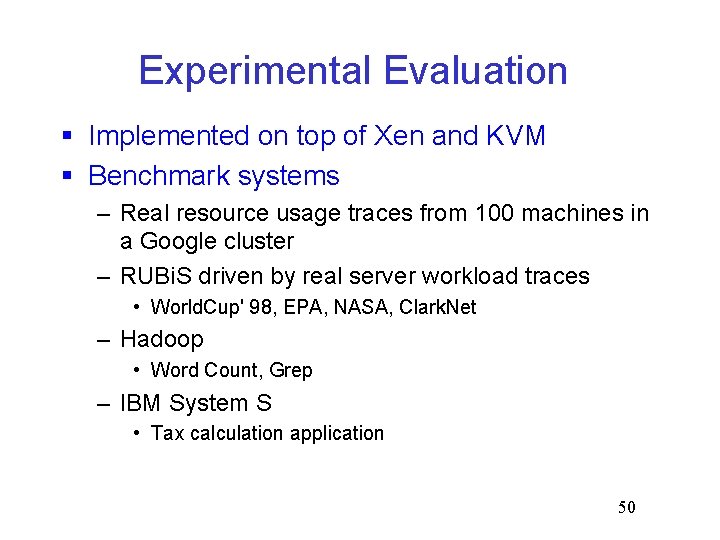
Experimental Evaluation § Implemented on top of Xen and KVM § Benchmark systems – Real resource usage traces from 100 machines in a Google cluster – RUBi. S driven by real server workload traces • World. Cup' 98, EPA, NASA, Clark. Net – Hadoop • Word Count, Grep – IBM System S • Tax calculation application 50
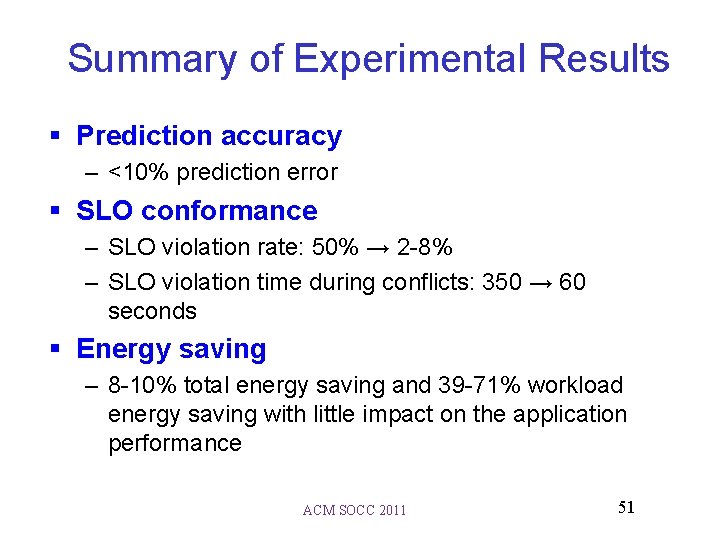
Summary of Experimental Results § Prediction accuracy – <10% prediction error § SLO conformance – SLO violation rate: 50% → 2 -8% – SLO violation time during conflicts: 350 → 60 seconds § Energy saving – 8 -10% total energy saving and 39 -71% workload energy saving with little impact on the application performance ACM SOCC 2011 51
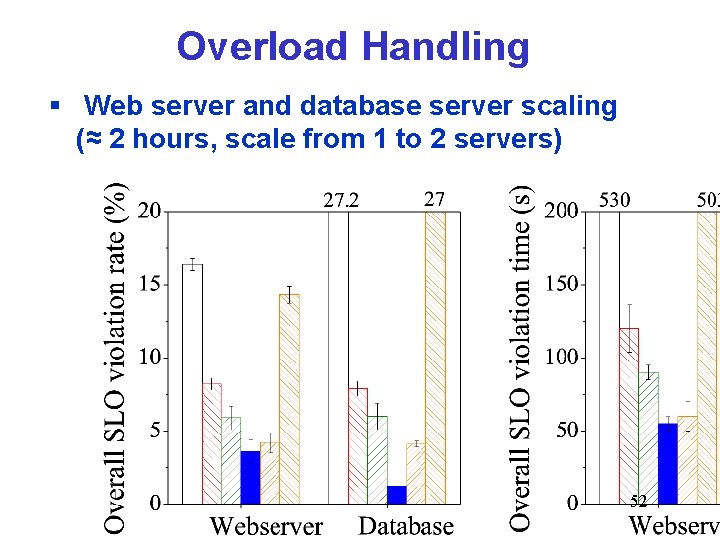
Overload Handling § Web server and database server scaling (≈ 2 hours, scale from 1 to 2 servers) 52
Overload handling § Web server: during scaling 53