Automatic Performance Diagnosis and Tuning in Oracle 10


- Slides: 37


Automatic Performance Diagnosis and Tuning in Oracle 10 g Graham Wood Graham. Wood@oracle. com Oracle Corporation

Agenda Ÿ Problem Definition Ÿ Tuning Goal: Database Time Ÿ Workload Repository Ÿ ADDM: Performance Tuning Ÿ Conclusion

Problem Definition Performance Diagnosis & Tuning is complex Ÿ Needs in-depth knowledge of database internals Ÿ Lack of good performance metric to compare database components Ÿ Data capture too expensive, too high level requiring workload reply Ÿ Misguided tuning efforts waste time & money

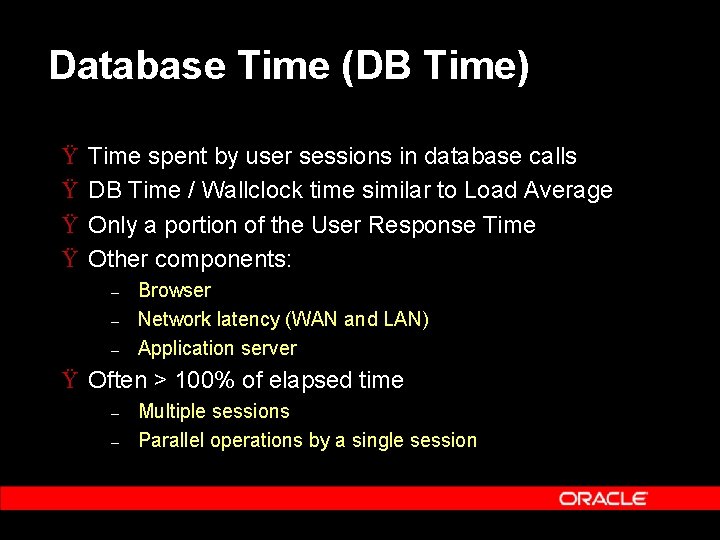
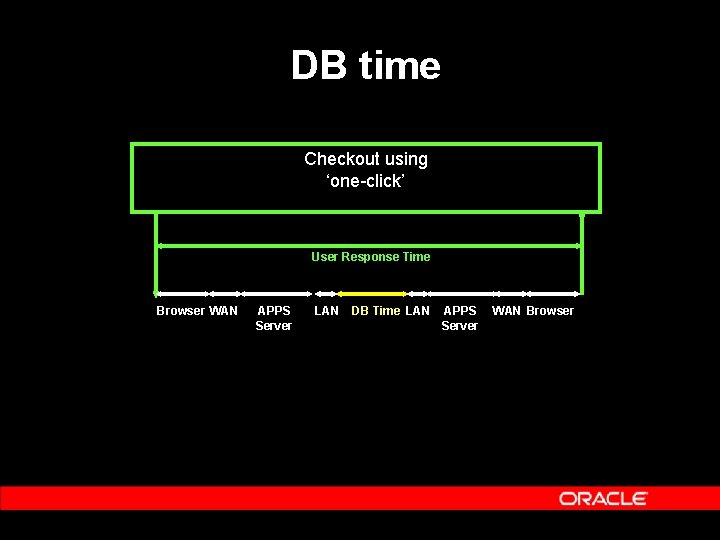
Database Time (DB Time) Ÿ Ÿ Time spent by user sessions in database calls DB Time / Wallclock time similar to Load Average Only a portion of the User Response Time Other components: – – – Browser Network latency (WAN and LAN) Application server Ÿ Often > 100% of elapsed time – – Multiple sessions Parallel operations by a single session

DB time Checkout using ‘one-click’ User Response Time Browser WAN APPS Server LAN DB Time LAN APPS Server WAN Browser

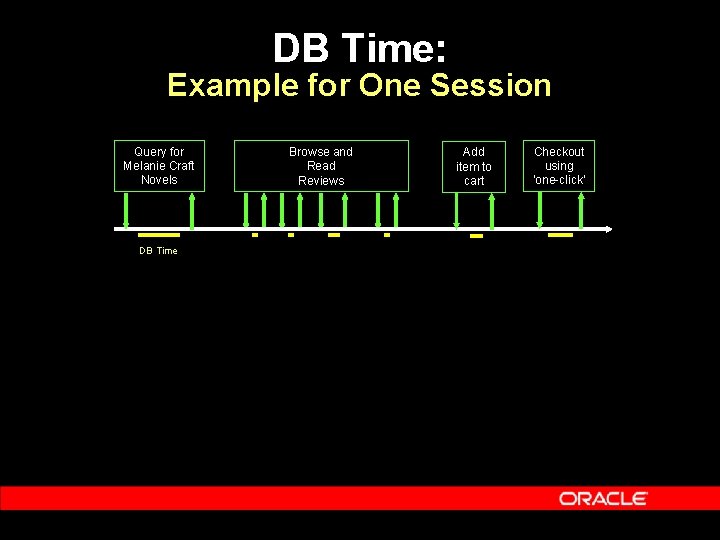
DB Time: Example for One Session Query for Melanie Craft Novels DB Time Browse and Read Reviews Add item to cart Checkout using ‘one-click’

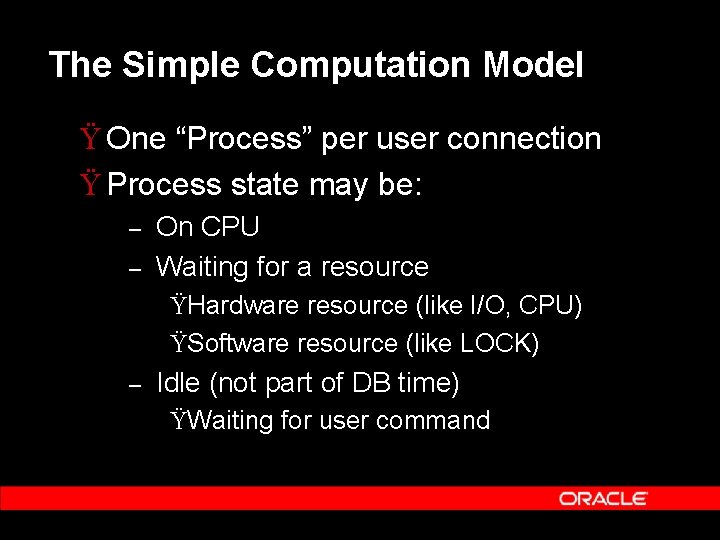
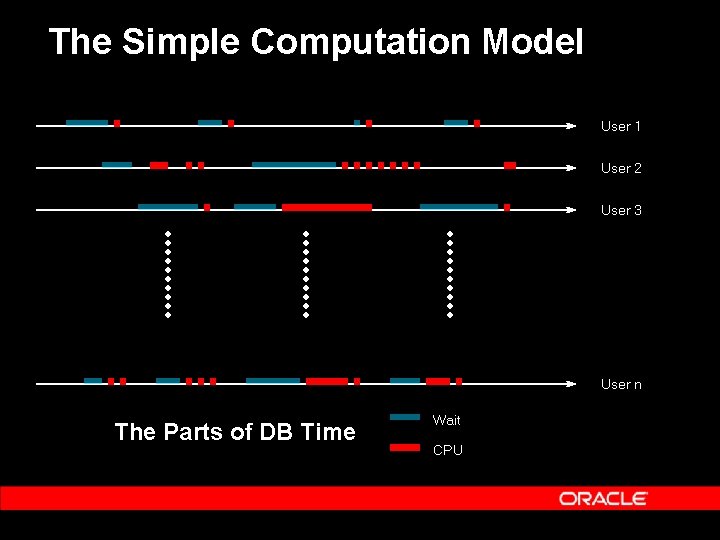
The Simple Computation Model Ÿ One “Process” per user connection Ÿ Process state may be: – – On CPU Waiting for a resource ŸHardware resource (like I/O, CPU) ŸSoftware resource (like LOCK) – Idle (not part of DB time) ŸWaiting for user command

The Simple Computation Model User 1 User 2 User 3 User n The Parts of DB Time Wait CPU

DB Time: Common Currency Ÿ Measurement of work done by the server while users are waiting for results Ÿ Each database component is analyzed using its contribution to database time. Ÿ Tuning goal – reduce DB time

Agenda Ÿ Problem Definition Ÿ Tuning Goal – Database Time Ÿ Workload Repository Ÿ ADDM: Performance Tuning Ÿ Conclusion

Automatic Workload Repository (AWR) Ÿ Data to quantify the impact (in database time) of various database components Ÿ Data to find root cause and suggest remedies. Ÿ Gather data all the time so we can give “first occurrence” analysis Ÿ Non-intrusive, lightweight

How AWR Works Ÿ System instrumented to provide all needed statistics Ÿ Data captured by hourly snapshots out-of-the-box. Ÿ Data is stored in tables called “the workload repository” Ÿ Most data is cumulative so can compare any pair of snapshots

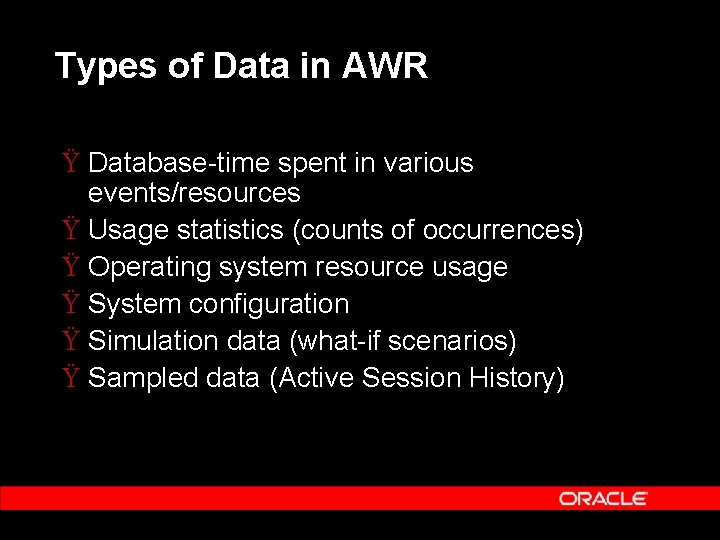
Types of Data in AWR Ÿ Database-time spent in various events/resources Ÿ Usage statistics (counts of occurrences) Ÿ Operating system resource usage Ÿ System configuration Ÿ Simulation data (what-if scenarios) Ÿ Sampled data (Active Session History)

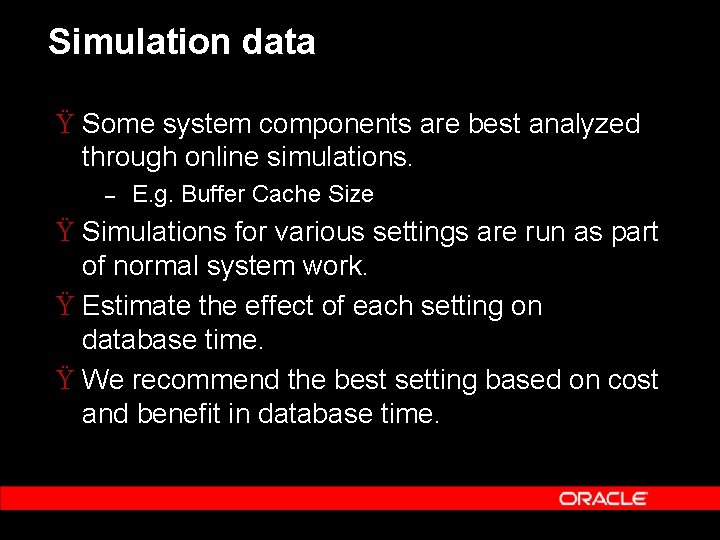
Simulation data Ÿ Some system components are best analyzed through online simulations. – E. g. Buffer Cache Size Ÿ Simulations for various settings are run as part of normal system work. Ÿ Estimate the effect of each setting on database time. Ÿ We recommend the best setting based on cost and benefit in database time.

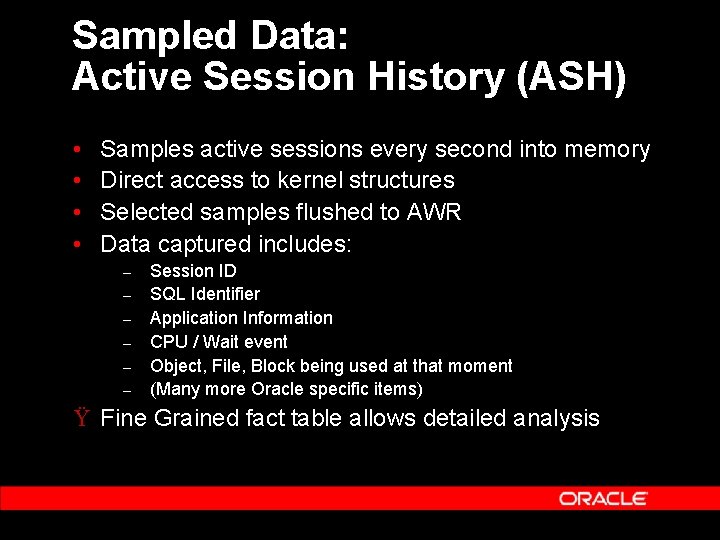
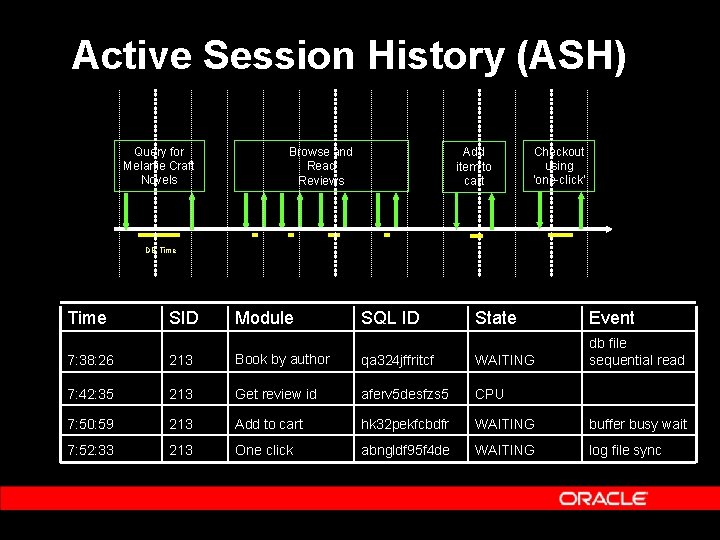
Sampled Data: Active Session History (ASH) • • Samples active sessions every second into memory Direct access to kernel structures Selected samples flushed to AWR Data captured includes: – – – Session ID SQL Identifier Application Information CPU / Wait event Object, File, Block being used at that moment (Many more Oracle specific items) Ÿ Fine Grained fact table allows detailed analysis

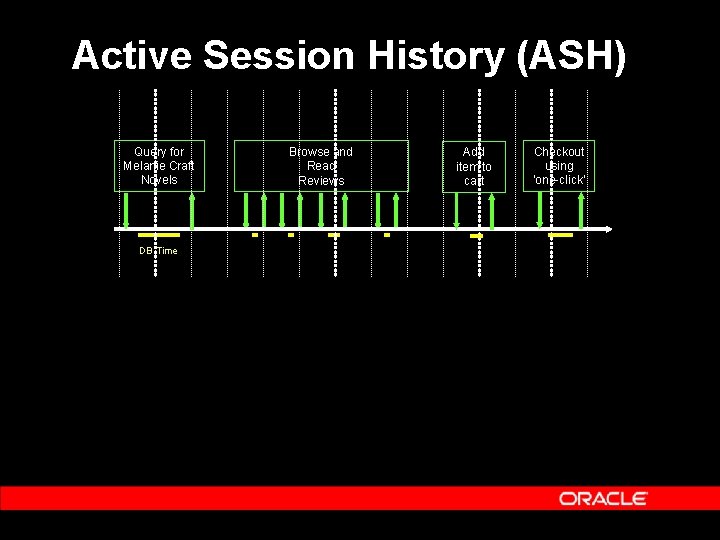
Active Session History (ASH) Query for Melanie Craft Novels DB Time Browse and Read Reviews Add item to cart Checkout using ‘one-click’

Active Session History (ASH) Query for Melanie Craft Novels Browse and Read Reviews Add item to cart Checkout using ‘one-click’ DB Time SID Module 7: 38: 26 213 Book by author 7: 42: 35 213 7: 50: 59 7: 52: 33 SQL ID State Event qa 324 jffritcf WAITING db file sequential read Get review id aferv 5 desfzs 5 CPU 213 Add to cart hk 32 pekfcbdfr WAITING buffer busy wait 213 One click abngldf 95 f 4 de WAITING log file sync

Agenda Ÿ Problem Definition Ÿ Tuning Goal – Database Time Ÿ Workload Repository Ÿ ADDM: Performance Tuning Ÿ Conclusion

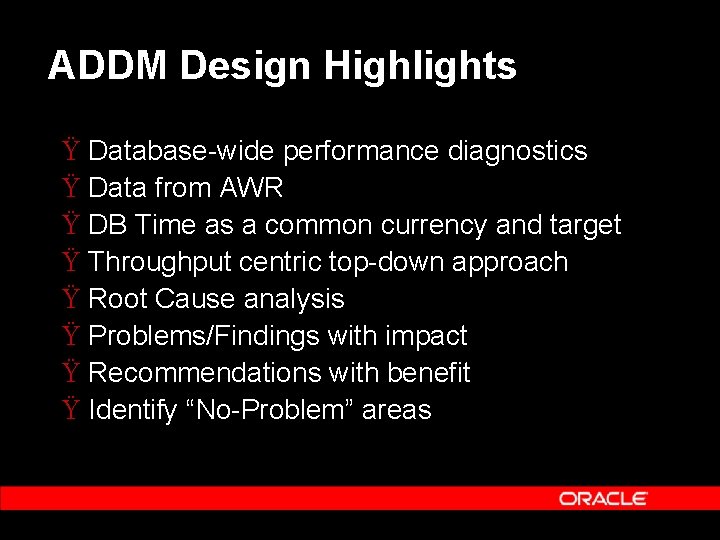
ADDM Design Highlights Ÿ Database-wide performance diagnostics Ÿ Data from AWR Ÿ DB Time as a common currency and target Ÿ Throughput centric top-down approach Ÿ Root Cause analysis Ÿ Problems/Findings with impact Ÿ Recommendations with benefit Ÿ Identify “No-Problem” areas

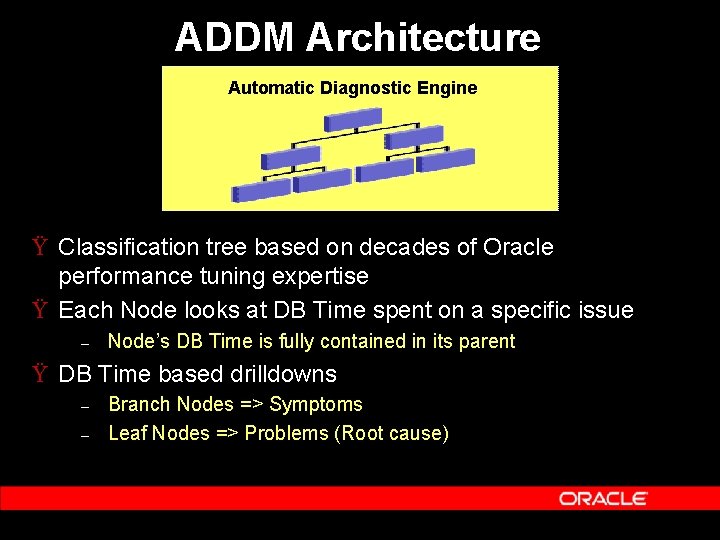
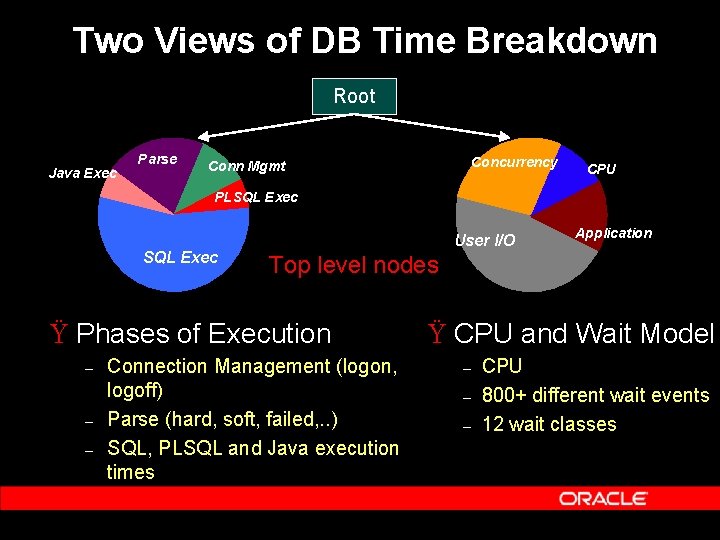
ADDM Architecture Automatic Diagnostic Engine Ÿ Classification tree based on decades of Oracle performance tuning expertise Ÿ Each Node looks at DB Time spent on a specific issue – Node’s DB Time is fully contained in its parent Ÿ DB Time based drilldowns – – Branch Nodes => Symptoms Leaf Nodes => Problems (Root cause)

Two Views of DB Time Breakdown Root Java Exec Parse Concurrency Conn Mgmt CPU PLSQL Exec User I/O Top level nodes Ÿ Phases of Execution – – – Application Connection Management (logon, logoff) Parse (hard, soft, failed, . . ) SQL, PLSQL and Java execution times Ÿ CPU and Wait Model – – – CPU 800+ different wait events 12 wait classes

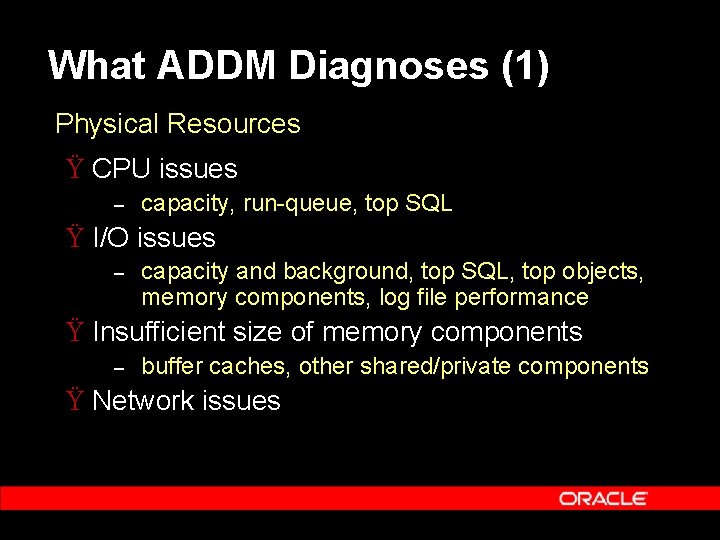
What ADDM Diagnoses (1) Physical Resources Ÿ CPU issues – capacity, run-queue, top SQL Ÿ I/O issues – capacity and background, top SQL, top objects, memory components, log file performance Ÿ Insufficient size of memory components – buffer caches, other shared/private components Ÿ Network issues

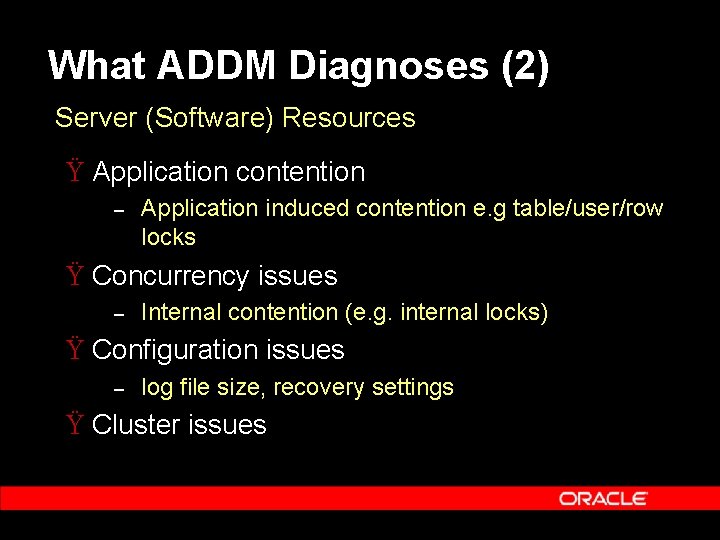
What ADDM Diagnoses (2) Server (Software) Resources Ÿ Application contention – Application induced contention e. g table/user/row locks Ÿ Concurrency issues – Internal contention (e. g. internal locks) Ÿ Configuration issues – log file size, recovery settings Ÿ Cluster issues

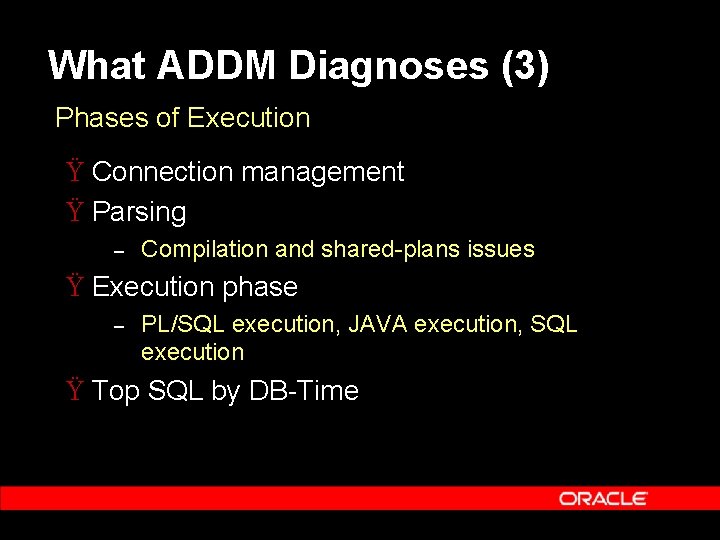
What ADDM Diagnoses (3) Phases of Execution Ÿ Connection management Ÿ Parsing – Compilation and shared-plans issues Ÿ Execution phase – PL/SQL execution, JAVA execution, SQL execution Ÿ Top SQL by DB-Time

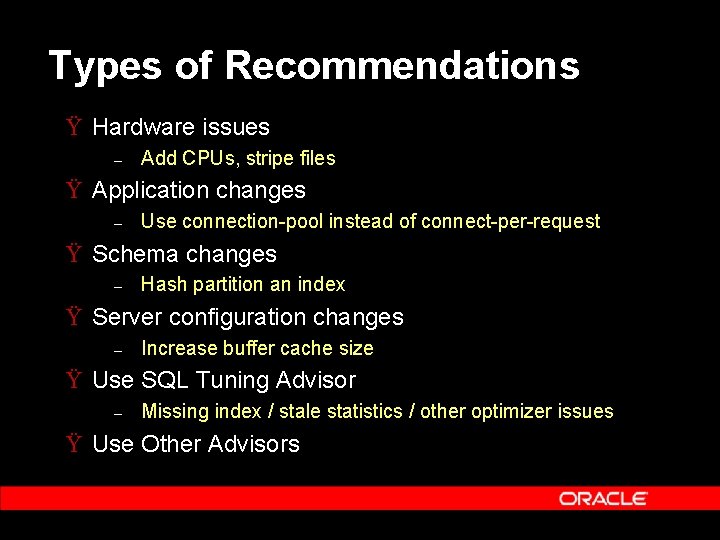
Types of Recommendations Ÿ Hardware issues – Add CPUs, stripe files Ÿ Application changes – Use connection-pool instead of connect-per-request Ÿ Schema changes – Hash partition an index Ÿ Server configuration changes – Increase buffer cache size Ÿ Use SQL Tuning Advisor – Missing index / stale statistics / other optimizer issues Ÿ Use Other Advisors

Agenda Ÿ Problem Definition Ÿ Tuning Goal – Database Time Ÿ Performance Tuning: ADDM Ÿ The Workload Repository Ÿ More Complex Models Ÿ Conclusion

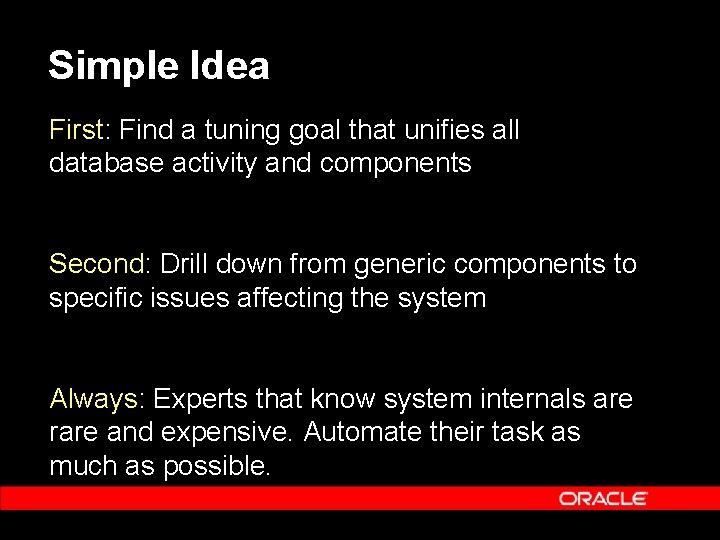
Simple Idea First: Find a tuning goal that unifies all database activity and components Second: Drill down from generic components to specific issues affecting the system Always: Experts that know system internals are rare and expensive. Automate their task as much as possible.

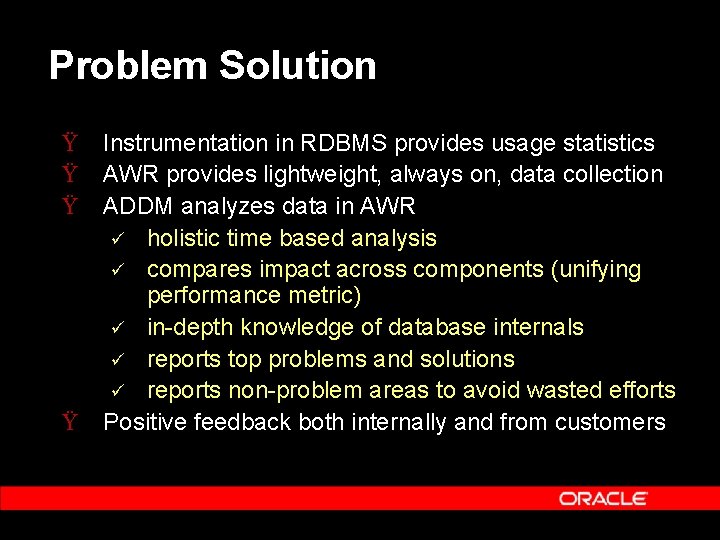
Problem Solution Ÿ Instrumentation in RDBMS provides usage statistics Ÿ AWR provides lightweight, always on, data collection Ÿ ADDM analyzes data in AWR ü holistic time based analysis ü compares impact across components (unifying performance metric) ü in-depth knowledge of database internals ü reports top problems and solutions ü reports non-problem areas to avoid wasted efforts Ÿ Positive feedback both internally and from customers

Q& A QUESTIONS ANSWERS

Contact Information For hiring questions and sending resumes: satarupa. bhattacharya@oracle. com For hiring to the manageability and diagnoseability groups: uri. shaft@oracle. com

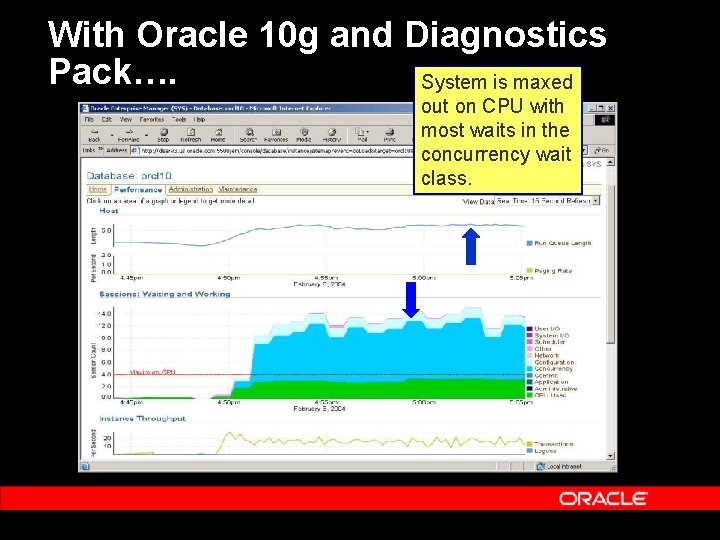
With Oracle 10 g and Diagnostics Pack…. System is maxed out on CPU with most waits in the concurrency wait class.

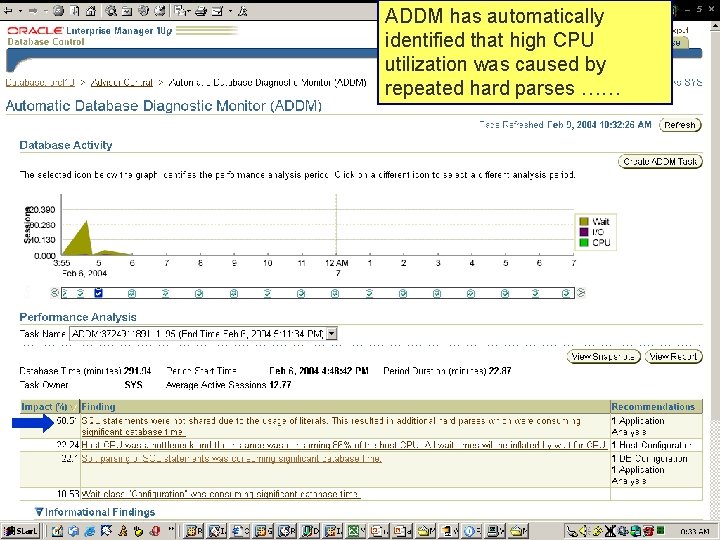
ADDM has automatically identified that high CPU utilization was caused by repeated hard parses …… ADDM Findings

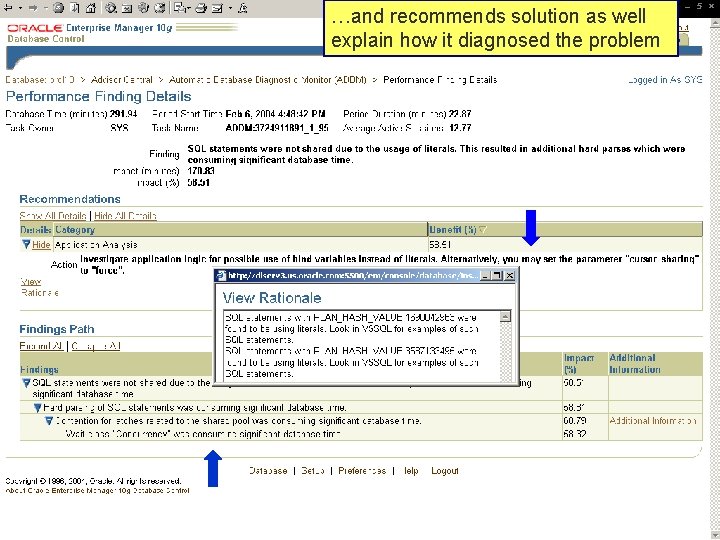
…and recommends solution as well explain how it diagnosed the problem ADDM Findings

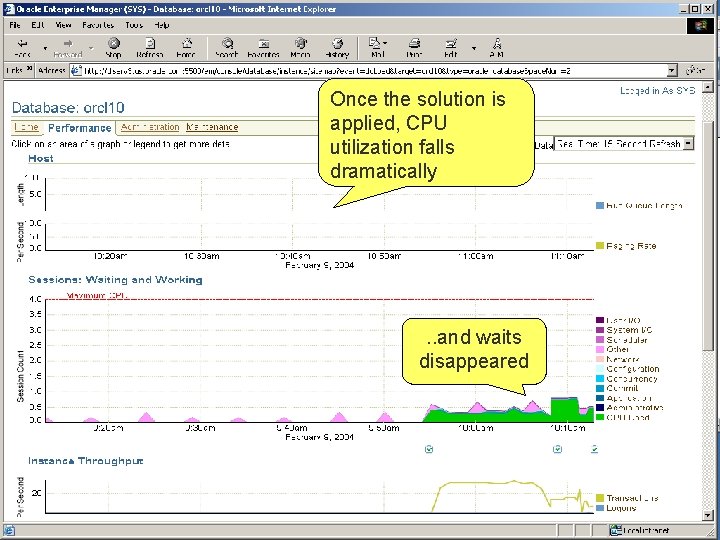
Good Performance Page Once the solution is applied, CPU utilization falls dramatically . . and waits disappeared

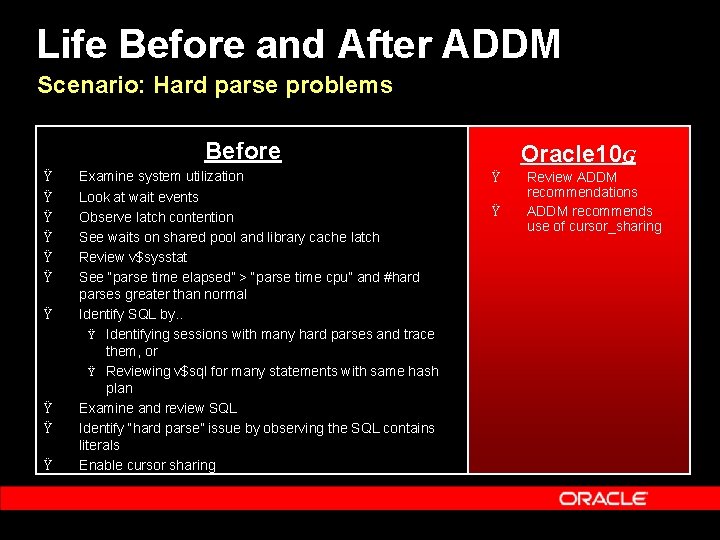
Life Before and After ADDM Scenario: Hard parse problems Before Ÿ Ÿ Ÿ Ÿ Ÿ Examine system utilization Look at wait events Observe latch contention See waits on shared pool and library cache latch Review v$sysstat See “parse time elapsed” > “parse time cpu” and #hard parses greater than normal Identify SQL by. . Ÿ Identifying sessions with many hard parses and trace them, or Ÿ Reviewing v$sql for many statements with same hash plan Examine and review SQL Identify “hard parse” issue by observing the SQL contains literals Enable cursor sharing Oracle 10 G Ÿ Ÿ Review ADDM recommendations ADDM recommends use of cursor_sharing

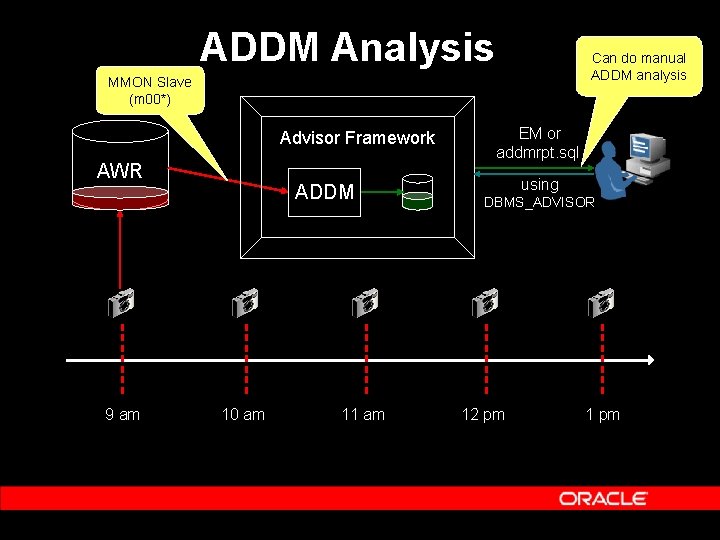
ADDM Analysis Can do manual ADDM analysis MMON Slave (m 00*) Advisor Framework AWR 9 am ADDM 10 am 11 am EM or addmrpt. sql using DBMS_ADVISOR 12 pm 1 pm