Automatic Generation Control AGC Power System Control Reactive
 Power System Control Reactive power and voltage control Automatic generation")
 System")


. •")

 v 25")


 Control setting power of each area needs to be adjusted")


- Slides: 36
Automatic Generation Control (AGC) Power System Control Reactive power and voltage control Automatic generation control Load frequency control 1
Outline v v v Purpose and Overview of AGC Automatic Generation Control (AGC) System modeling: control block diagram AGC for single generator AGC for 2 generators AGC for multi generators v Area Control Error (ACE) 2
Purpose of AGC To maintain power balance in the system. Make sure that operating limits are not exceeded: ◦ Generators limit ◦ Tie-lines limit Make sure that system frequency is constant (not change by load). 3
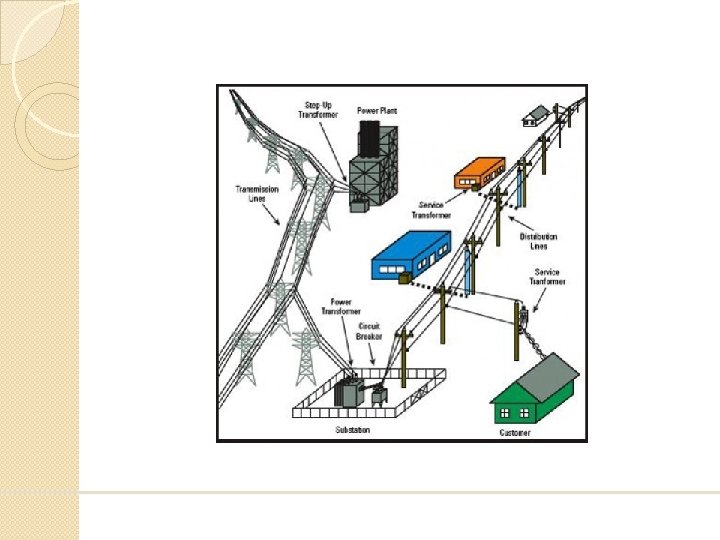
Electric energy cannot be stored in practical power system applications - Power lines do not store energy - Plate capacitors store electric energy • Not much, not for so long - Non-electric energy storage in power systems • Pump storage (potential energy) • Chemical capacitors, (chemical energy, batteries) • Flywheels, rotating masses of generators (kinetic energy) Electricity has to be generated the instant it is used Automatic control systems are necessary in all larger power systems
Overview of AGC Load is always changing. To maintain power balance, generators need to produce more or less to keep up with the load. When Gen < Load (Gen > Load), generator speed and frequency will drop (rise). => We use this generator speed and frequency as control signals! 5
A power system connected by AC lines and transformers constitutes a synchronous grid. There can only be one frequency in a synchronous grid. Analogies: - Trains – each wagon has to travel in the same speed - If one locomotive stops, the speed goes down • Until the other locomotive(s) have compensated • The stable speed will be lower (primary control) • Create speed increase – stop when satisfied (secondary control). The frequency of a large power system must be kept around the nominal value! Certain frequencies can harm important equipment in the power system. - Harmonic vibrations in turbine blades and shafts. - Heating of generators and transformers. Some loads might be disturbed.
3 Components of AGC Primary control: The objective of the primary control is to maintain the balance between generation and load In control theory, the primary control corresponds to a proportional controller (P controller). Immediate (automatic) action to sudden change of load. For example, reaction to frequency change. Secondary control: To bring tie-line flows to scheduled. Corrective actions are done by operators. Economic dispatch: ◦ Make sure that the units are scheduled in the most economical way. ◦ This presentation covers only primary and secondary control of AGC. 8
AGC for Single Area • • • System Modeling Single Generator Multi Generators, special case: two generators 9
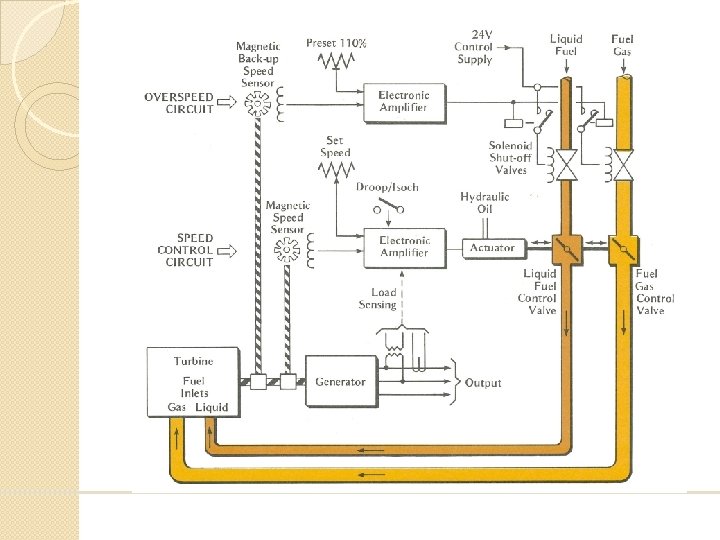
System Modeling: Turbine-Governor Model Small signal analysis model, relating mechanical power to the control power and the generator speed. + Where = Small change in control setting power = Small change in governor synchronous speed = Small change in mechanical output power = Regulation constant = Transfer function relating mechanical power to control signals 10
Speed-Power Relationship From synchronous turbine-governor: small signal analysis model, At steady state (s → 0, we have → 1), 12
Static Speed-Power Curve From, Slope = -R Primary control: Immediate change corresponding to sudden change of load (frequency) Secondary control: Change in setting control power to maintain operating frequency. The higher R (regulation), the better. 2 1 = = 13
Turbine and Generator Load Model Turbine Model Generator load model + 14
AGC for Single Generator closed loop power control system as below. + + 15
AGC for Multi Generators Consider effect of ◦ power flows in transmission lines, and ◦ loads at each bus to mechanical power of each generator. This analysis assumes that every bus is a generator bus. 16
Power Balance Equation at Each Bus At each bus, G 1 G 2 Where = Generator i power = Load power at bus i = Power flow from bus i Consider small changes, G 3 17
AGC for Multi Generators: Block Diagram Change in tie-line power flow + + - - 18
AGC for 2 -Generator: Block Diagram + + - - + -1 - - 19
AGC for 2 -Generator: Static Speed-Power Curve Load increases. Frequency drops. Steady state is reached when frequency of both generators is the same. 2 1 + = Change in total load 20
Simpler to only consider the changes, ∆��= �� ∙ ∆�� Example 1: Generation 1000 MW, Load 1000 MW, Gain 200 MW/Hz, Frequency 49. 98 Hz What is the new frequency going to be if the load increases by 10 MW? ∆�� = ∆��/�� = 10/200 = 0. 05 • Load increase => Frequency decrease • The new frequency: 49. 98 – 0. 05 = 49. 93 Hz 21
Example 2: One minute after the load increase in Example 1, the load decreases by 6 MW. What is the new frequency going to be? Example 2 – Solution I Compare to the situation after the load increase in Example 1 ∆�� =∆��/�� = 6/200 = 0. 03 • Load decrease => frequency increase • The new frequency is 49. 93 + 0. 03 = 49. 96 Hz 22
Example 3 - Problem • Power system in balance, nominal frequency (50 Hz). • Two power plants participating in primary control: - Unit 1: 500 MW capacity, current generation 420 MW, gain 300 MW/Hz. - Unit 2: 100 MW capacity, current generation 75 MW, gain 300 MW/Hz, 85 MW of generation is lost in another unit. What is the frequency after restoring balance? 23
Solution Example 3 • Same gain ⇒ both units increase their generation by the same amount, i. e 85/2 = 42. 5 MW. • Unit 2 can only increase generation by 25 MW! - When the frequency is about 49. 916 Hz unit 2 will stop regulating. • To restore balance, unit 1 must increase its generation by 85 – 25 = 60 MW. • ∆��= ∆��/��= 60/300 Hz = 0. 2 Hz. • New frequency f = 50 – Hz. 24
AGC for Multi Areas Simplified Control Model v Area Control Error (ACE) v 25
Simplified Control Model v. Generators are grouped into control areas. v. Consider § An area as one generator in single area, and, § Tie-lines between areas as transmission lines connecting buses in single area. We can apply the same analysis to multiarea!! v. However, we have to come up with frequency-power characteristics of each area. v. Actual application of this model is for power pool operation. 26
Power Pool Operation �Power pool is an interconnection of the power systems of individual utilities. �Each company operates independently, BUT, �They have to maintain ◦ contractual agreement about power exchange of different utilities, and, ◦ same system frequency. �Basic rules ◦ Maintain scheduled tie-line capacities. ◦ Each area absorbs its own load changes. 27
AGC for Multi Areas v During transient period, sudden change of load causes each area generation to react according to its frequency-power characteristics. This is “called primary control”. v This change also effects steady state frequency and tie-line flows between areas. v We need to § Restore system frequency, § Restore tie-line capacities to the scheduled value, and, § Make the areas absorb their own load. This is called “secondary control”. 28
Area Control Error (ACE) Control setting power of each area needs to be adjusted corresponding to the change of scheduled tie-line capacity and change of system frequency. ACE measures this balance, and is given by, for two area case. Where = Frequency bias setting of area i (>0) and 29
ACE: Tie-Line Bias Control Use ACE to adjust setting control power, , of each area. Goal: ◦ To drive ACE in all area to zero. ◦ To send appropriate signal to setting control power, Use integrator controller so that ACE goes to zero at steady state. 30
AGC for 2 -Area with Tie-line Bias Control: Block Diagram + + - -1 + + - - + -1 - - 31
Example for Multi-Area 32
Solution 33
Area A - Same load, increased generation => increased export - Only 150 MW export capacity available - Both transmission lines will be overloaded - The area is isolated from the rest of the system - Export reduced by 300 MW (compared to before fault) • Equivalent to a load reduce - Frequency increase ∆���� =300/900≈ 0. 33 Hz 34
Areas B and C - Total deficit 540 MW • 240 MW lost generation • 300 MW lost import -Equal gain => both areas increase generation by 270 MW Area C - Increased export by 170 MW • Decreased import 100 MW • Increased generation 270 MW - Only 80 MW export capacity left - Transmission line overloaded - Area C is isolated from A since before, now also from B - Now there is a deficit of 60 MW compared to before fault • Lost 100 MW import from A • Lost 40 MW export to B - Frequency increase ∆�� �� =60/50 = 1. 2 Hz 35
Area B - Area is isolated – as well as the other two areas - Deficit of 480 MW • Lost 240 MW import and • Lost 240 MW generation - Frequency decrease ∆�� �� =480/50 = 9. 6 Hz Summary - All lines overloaded - New frequency in Area A: 50. 33 Hz - New frequency in Area B: 40. 4 Hz - New frequency in Area C: 48. 8 Hz 36