Australia and Ethiopia show similar climatic variability Ethiopia


Australia and Ethiopia show similar climatic variability Ethiopia Water storage per capita: 45 m 3 Australia Water Storage per capita: 5, 000 m 3

USA and Nepal have similar economically feasible hydropower potential USA Installed capacity: 70, 000 MW Nepal Installed capacity: 660 MW

GLOBAL WATER SECURITY: WATER FOR SOCIO-ECONOMIC DEVELOPMENT Benedito By Braga President B. P. F. Braga World Water Council President World Water C***ouncil - WWC CNI SUSTENTABILIDADE 2013 – WATER: CHALLENGES AND OPPORTUNITIES FOR THE BRAZILIAN DEVELOPMENT Sofitel Rio de Janeiro October 24, 2013

Declaration of the United Nations Conference on the Human Environment Stockholm 1972 Principle 8 Economic and social development is essential for ensuring a favorable living and working environment for man and for creating conditions on earth that are necessary for the improvement of the quality of life. Principle 9 Environmental deficiencies generated by the conditions of under-development and natural disasters pose grave problems and can best be remedied by accelerated development through the transfer of substantial quantities of financial and technological assistance as a supplement to the domestic effort of the developing countries and such timely assistance as may be required.
knowledge and technology) ECONOMIC CAPITAL (goods and services produced by society) ENVIRONMENTAL")
HUMAN CAPITAL ()knowledge and technology) ECONOMIC CAPITAL (goods and services produced by society) ENVIRONMENTAL CAPITAL (Natural Resources) SOCIAL CAPITAL (governance)

WATER SECURITY

Water Security Socioeconomic Security Human Security Ecologic Security

DAM: A DIRTY WORD? “DAM OR DAMN”
 Storage per capita 42% 1500")
Percentage of runoff available due to natural regulation (precipitation) Storage per capita 42% 1500 m 3 9% 100 m 3 J. Briscoe – Marrakech 2005

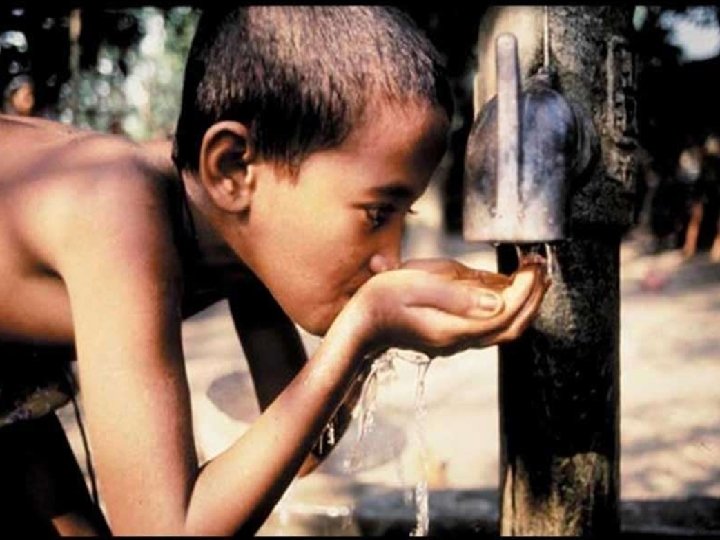
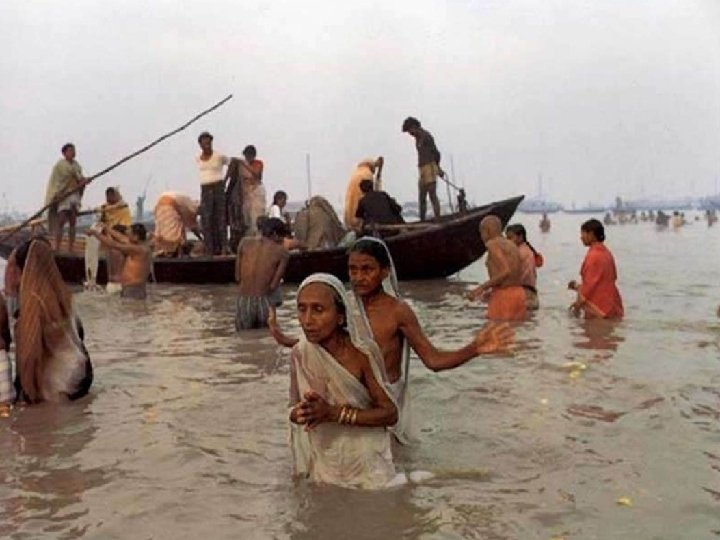
WHAT ABOUT THE DEVELOPING WORLD ?

Africa’s natural legacy: climate variability Extreme climate variability & associated landscape vulnerability mean very high costs to African economies, without major investments in water security unfortunately unaffordable to poor countries.

Economy-wide impacts Rainfall & GDP growth: Zimbabwe 1978 -1993 Rainfall & GDP growth: Ethiopia 1982 -2000

Billion $ % GDP 700 14 600 12 400 10 300 8 200 6 100 4 0 0 Richest Nations Poorest Nations Losses % GDP Economic Losses Disasters Losses, Total and as Share of GDP, In the Richest and Poorest Nations, 1985 – 99 (world watch 2001)

The electricity gap 3. 6 0. 8 1. 0 72% 70% 21% 1. 0 6% 1. 6 33% 70% Potential (million Gwh/year) Utilized in percentage Hydropower potential tapped

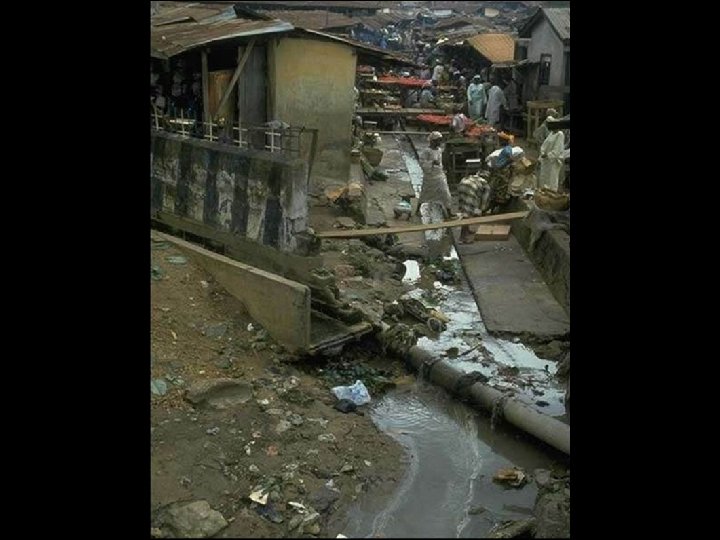
Progress Towards the MDG Drinking Target JMP report 2012

Progress Towards the MDG Sanitation Target JMP report 2012

Does water infrastructure pay off ?

The Bhakra-Beas complex in India 7 million hectares irrigation and 2, 800 MW of installed power

SOCIO-ECONOMIC IMPACTS OF BHAKRA DAM Landless workers benefited more that landowners

Irrigation can lift rural poor out of poverty “Poverty is worst Polluter…” Gandhi Net effect: income per capita Average income levels & irrigation intensity in India Unirrigated districts (< 10% of cropped area irrigated) - 69% below poverty line Irrigated districts (> 50% of cropped area irrigated) - 26% below poverty line
 10, 000")
Infrastructure and Development Infrastructure stocks per capita , 1990 ($, 1985 prices) 10, 000 Norway Source: World Development Report, 1994 Spain Paraguay 1, 000 Mexico Zambia Japan Australia Mauritius Mali Guatemala Bangladesh 100 Chad 100 Rwanda GDP per capita, 1990 (PPP dollars) 10, 000 1, 000 Latin America and the Caribbean East Asia and Pacific Middle East and North Africa Sub-Saharan Africa South Asia Europe and Central Asia

Critics of Hydropower What are important international NGO’s saying? • Destroy ecosystems • Social disruption due to local population displacement • Negative socio-economic impact downstream • Green house gases emission • High risk investment © WWF Getty Images / Larry Dale Gordon

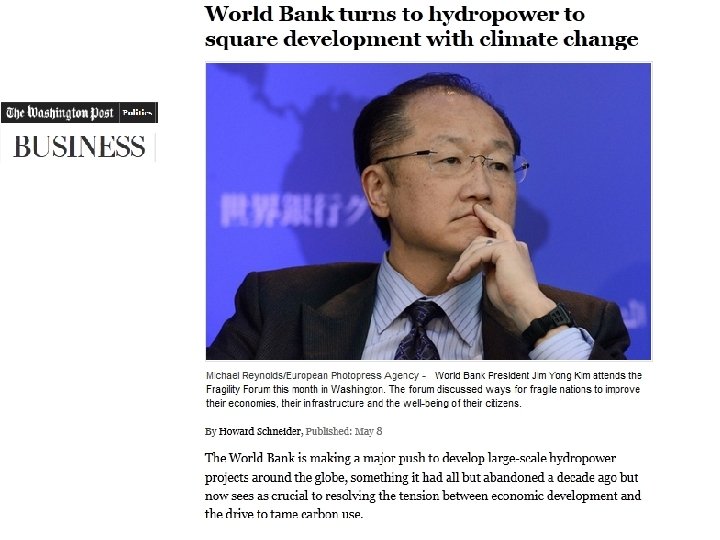
EMPRESTIMOS EM MILHOES USD WORLD BANK LENDING FOR HYDROPOWER 1200 1000 800 600 400 200 0 90 -92 93 -95 96 -98 99 -01 02 -04

Risks are higher as water is highly political issue. . .

Why is it difficult for the private sector to invest in water supply and sanitation? 200 Investment retur (percent) 150 Financial Authonomy 100 PPP Gap Fiscal 50 0 Telecomunicação Gas Energia Agua e Saneamento Source: World Bank, World Development Report 1994, Investing in Infrastructure 1994.

New Conglomarates Interested in Water

Motivation for Involvement: Group 1: scarcity is menace for social license for operation - Water users – Coca-Cola, Nestle, Ambev, Barilla

Motivation for Involvement: Grupo 2: solutions providers - Biotechnology – Monsanto, Syngenta - Treatment Technology – Dow, GE, Nalco - Information Technology – IBM, Cisco, Toro, Schlumberger

Some light at the end of the tunnel…
 800 World")
Average Annual World Bank lending for hydropower (in nominal million US $) 800 World Bank Water Resources Strategy 700 600 500 400 300 200 100 2 -2 11 20 01 -2 08 20 01 0 7 -2 05 20 00 -2 02 20 00 4 1 19 99 -2 00 8 19 96 -1 99 5 99 -1 93 19 19 90 -1 99 2 0

Water infrastructure is no panacea • Water management with strong public institutions • Users’ involvement in the decisionmaking process • Short, medium and long range river basin planning • Water permits system • Economic instruments (polluter-pays and user-pays)

‘Water Security’ & the ‘Minimum Platform’ net impact of water on growth + ‘Water secure’ ‘tipping point’ ‘Water Security’: when net impact of water on growth is positive Investments in water infrastructure & institutions + ‘Water insecure’ ‘Minimum Platform’ of Water Infrastructure & Institutions (river regulation & service delivery) = Level of investment needed to achieve ‘Water Security’ (incentives for entrepreneurs)

‘Water Security’ & the ‘Minimum Platform’ net impact of water on growth Country 2 high variability + Country 1 low variability ‘Water secure’ greater gains ‘tipping point’ MIP 2 MIP 1 + + + higher costs ‘Water insecure’ ‘deeper hole’ MIP: Minimum Infrastructure & Institutional Platform Source: D. Gray – C. Sadoff, 2005

Figure 2: Global Risks Landscape 2012 – WEF Business Leaders Impact Likelihood

Our Goals Decision-Makers 1: Make water and its planning, development and management part of the political agenda Politicians www. worldwatercouncil. org 2: Make water everybody’s business Professional Community Civil Society Experts Users

WATER RESOURCES MANAGEMENT IS ESSENTIALLY A POLITICAL PROCESS + river + dike = = Political Order

THANK YOU FOR YOUR KIND ATTENTION www. worldwatercouncil. org
- Slides: 43