
Audrey Muller Actelion Epidemiology Comparative effectiveness in rare

- Slides: 27
Audrey Muller (Actelion Epidemiology) Comparative effectiveness in rare disease: Handling of missing data for propensity score use in EXPOSURE
TABLE OF CONTENTS. EXPOSURE study Measures to prevent missing data Missing data mechanisms Measures to handle missing data 2 A. MULLER | 09 MAR 2018
CONTEXT Pulmonary Arterial Hypertension (PAH): • rare disease affecting 15– 26 cases per million adult inhabitants • life-threatening condition that gets worse over time • treatments can help the symptoms so patients can live better and longer with the disease • 3 treatment pathways, very few naïve patients Uptravi®: • new oral prostacyclin receptor agonist approved for PAH treatment • can be prescribed alone or in combination with other PAH-specific therapies 3 A. MULLER | 09 MAR 2018
EXPOSURE DESIGN, SOURCES FOR MISSING DATA 4 A. MULLER | 09 MAR 2018
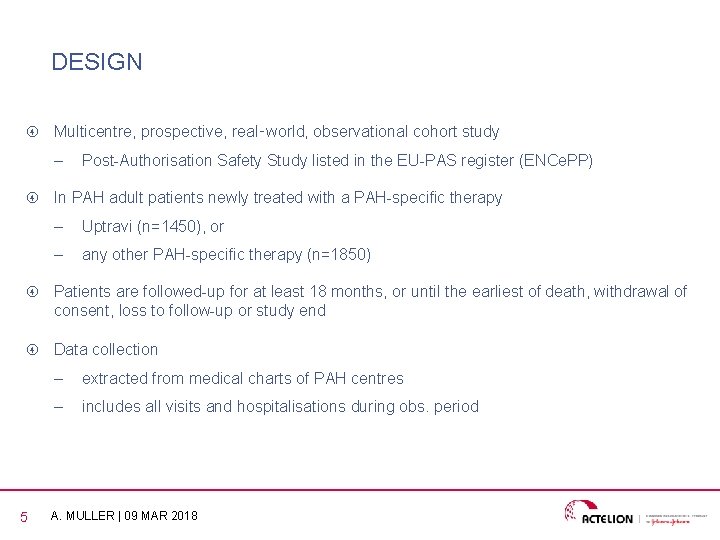
DESIGN Multicentre, prospective, real‑world, observational cohort study – Post-Authorisation Safety Study listed in the EU-PAS register (ENCe. PP) In PAH adult patients newly treated with a PAH-specific therapy – Uptravi (n=1450), or – any other PAH-specific therapy (n=1850) Patients are followed-up for at least 18 months, or until the earliest of death, withdrawal of consent, loss to follow-up or study end Data collection 5 – extracted from medical charts of PAH centres – includes all visits and hospitalisations during obs. period A. MULLER | 09 MAR 2018
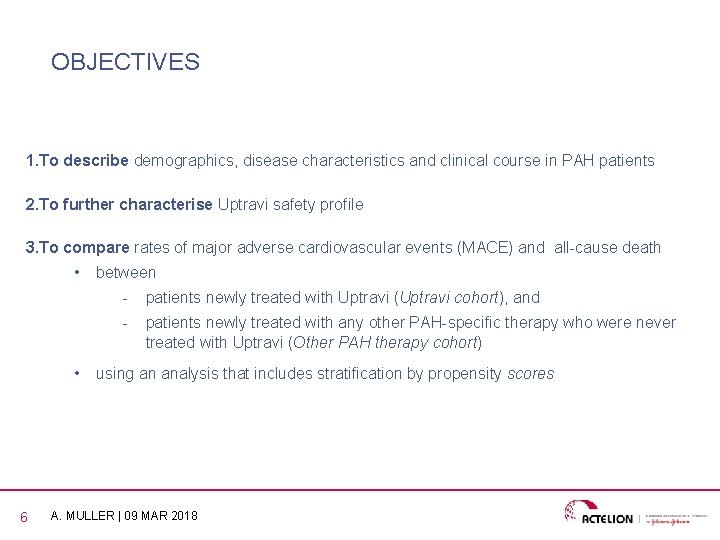
OBJECTIVES 1. To describe demographics, disease characteristics and clinical course in PAH patients 2. To further characterise Uptravi safety profile 3. To compare rates of major adverse cardiovascular events (MACE) and all-cause death • • 6 between - patients newly treated with Uptravi (Uptravi cohort), and - patients newly treated with any other PAH-specific therapy who were never treated with Uptravi (Other PAH therapy cohort) using an analysis that includes stratification by propensity scores A. MULLER | 09 MAR 2018
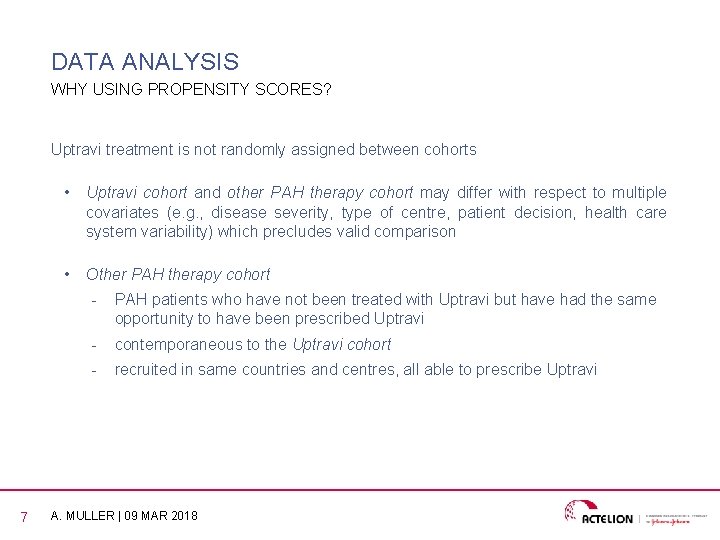
DATA ANALYSIS WHY USING PROPENSITY SCORES? Uptravi treatment is not randomly assigned between cohorts 7 • Uptravi cohort and other PAH therapy cohort may differ with respect to multiple covariates (e. g. , disease severity, type of centre, patient decision, health care system variability) which precludes valid comparison • Other PAH therapy cohort - PAH patients who have not been treated with Uptravi but have had the same opportunity to have been prescribed Uptravi - contemporaneous to the Uptravi cohort - recruited in same countries and centres, all able to prescribe Uptravi A. MULLER | 09 MAR 2018
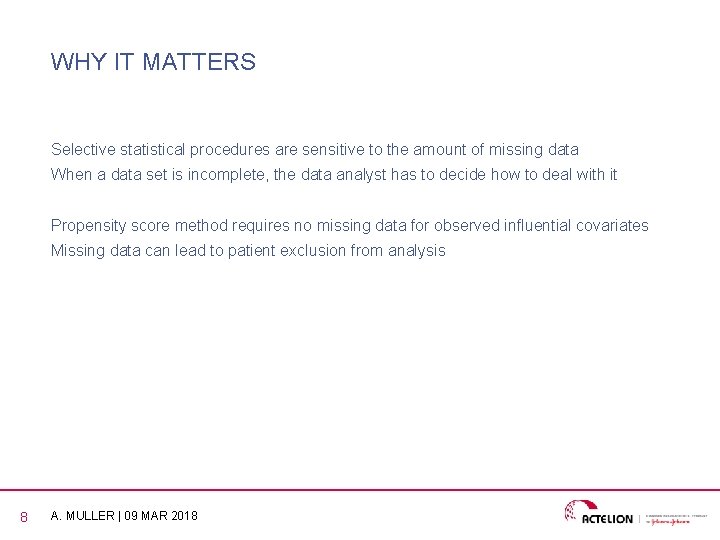
WHY IT MATTERS Selective statistical procedures are sensitive to the amount of missing data When a data set is incomplete, the data analyst has to decide how to deal with it Propensity score method requires no missing data for observed influential covariates Missing data can lead to patient exclusion from analysis 8 A. MULLER | 09 MAR 2018
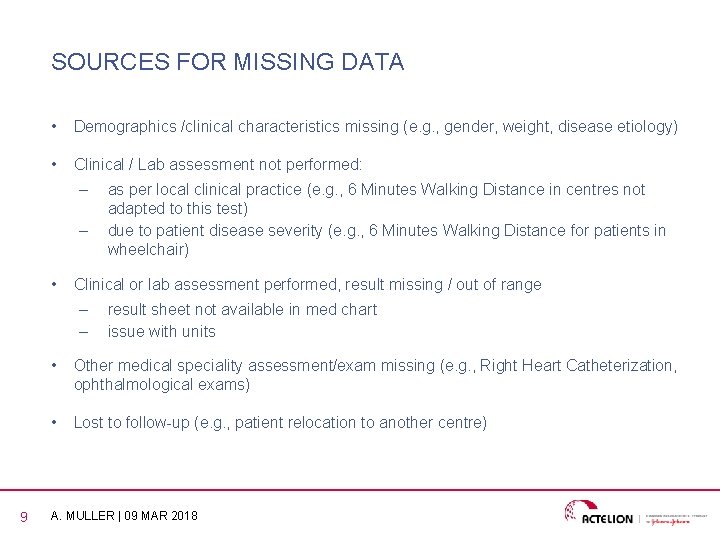
SOURCES FOR MISSING DATA • Demographics /clinical characteristics missing (e. g. , gender, weight, disease etiology) • Clinical / Lab assessment not performed: – – • Clinical or lab assessment performed, result missing / out of range – – 9 as per local clinical practice (e. g. , 6 Minutes Walking Distance in centres not adapted to this test) due to patient disease severity (e. g. , 6 Minutes Walking Distance for patients in wheelchair) result sheet not available in med chart issue with units • Other medical speciality assessment/exam missing (e. g. , Right Heart Catheterization, ophthalmological exams) • Lost to follow-up (e. g. , patient relocation to another centre) A. MULLER | 09 MAR 2018
MEASURES TO PREVENT MISSING DATA 10 A. MULLER | 09 MAR 2018
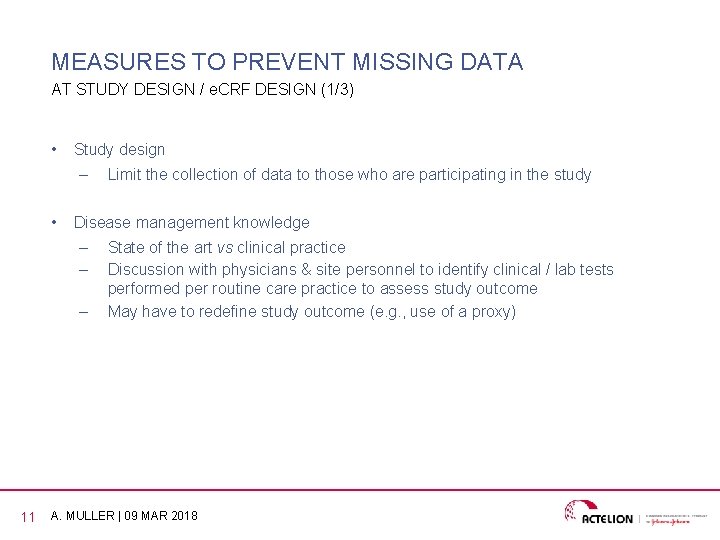
MEASURES TO PREVENT MISSING DATA AT STUDY DESIGN / e. CRF DESIGN (1/3) • Study design – • Disease management knowledge – – – 11 Limit the collection of data to those who are participating in the study State of the art vs clinical practice Discussion with physicians & site personnel to identify clinical / lab tests performed per routine care practice to assess study outcome May have to redefine study outcome (e. g. , use of a proxy) A. MULLER | 09 MAR 2018
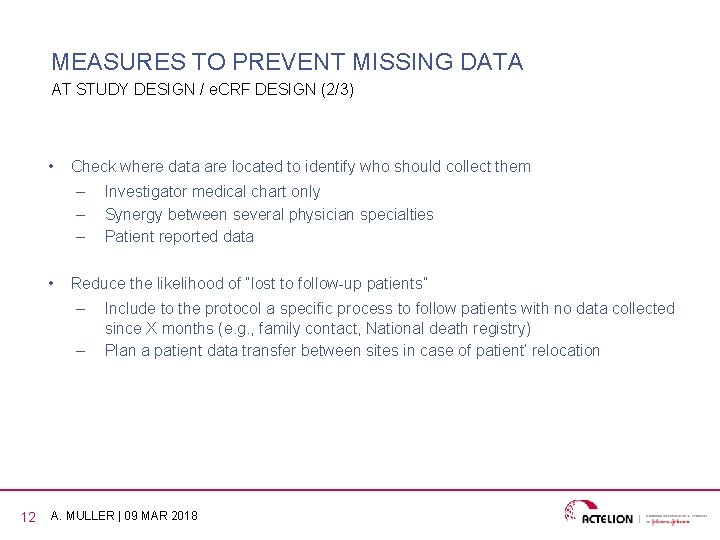
MEASURES TO PREVENT MISSING DATA AT STUDY DESIGN / e. CRF DESIGN (2/3) • Check where data are located to identify who should collect them – – – • Reduce the likelihood of “lost to follow-up patients” – – 12 Investigator medical chart only Synergy between several physician specialties Patient reported data Include to the protocol a specific process to follow patients with no data collected since X months (e. g. , family contact, National death registry) Plan a patient data transfer between sites in case of patient’ relocation A. MULLER | 09 MAR 2018
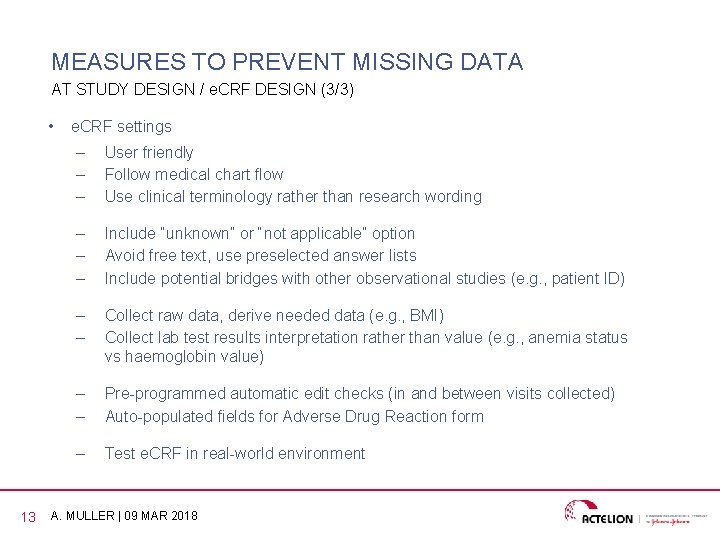
MEASURES TO PREVENT MISSING DATA AT STUDY DESIGN / e. CRF DESIGN (3/3) • 13 e. CRF settings – – – User friendly Follow medical chart flow Use clinical terminology rather than research wording – – – Include “unknown” or “not applicable” option Avoid free text, use preselected answer lists Include potential bridges with other observational studies (e. g. , patient ID) – – Collect raw data, derive needed data (e. g. , BMI) Collect lab test results interpretation rather than value (e. g. , anemia status vs haemoglobin value) – – Pre-programmed automatic edit checks (in and between visits collected) Auto-populated fields for Adverse Drug Reaction form – Test e. CRF in real-world environment A. MULLER | 09 MAR 2018
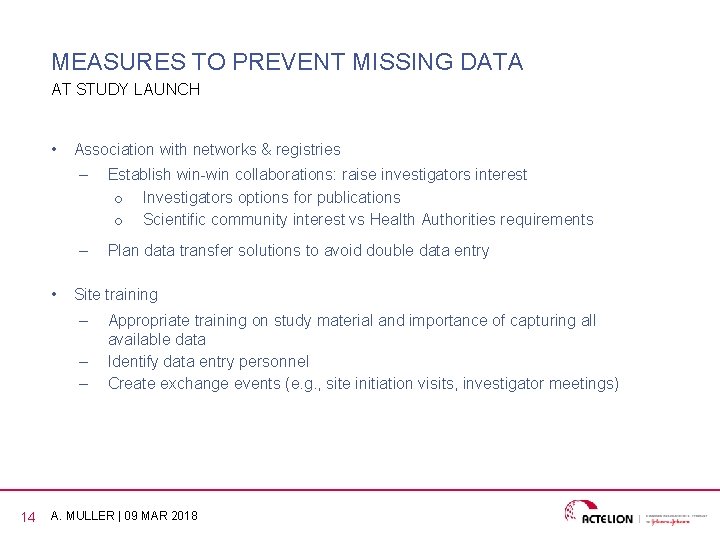
MEASURES TO PREVENT MISSING DATA AT STUDY LAUNCH • • Association with networks & registries – Establish win-win collaborations: raise investigators interest o Investigators options for publications o Scientific community interest vs Health Authorities requirements – Plan data transfer solutions to avoid double data entry Site training – – – 14 Appropriate training on study material and importance of capturing all available data Identify data entry personnel Create exchange events (e. g. , site initiation visits, investigator meetings) A. MULLER | 09 MAR 2018
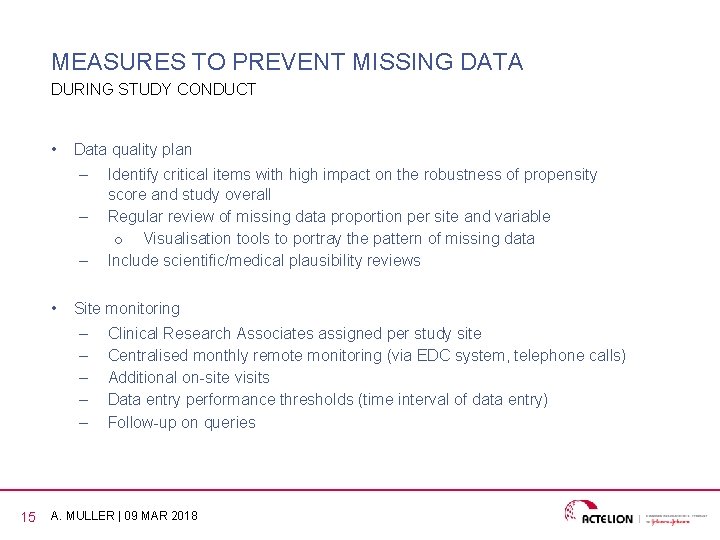
MEASURES TO PREVENT MISSING DATA DURING STUDY CONDUCT • Data quality plan – – – • Site monitoring – – – 15 Identify critical items with high impact on the robustness of propensity score and study overall Regular review of missing data proportion per site and variable o Visualisation tools to portray the pattern of missing data Include scientific/medical plausibility reviews Clinical Research Associates assigned per study site Centralised monthly remote monitoring (via EDC system, telephone calls) Additional on-site visits Data entry performance thresholds (time interval of data entry) Follow-up on queries A. MULLER | 09 MAR 2018
MISSING DATA MECHANISMS 16 A. MULLER | 09 MAR 2018
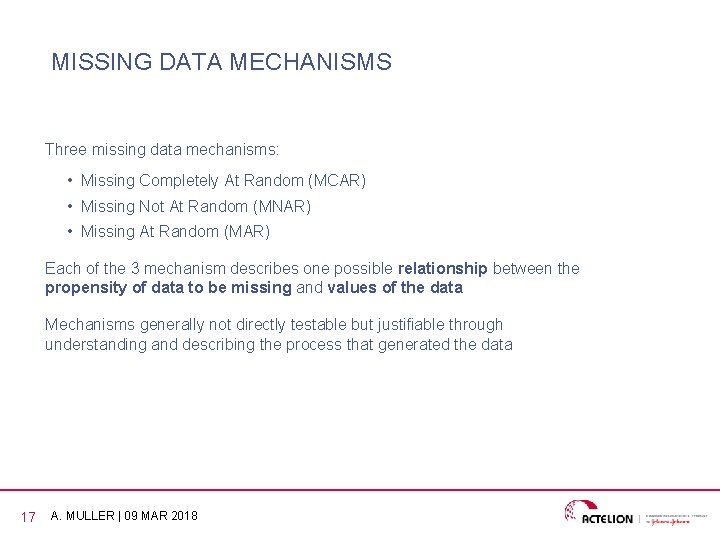
MISSING DATA MECHANISMS Three missing data mechanisms: • Missing Completely At Random (MCAR) • Missing Not At Random (MNAR) • Missing At Random (MAR) Each of the 3 mechanism describes one possible relationship between the propensity of data to be missing and values of the data Mechanisms generally not directly testable but justifiable through understanding and describing the process that generated the data 17 A. MULLER | 09 MAR 2018
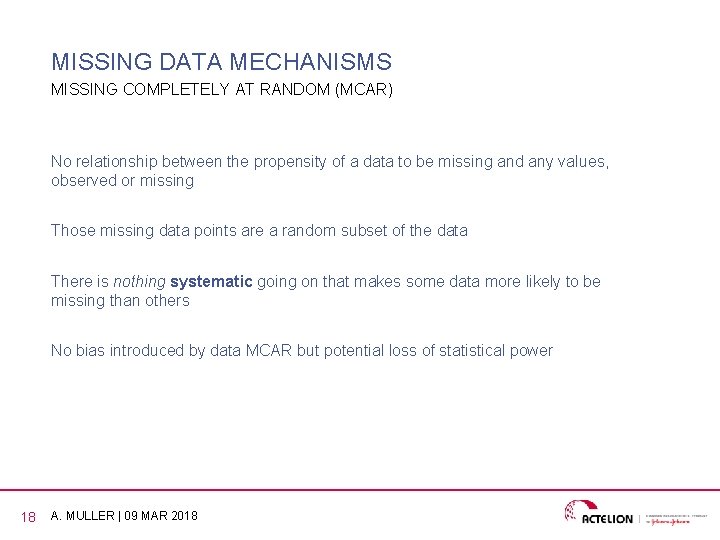
MISSING DATA MECHANISMS MISSING COMPLETELY AT RANDOM (MCAR) No relationship between the propensity of a data to be missing and any values, observed or missing Those missing data points are a random subset of the data There is nothing systematic going on that makes some data more likely to be missing than others No bias introduced by data MCAR but potential loss of statistical power 18 A. MULLER | 09 MAR 2018
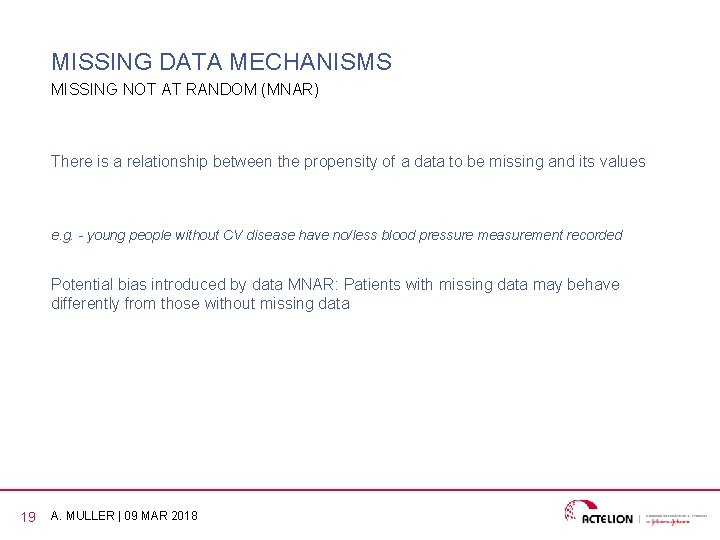
MISSING DATA MECHANISMS MISSING NOT AT RANDOM (MNAR) There is a relationship between the propensity of a data to be missing and its values e. g. - young people without CV disease have no/less blood pressure measurement recorded Potential bias introduced by data MNAR: Patients with missing data may behave differently from those without missing data 19 A. MULLER | 09 MAR 2018
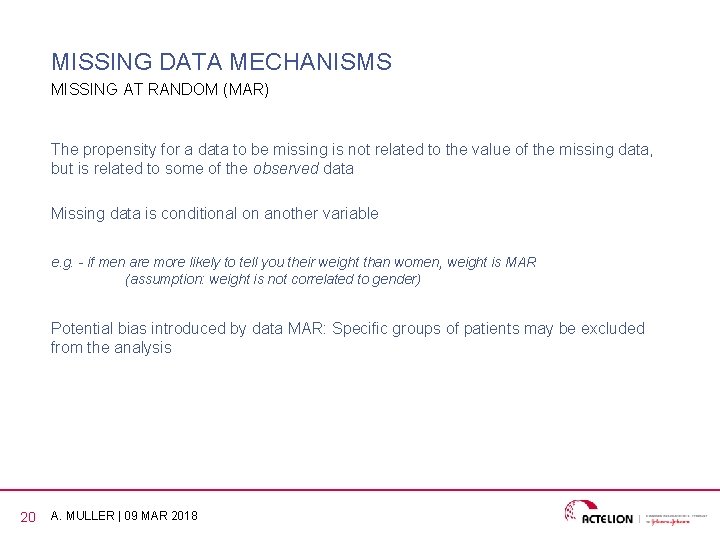
MISSING DATA MECHANISMS MISSING AT RANDOM (MAR) The propensity for a data to be missing is not related to the value of the missing data, but is related to some of the observed data Missing data is conditional on another variable e. g. - if men are more likely to tell you their weight than women, weight is MAR (assumption: weight is not correlated to gender) Potential bias introduced by data MAR: Specific groups of patients may be excluded from the analysis 20 A. MULLER | 09 MAR 2018
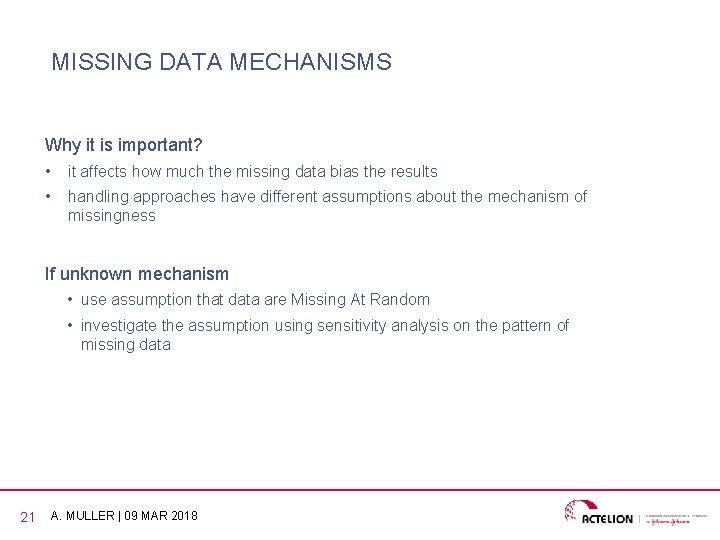
MISSING DATA MECHANISMS Why it is important? • it affects how much the missing data bias the results • handling approaches have different assumptions about the mechanism of missingness If unknown mechanism • use assumption that data are Missing At Random • investigate the assumption using sensitivity analysis on the pattern of missing data 21 A. MULLER | 09 MAR 2018
MEASURES TO HANDLE MISSING DATA 22 A. MULLER | 09 MAR 2018
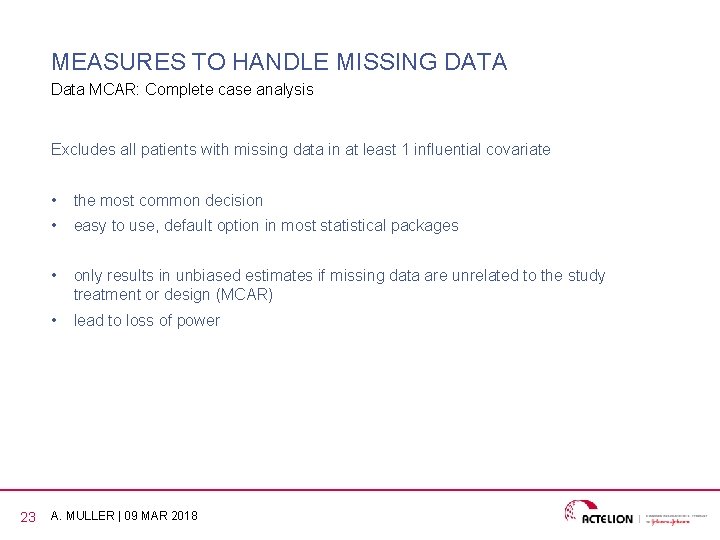
MEASURES TO HANDLE MISSING DATA Data MCAR: Complete case analysis Excludes all patients with missing data in at least 1 influential covariate 23 • the most common decision • easy to use, default option in most statistical packages • only results in unbiased estimates if missing data are unrelated to the study treatment or design (MCAR) • lead to loss of power A. MULLER | 09 MAR 2018
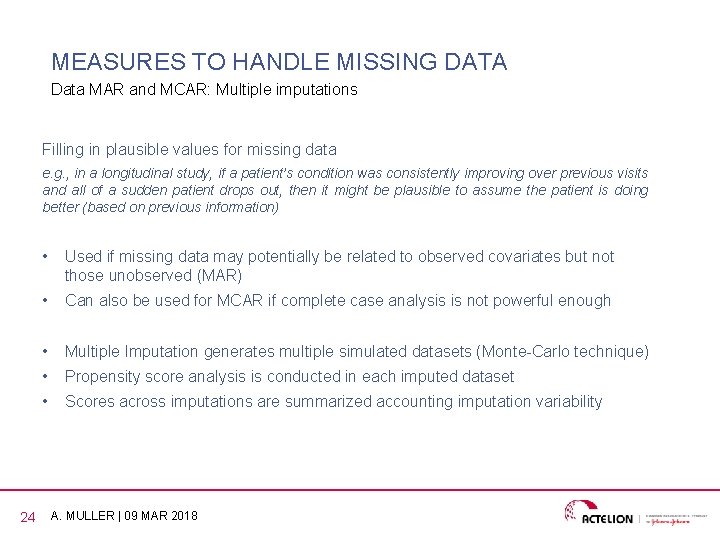
MEASURES TO HANDLE MISSING DATA Data MAR and MCAR: Multiple imputations Filling in plausible values for missing data e. g. , in a longitudinal study, if a patient’s condition was consistently improving over previous visits and all of a sudden patient drops out, then it might be plausible to assume the patient is doing better (based on previous information) 24 • Used if missing data may potentially be related to observed covariates but not those unobserved (MAR) • Can also be used for MCAR if complete case analysis is not powerful enough • Multiple Imputation generates multiple simulated datasets (Monte-Carlo technique) • Propensity score analysis is conducted in each imputed dataset • Scores across imputations are summarized accounting imputation variability A. MULLER | 09 MAR 2018
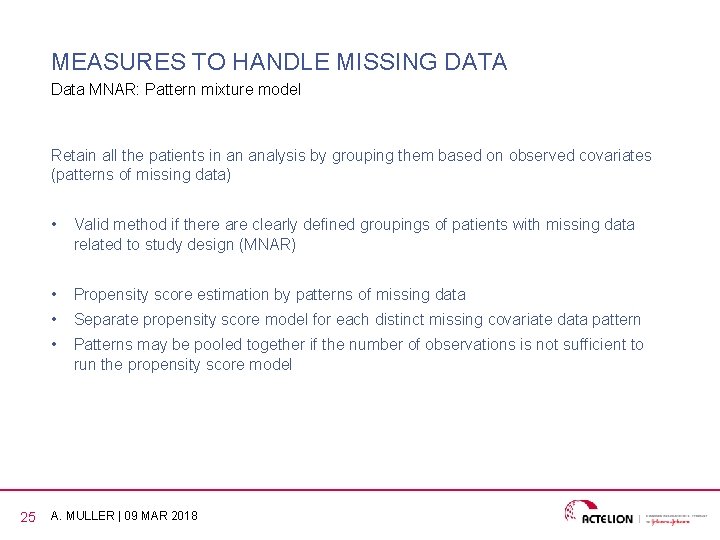
MEASURES TO HANDLE MISSING DATA Data MNAR: Pattern mixture model Retain all the patients in an analysis by grouping them based on observed covariates (patterns of missing data) 25 • Valid method if there are clearly defined groupings of patients with missing data related to study design (MNAR) • Propensity score estimation by patterns of missing data • Separate propensity score model for each distinct missing covariate data pattern • Patterns may be pooled together if the number of observations is not sufficient to run the propensity score model A. MULLER | 09 MAR 2018
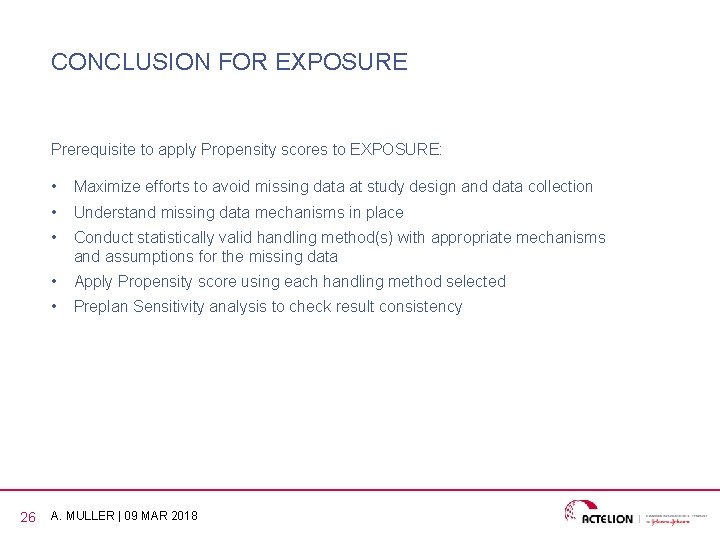
CONCLUSION FOR EXPOSURE Prerequisite to apply Propensity scores to EXPOSURE: 26 • Maximize efforts to avoid missing data at study design and data collection • Understand missing data mechanisms in place • Conduct statistically valid handling method(s) with appropriate mechanisms and assumptions for the missing data • Apply Propensity score using each handling method selected • Preplan Sensitivity analysis to check result consistency A. MULLER | 09 MAR 2018
THANK YOU. 27 A. MULLER | 09 MAR 2018