
At The Market ATM Offerings Presented by Sara

At The Market (ATM) Offerings Presented by, Sara La. Fever Sagient Research Systems
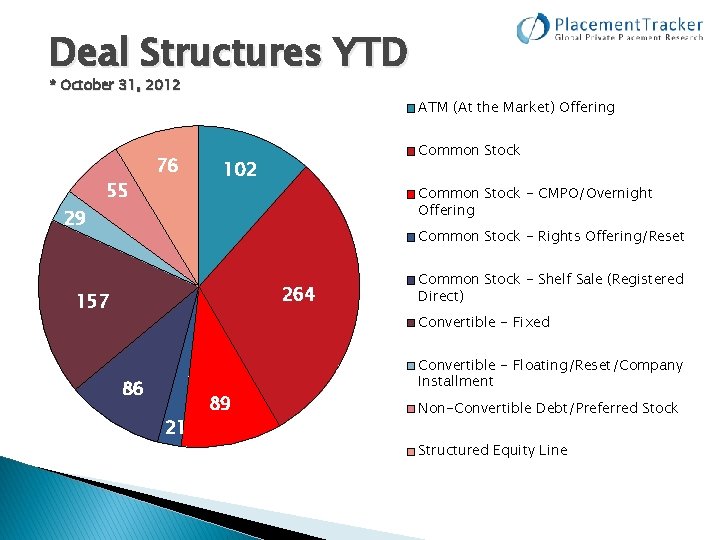
Deal Structures YTD * October 31, 2012 ATM (At the Market) Offering 29 55 76 Common Stock 102 Common Stock - CMPO/Overnight Offering Common Stock - Rights Offering/Reset 264 157 Common Stock - Shelf Sale (Registered Direct) Convertible - Fixed 86 21 89 Convertible - Floating/Reset/Company Installment Non-Convertible Debt/Preferred Stock Structured Equity Line
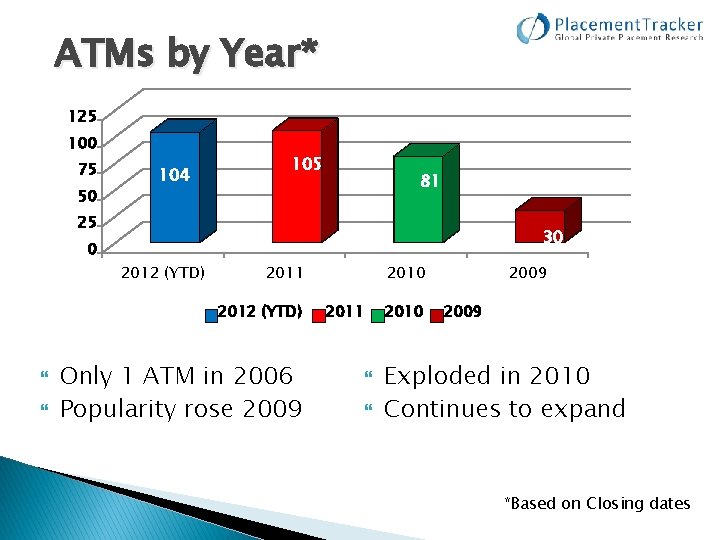
ATMs by Year* 125 100 75 50 104 105 81 25 30 0 2012 (YTD) 2011 2012 (YTD) Only 1 ATM in 2006 Popularity rose 2009 2010 2011 2010 2009 Exploded in 2010 Continues to expand *Based on Closing dates
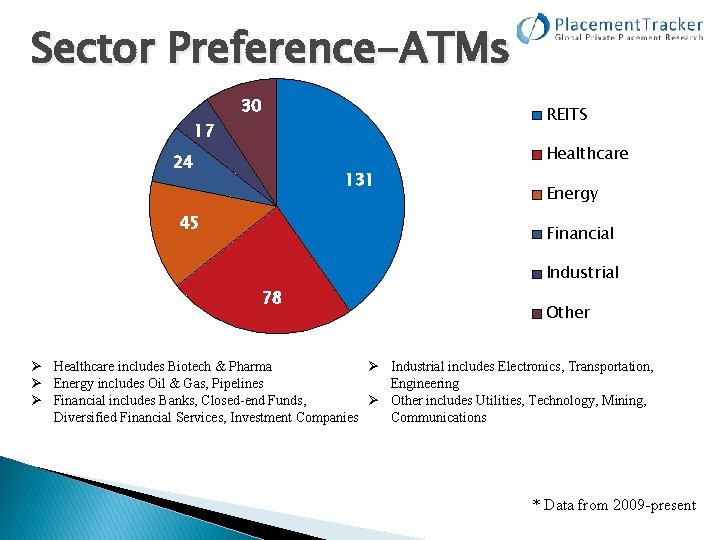
Sector Preference-ATMs 30 REITS 17 Healthcare 24 131 45 Energy Financial Industrial 78 Other Ø Healthcare includes Biotech & Pharma Ø Industrial includes Electronics, Transportation, Ø Energy includes Oil & Gas, Pipelines Engineering Ø Financial includes Banks, Closed-end Funds, Ø Other includes Utilities, Technology, Mining, Diversified Financial Services, Investment Companies Communications * Data from 2009 -present
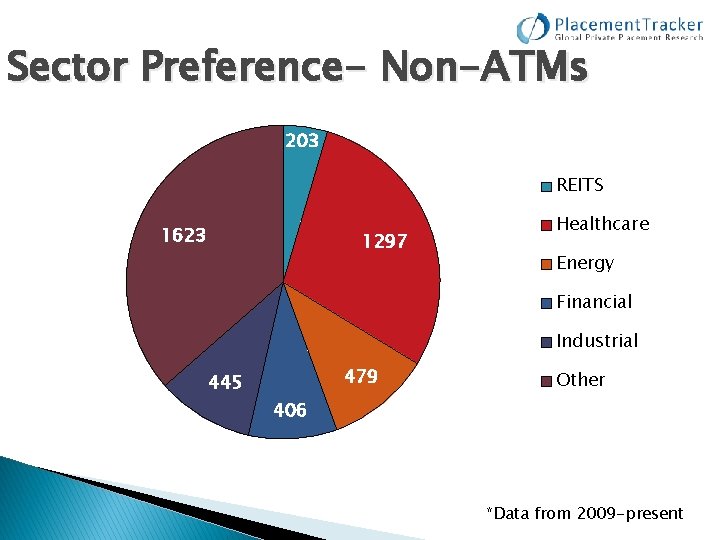
Sector Preference- Non-ATMs 203 REITS 1623 1297 Healthcare Energy Financial Industrial 479 445 Other 406 *Data from 2009 -present
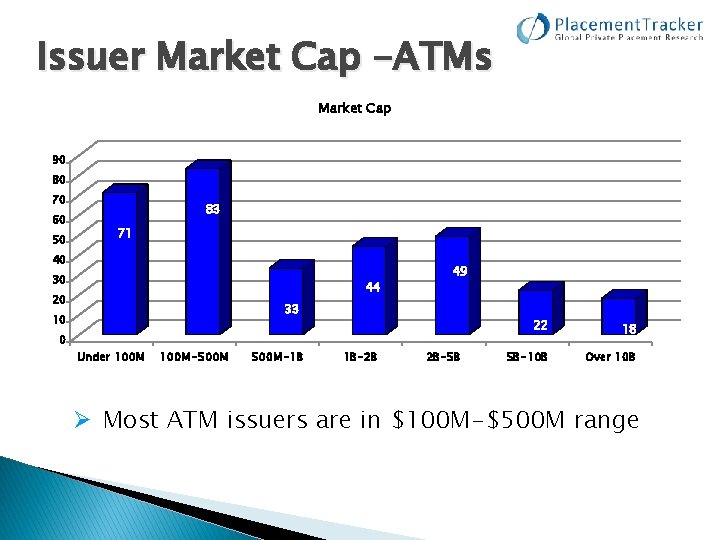
Issuer Market Cap -ATMs Market Cap 90 80 70 60 50 83 71 40 30 44 20 33 10 0 49 Under 100 M-500 M-1 B 1 B-2 B 2 B-5 B 22 18 5 B-10 B Over 10 B Ø Most ATM issuers are in $100 M-$500 M range

CMPOs vs. ATMs 350 345 340 335 343 330 ATMs YTD: 102 CMPOs YTD: 89 CMPOs tend to be popular in the healthcare sector 325 320 321 315 310 CMPO ATM *Data from 2009 -present
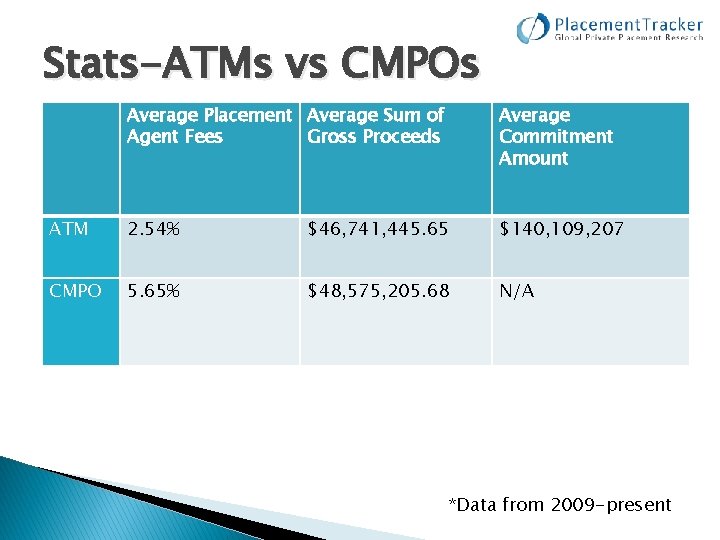
Stats-ATMs vs CMPOs Average Placement Average Sum of Agent Fees Gross Proceeds Average Commitment Amount ATM 2. 54% $46, 741, 445. 65 $140, 109, 207 CMPO 5. 65% $48, 575, 205. 68 N/A *Data from 2009 -present
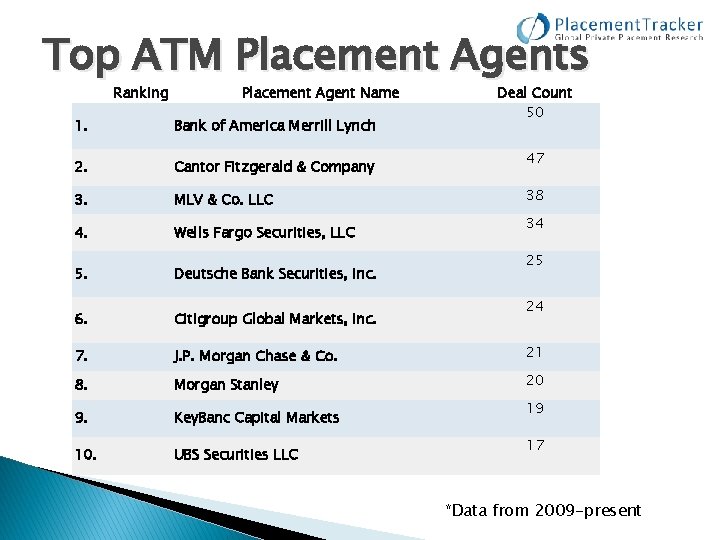
Top ATM Placement Agents Ranking Placement Agent Name Deal Count 50 1. Bank of America Merrill Lynch 2. Cantor Fitzgerald & Company 3. MLV & Co. LLC 4. Wells Fargo Securities, LLC 5. Deutsche Bank Securities, Inc. 6. Citigroup Global Markets, Inc. 7. J. P. Morgan Chase & Co. 21 8. Morgan Stanley 20 9. Key. Banc Capital Markets 10. UBS Securities LLC 47 38 34 25 24 19 17 *Data from 2009 -present
- Slides: 9