Assetbased Reallocations Amonthep Beet Chawla Berkeley Handson 12

Asset-based Reallocations Amonthep “Beet” Chawla Berkeley Hands-on 12 -16 January, 2009
 • Public asset-based reallocations (Beet)")
Outline • Overview • Private asset-based reallocations (Andy) • Public asset-based reallocations (Beet)

Overview • Brief concept • How to use the RA spreadsheet • Learn from examples: “The Good, the Bad and the Ugly”

Concept • Individuals accumulate or dis-accumulate different types of assets to achieve their lifecycle consumption path • Types of assets – capital income – financial income (credit and other property income) • Accumulating assets though the public and private sectors

Asset Ownership Public Sector • Inflows and outflows of individuals’ public asset income and saving are proportional to individuals’ share of tax payment. • Children pay indirect tax on consumption, therefore there are public asset income and public saving for children. Private Sector • Inflows and outflows of private asset income and saving are to and from a household head. • Children and other nonhead members do not earn asset income or save.
 Spreadsheet • Combined both public and private RA • New version")
Asset-based Reallocations (RA) Spreadsheet • Combined both public and private RA • New version with a check list • Fill up data for – Macro controls – Age profiles – NT Flows • Try to find data; acknowledge the drawbacks or shortage of data; and move on! • Don’t try to cook the data

Examples for Checking • Are there private RA for children? – Check if taxes are included in TFW estimation – Do you over smooth some profiles? • Macro controls: do all property income from all sectors net to zero? • Do you fill up all capital income? • How do you handle indirect taxes? – From a RA spreadsheet – From your own estimations

1. Individuals do not save until ages early 40 s 2. Individuals receive asset income before they save to accumulate assets The elderly do not dis-save? Non-zero RA for children

How to handle macro controls? Almost zero Not all countries may have this information Using the RA spreadsheet

Let’s take a loot at the RA spreadsheet! NTA web

Private Asset-based Reallocations: An Introduction Andrew Mason

Outline • Overview of Asset-based Reallocations • Implementation with Illustrative Values • Conclusions

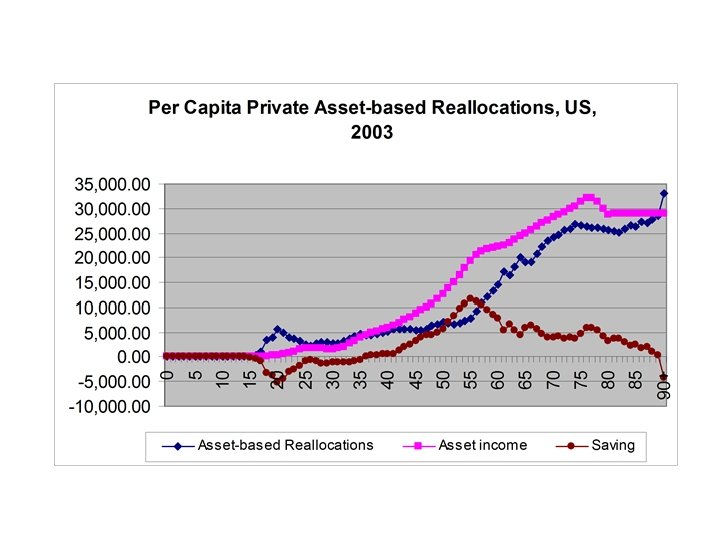
Asset-based Reallocations: Two Mechanisms • Assets generate interage flows in two ways: • Asset-income – Assets yields positive asset income, an inflow – Debt yields negative asset income, an outflow • Saving – Acquiring an asset or disposing of debt, generates an outflows – Disposing of an asset or acquiring debt, generates an inflow. • Asset-based reallocations are incorporated into NTA based on the flow constraint

The Flow Account Identity • Inflows – Labor Income – Asset Income – Transfer Inflows • Outflows – Consumption – Saving – Transfer Outflows

Forms of Assets and Asset Income • Capital – Yields capital income – Examples: Equipment, commercial structures, vehicles, inventories, homes. • Financial assets – All financial assets have a counterpart (counterpart of credit is debt, for example) – Yields property income – Outflow for one unit and inflow for another unit – For the economy (private, public and ROW combined) property income and each component must sum to zero. • Examples of property income: Interest, dividends, land rent, and royalties. • See UNSNA 1993 for a more complete and detailed discussion of assets and asset income

Use of Asset-based Reallocations Features of assets limit their use: • Children do not own assets as a general rule. • Capital can only be used to reallocate resources from young ages to old ages. • Because financial assets always have a counterpart, demand must be matched by supply. If one age group is a net debtor, for example, another age group, the government, or the ROW must be a net creditor. • Constraints on indebtedness limit the use of debt for downward reallocations by young adults.

Possible Uses of AR • Lifecycle saving: accumulating assets during the working ages to support retirement. • Saving to fund transfers – Saving to fund downward transfers (college saving plans) – Saving to fund transfers to elderly parents • Bequest saving – Funding retirement using inheritances – Saving to generate bequests • Other saving models may have incidental effects on interage flows

Lifecycle Saving for Retirement Age 45 -64: Save labor income of $1000 per year plus all asset income. Age 65 -90: Dis-save a constant amount in each year. Saving Asset income Asset-based reallocations

AR Patterns for Other Uses • Saving to fund transfers – Saving by young adults – AR inflows to adults with costly children or elderly parents • Bequest saving – Saving by working age adults – Limited dis-saving by older adults • Reliance on inheritance – Limited saving by working age adults – Significant AR inflows at older ages (asset income from inherited assets).

Complexities in Interpreting AR Patterns • Age patterns reflect multiple objectives and influences • Many theories describe lifetime behavior of a cohort; data are for a cross-section. • Behavior of any age group reflects its history. Older age groups often have very different economic and demographic histories than younger age groups. • Patterns may reflect important social changes (decline of extended family) or institutional change (emergence of financial markets). • AR for any year may reflect important time effects, e. g. , a financial crisis or the implementation of a new policy.
 – Private sector –")
Implementation • Definitions and Aggregate Controls (Relationship to UNSNA 1993) – Private sector – Asset income – Saving • Constructing Age Profiles – Lifecycle model – Bequests and other capital transfers – Other models

What does private mean? • Private refers to all inflows to and outflows from the household sector, the corporate sector (financial and non -financial), and non-profit institutions serving households (NPISHs). • Public enterprise is part of the private sector. – Operating surplus is private asset income – Dividends and other distributions by public enterprise to the government are part of public asset income • Intersectoral flows between the private sector, the government and ROW are important – Public debt leads to private asset income (interest) – Foreign investment leads to flows between private and ROW

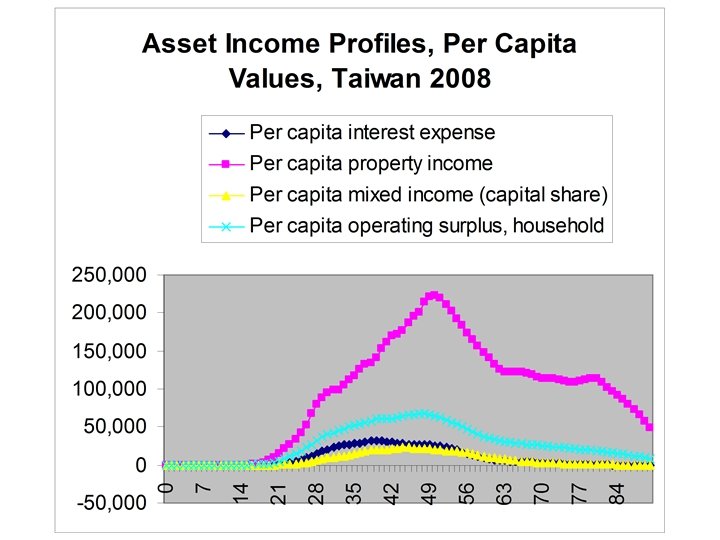
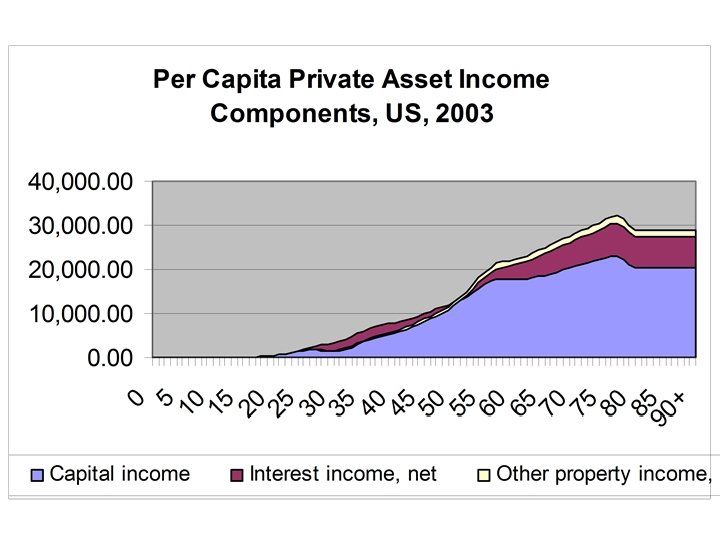
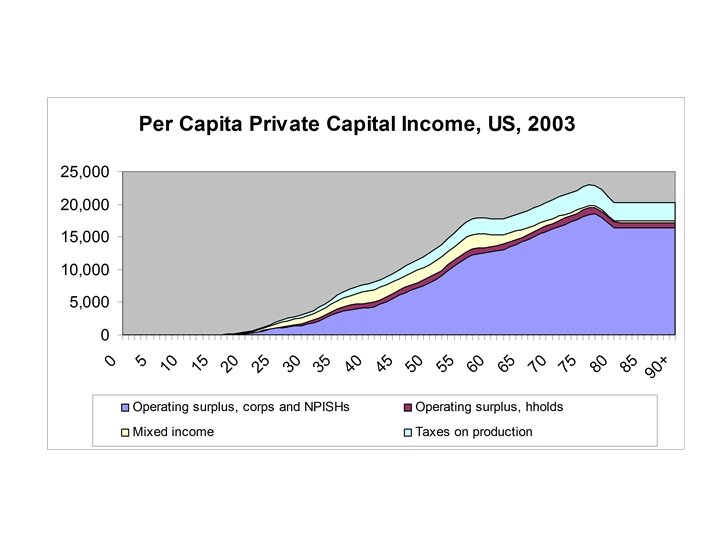
Computing Asset Income • Asset income consists of capital income and property income • Capital income is the return to capital net of depreciation – Three components of capital income • Operating surplus of corporations • Capital’s share of mixed income • Operating surplus of households (return to owner-occupied housing) and other consumer durables (if possible) – No exact counterpart in SNA because mixed income is not allocated between return to capital and return to labor – Capital income is the estimated value net of subsidies and taxes on production.
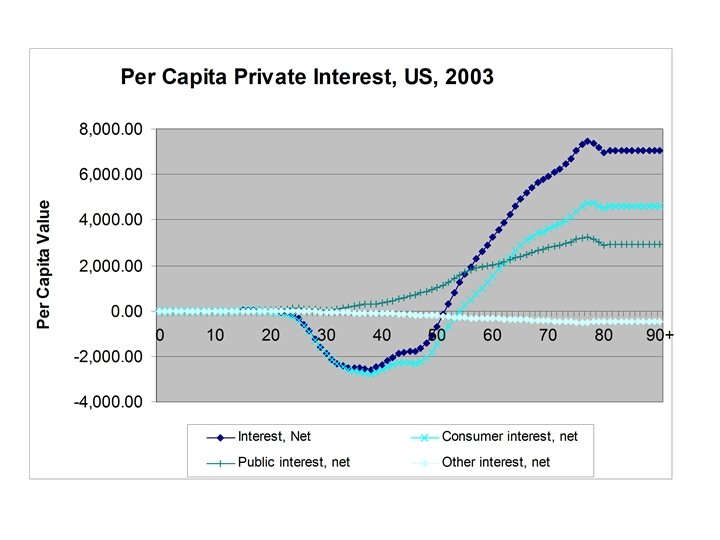
 • Property income – Interest – Other property income •")
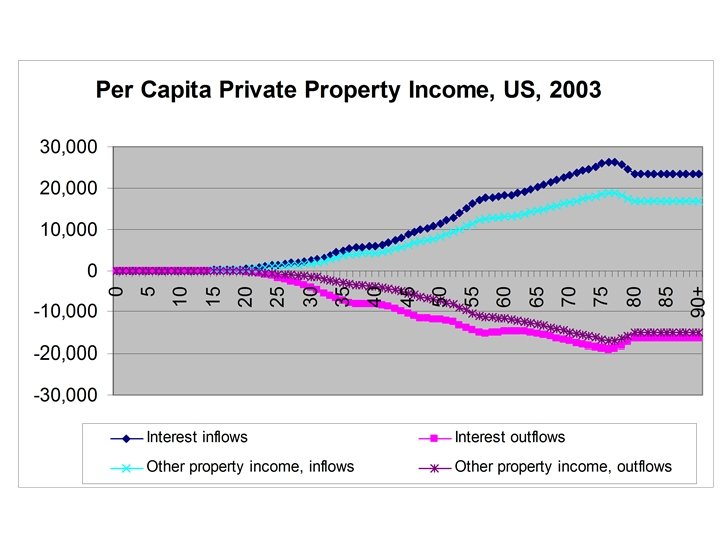
Computing Asset Income (cont) • Property income – Interest – Other property income • Dividends and similar distributions • Rent (returns to land, royalties on fossil fuels and other subsoil minerals) • Other less important components – Important check on property income: • For the economy as a whole property income and each component (interest, dividends, rent, etc. ) must sum to zero. • Private flows are non-zero and balanced by public flows or ROW flows.

Aggregate Controls: Capital Income • Operating surplus of corporations and NPISHs • Capital’s share of mixed income • Operating surplus of households (imputed rent of owner-occupied housing) • Taxes on products and production; subsidies

Sources of data and adjustments • Source: NIPA – – Operating surplus for each sector Mixed income Taxes on products and production Subsidies • Adjustments – Mixed income includes returns to labor; assume that 1/3 is a return is capital income – Taxes and subsidies • Follow same procedures used elsewhere • As a broad rule taxes on production net of subsidies are allocated between capital income and labor income in proportion to their relative income shares.

Capital income in Taiwan An Illustration Capital Income and Components, Taiwan, 1998, NT$ Millions Capital income 2, 87 8, 4 5 1 Operating surplus, net 2, 60 5, 4 2 9 Operating surplus of corporations and 1, 98 0, 1 0

Aggregate Controls: Property Income • Property income is available in SNA by sector and type of property income • Mapping of NIPA sectors NTA sectors – General government public – Households, NPISHs, corporations private – ROW • Exact classification of property income varies, but for NTA important to know: – Interest, household and other separately – Other property income, i. e. , all property income other than interest combined.

Property Income in Taiwan An Example Property Income and Components, Taiwan, 1998, NT$ Millions Property income, net Property income, inflows Property income, outflows Interest, net Inflows Outflows Other property income, net Inflows Outflows Total Private ROW Public 0 -172, 192 -81, 097 253, 289 3, 883, 803 3, 361, 863 127, 902 394, 038 -3, 883, 803 -3, 534, 056 -208, 999 -140, 748 0 218, 625 -121, 713 -96, 912 2, 606, 230 2, 487, 285 75, 108 43, 837 -2, 606, 230 -2, 268, 661 -196, 821 -140, 748 0 -390, 817 40, 616 350, 201 1, 277, 573 874, 578 52, 794 350, 201 -1, 277, 573 -1, 265, 395 -12, 178 0
 of intersectoral")
Intersectoral Flows • A complete set of accounts requires data (or estimates) of intersectoral flows of property income. – Ex: Interest paid to ROW by the private sector. • Some information is often available: – Interest paid by government to ROW. – Interest paid by the private sector on govt loans. • Intersectoral flows can be approximated if direct estimates are not available. – AR spreadsheet calculates intersectoral flows by assuming that some flows are known and that other flows are proportional to totals.

Intersectoral Flows of Interest An Example from Taiwan Intersectoral Flows of Interest, Taiwan, 1998, NT$ Million Inflows to: Outflows from: Public Private ROW Total - 140, 693 55 140, 748 39, 352 2, 154, 256 75, 053 2, 268, 661 ROW 4, 485 192, 336 - 196, 821 Total 43, 837 2, 487, 285 75, 108 2, 606, 230 Public Private Note: Outflows and inflows are both represented as positive values in this table.

Private Saving • NTA Saving is equivalent to private saving net of depreciation in SNA. • Saving does not include some economic flows that affect the value of assets owned: – Capital transfers, e. g. , bequests, dowry, and other large gifts – Holding gains, e. g. , asset price changes, wars, and natural disasters • A(t)= A(t-1) + S(t) + K transfers (t) + Holding gains (t) for any cohort

Age Profiles for Asset-based Flows • Difficult to assign asset-based flows to individuals – Assets are often jointly owned – Legal ownership and effective ownership may differ – Limited information from surveys • In NTA saving and asset-income are assigned to the age of the household head

Determining Age Profiles for Interest • Interest from business credit – Many private credit transactions involve financial transactions between firms, e. g. , between financial and non-financial institutions. – Inter-age flows may not arise from these transactions. NTA assumes that they do not. • Interest from consumer credit – Individuals borrow and lend to realize age reallocation objectives. – Role in age reallocations is limited because • Children cannot be held liable for debts • No natural private counterpart for funding retirement by accumulating credit during working years.
 do not generate")
Determining Age Profiles for Interest • Interest payments between firms (corporations) do not generate net interage flows in NTA. – Age profile of inflows and outflows are identical. – Interest flows between firms and public sector or ROW does lead to net interage flows. • Interest payments between consumers and firms do generate net interage flows. – Age profile of interest expense for consumers differs from the age profile of interest income for firms. – Consumer interest expense is approximated by interest outflows from households.

Sources for NTA Age Profiles Profile from income and expenditure survey NTA Profile Property income (Interest, dividends, rental income) Operating surplus (except households), property income inflows, property income outflows (except consumer interest) Self-employment income, income from family business Mixed income (capital’s share) Imputed rent from owner-occupied Operating surplus housing Interest expense Consumer Interest Outflow

Calculation of AR Flows • Per capita age profiles and population data are used to calculate the age distribution of each class of asset income. • Age distributions are combined with aggregate values to calculate asset income by age. • Saving by age is calculated as the residual, S(a)=T(a)+YA(a)-LCD(a); private saving is equal to total saving less public saving. • Check: S(a) must total to net private saving.

Summary of Technical Problems • Role of household head – Definitions vary across surveys • Most surveys use an economic definition, e. g. , principal earner. • Some surveys use a self-reported head concept. – Non-head members have asset-based flows that are assigned to the head – Estimates of asset-based mitigate these problems • Assignment of operating surplus – Household surveys include only the distributed earnings of corporations. – Methodology assumes that retained earnings has the same age profile as non-retained earnings. • Estimates at upper ages may be unreliable due to small number of observations.

Issues to Explore with Asset-based Reallocations • Do the elderly rely on assets to fund their retirement years? – Asset income – Dis-saving • Is the importance of asset-based reallocations changing over time? If so, why? – Changes in public transfer policy? – Decline in the extended family? – Changes in financial systems, interest rates, etc. ? • How are current generations of prime-age adults behaving? – Are their saving enough to meet their future retirement needs? – Are they accumulating too much debt to finance education, purchases of homes, and other consumer durables?
 • How important are bequests and other capital transfers relative to lifecycle")
Issues (continued) • How important are bequests and other capital transfers relative to lifecycle saving? • Do asset-based reallocations serve other important roles? Do people rely on assets to support their children, for example? • How is population aging interacting with assetbased reallocations to influence important macroeconomic trends? • How is the financial crisis affecting support systems and the economic circumstances of different generations?

Conclusions • Private asset-based reallocations bear on many issues. – Importance to solving lifecycle problems – Implications for intergenerational equity – Effects on macroeconomic performance • Interpret with care – Difficult to measure – Outcomes reflect complex behavior and historical patterns that differ widely across cohorts
 \"Asset-based")
Additional Materials • Andrew Mason, Naohiro Ogawa, Rikiya Matsukura, and Amonthep Chawla (forthcoming) "Asset-based Reallocations". NTA Working Paper. • Methodology writeup on the website: http: //www. ntaccounts. org/web/nta/show/Documents/Ass et-based%20 Reallocations • RA spreadsheet on the website: http: //www. ntaccounts. org/web/nta/show/Assetbased%20 reallocations
 \"Japan’s Unprecedented")
Acknowledgements • Naohiro Ogawa, Andrew Mason, Amonthep Chawla, and Rikiya Matsukura (2008) "Japan’s Unprecedented Aging and Changing Intergenerational Transfers". NTA Working Paper. Additional data at http: //www. ntaccounts. org. • Lee, Ronald, Sang-Hyop Lee, and Andrew Mason (2007) "Charting the Economic Life Cycle, " in Population Aging, Human Capital Accumulation, and Productivity Growth, Alexia Prskawetz, David E. Bloom, and Wolfgang Lutz, eds. , a supplement to Population and Development Review vol. 33. (New York: Population Council). Additional data at http: //www. ntaccounts. org. • Mason, Andrew, Ronald Lee, An-Chi Tung, Mun Sim Lai, and Tim Miller (forthcoming) “Population Aging and Intergenerational Transfers: Introducing Age into National Income Accounts, ” Developments in the Economics of Aging edited by David Wise (National Bureau of Economic Research: University of Chicago Press). Additional data at http: //www. ntaccounts. org.

The End

Public Asset-based Reallocations Amonthep Chawla

Outline • Overview of the Public Sector and Public Asset-based Reallocations • Implementation with Illustrative Values • Conclusions

The Public Sector • The public sector includes all inflows to and outflows from the general government. • Public enterprise is part of the private sector; however, the general government may receive property income from public enterprise.

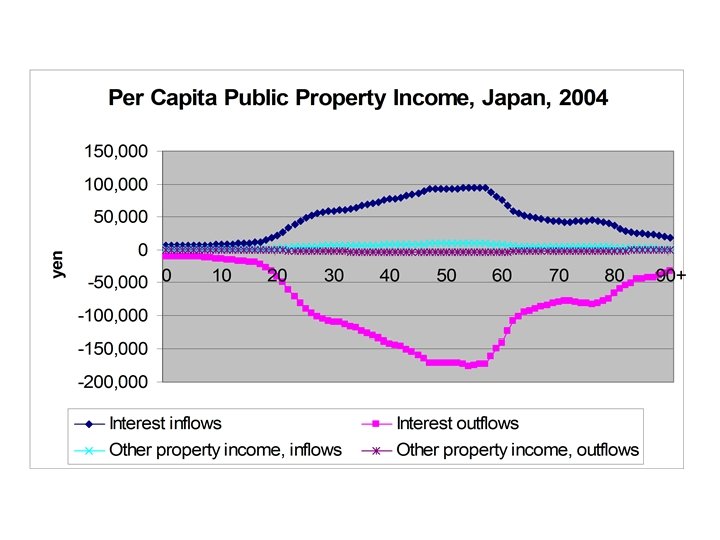
Public Asset-based Reallocations • Public assets generate interage flows between public asset income and public saving. • Public asset income includes public operating surplus and public property income. • Based on SNA, the public sector has no public capital income. • Public property income includes inflows from and outflows to the private sector and ROW.
 • The government saves when it acquires an asset")
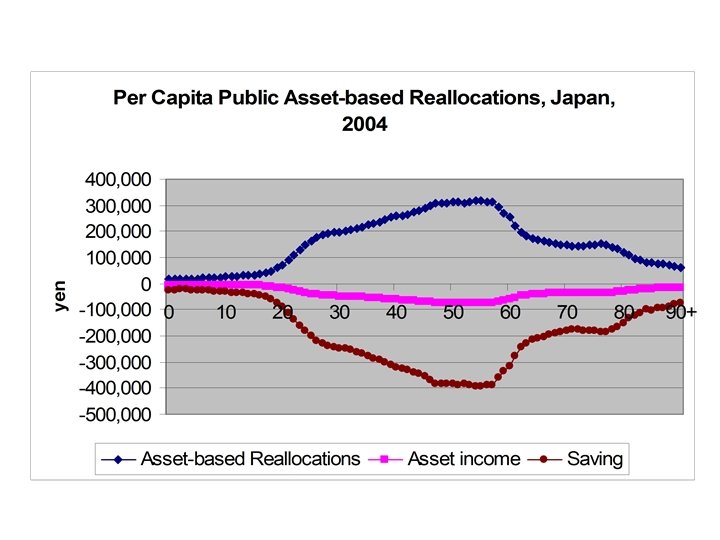
Public Asset-based Reallocations (cont. ) • The government saves when it acquires an asset or dispose of debt, generating an outflow • The government dis-saves when it dispose of an asset or acquires debt, generating an inflow. • Public saving is measured as the sum of public asset income and public transfer surplus/deficit.

Public Transfer Surplus/Deficit • Balancing item that insures that transfer outflows and inflows are equal • Relationship between transfer surplus/deficit and public saving – If taxes and grants exceed public transfer inflows, transfer surplus and public asset income are saved – if taxes and grants fall short of public transfer inflows, transfer deficit must be financed out of asset income with the residual saved

Estimation Methods • • Aggregate Controls: similar to private property income, public property income includes interest, rent, dividends and other less important components of property income. Age Profile: the age profiles of public property income (both inflows and outflows) and public saving follow the general tax profile.

Asset-base Reallocations for Japan: an Illustration Asset-based Reallocations, Japan, 2004, Aggregate, billion yen Total Age groups 0 -19 20 -29 30 -49 50 -64 65+ Public asset-based reallocations 22, 749 715 2, 456 8, 577 7, 643 3, 358 Public asset income -5, 458 -172 -589 -2, 058 -1, 834 -805 0 0 0 -5, 796 -182 -626 -2, 185 -1, 947 -855 Other property income, net 338 11 36 127 113 50 Less: Public saving -28, 207 -887 -3, 046 -10, 635 -9, 477 -4, 163 Capital income Public Interest, net

Summary • Taxes, public expenditures and public asset income determine how much resources are available for individuals to save through the public sector • Reallocations through public assets are one of major mechanisms that individuals at all age groups rely on to finance their lifecycle deficit
- Slides: 61