Assessment of Utahs Nonpoint Source control program Nancy


")


")

")

")

")


- Slides: 38
Assessment of Utah’s Nonpoint Source control program Nancy Mesner, Doug Jackson-Smith, Phaedra Budy, David Stevens Lorien Belton, Nira Salant, William Hochstedler, and Marshall Baillie Salt Lake County Watershed Symposium October 24, 2013
Project objectives 1. Program Review: Evaluate efficiency and effectiveness of Utah’s NPS Program 2. Assess the water quality impact and effectiveness of representative 319 -funded projects. 3. Assess long-term maintenance and impact of representative 319 -funded projects. .
Objective 1 Methods • Review of program documents • Review of grants, financial records • Structured interviews with key individuals
Award 319 funding $2 500 000 $2 000 $1 500 000 $1 000 $500 000 total EPA grant Total staff support (UDWQ and UDAF) 2012 2010 2008 2006 2004 2002 2000 1998 1996 1994 1992 1990 $0 implementation grants
Allocation of 319 grant funds in Utah from 2001 through 2010
Program strengths • Identification and focus on key water quality pollutants / stressors. • Local leadership provides flexibility to address local problems / solutions. • Watershed framework for TMDLs. • Recent modifications of funding cycles.
Objective 1. Key recommendations • Improve coordination with state / federal partners • Improve record keeping and management • Increase focus on urban runoff • Improve monitoring efforts to detect real impacts • Improve outreach - tell Utah’s “ 319 story”
Objectives 2 and 3 BMP effectiveness Focus on: animal waste irrigation grazing riparian – rural riparian – urban
COMPLETED EVALUATIONS Chalk Creek Middle Bear Beaver San Pitch Upper Sevier Animal Waste Irrigation Rural Riparian - 3 9 Upland grazing Total 7 4 8 - - 3 12 5 4 4 2 10 2 6 4 4 10 - 3 5 1 9 14 66 Jordan River Total BMP projects Urban Riparian 13 16 16 20 * = Seventeen interviews were done on farms that had implemented multiple types of BMPs. 13
Evaluation methods were all after the fact, using existing data Animal Waste Upland Rural Stream Urban Stream Irrigation LOCAL FILE REVIEW ● ● ● INTERVIEWS ● ● ● FIELDWORK Field visual assessment Repeat photo comparisons Proper Functioning Condition (PFC) ● Historic aerial photography ● Fish habitat suitability analysis ● WATERSHED MODELING Sensitivity analysis ● ●
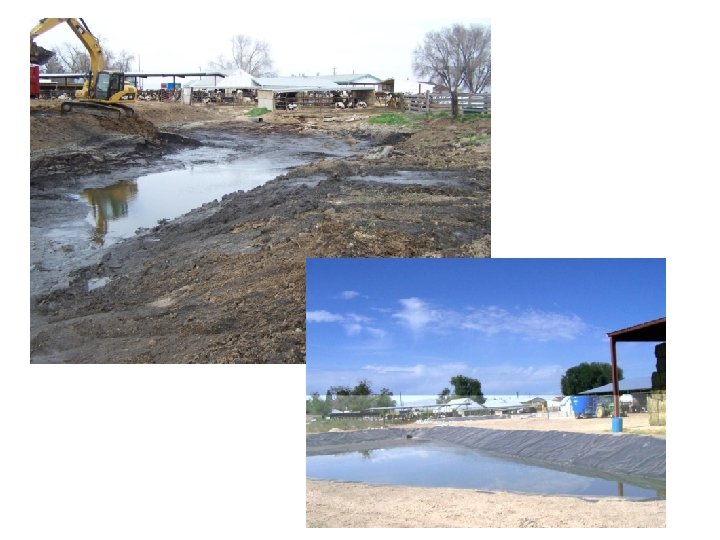
Animal waste BMPs (16 projects / 4 watersheds)
Animal waste BMPs • All still in place, generally functional • Containment of manure generally focused on P. • N impacts (especially on ground water) generally not addressed. • Numeric impacts relied on UAFRRI results – input data / assumptions poorly documented. • Little evidence that nutrient management plans or soil P tests guided manure spreading decisions
Implications of inaccurate assumptions about behavior changes Predicted TP in runoff assuming different scrape frequencies TP in runoff (pounds/year) 2500 2000 1500 1000 500 0 daily weekly monthly quarterly annually When using models to calculate or predict pollution reductions, carefully consider ALL the assumptions. Many of these are assumptions about changed behavior. What will happen to your prediction if the assumptions are not met? How will you know?
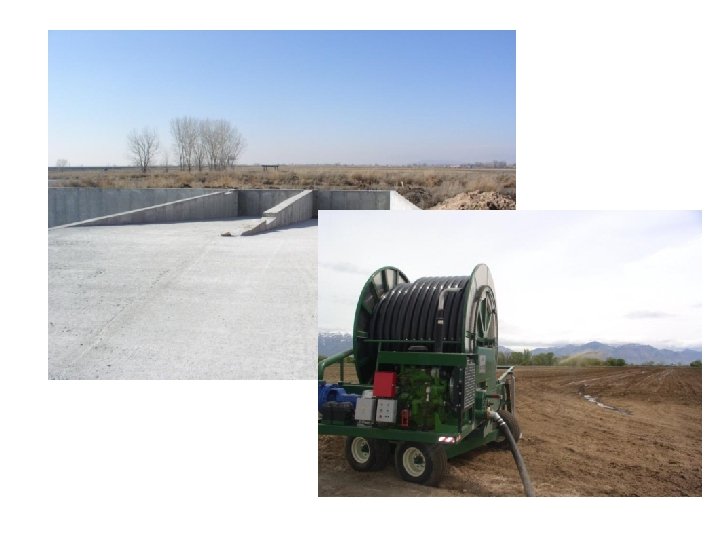
Irrigation BMPs (16 projects in 4 watersheds)
Irrigation BMPs • Operators overwhelmingly satisfied with operational benefits • Operators often unaware that funding was intended for wq improvement • Very little pre-project data prevented quantitative assessment of impacts.
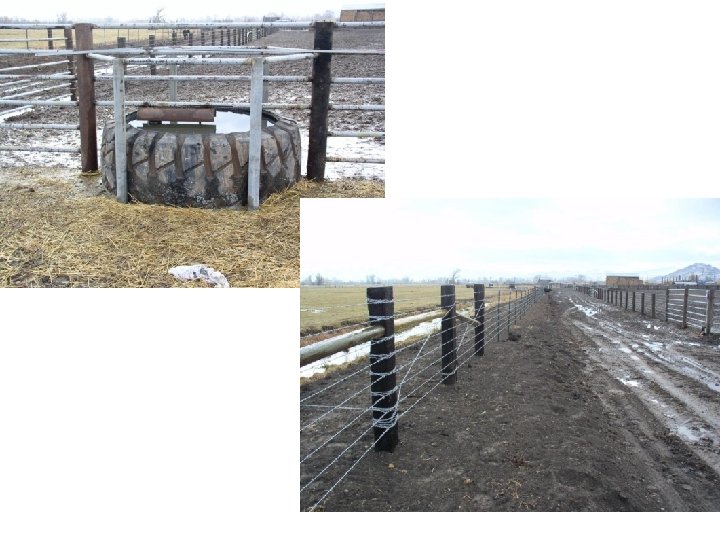
Upland Grazing BMPs (14 projects in 5 watersheds)
Upland grazing • Projects improved forage quality / availability • Greatest impact from projects directly linked to improved riparian zones or sediment capture / retention. • Few producers linked improved grazing management to wq goals.
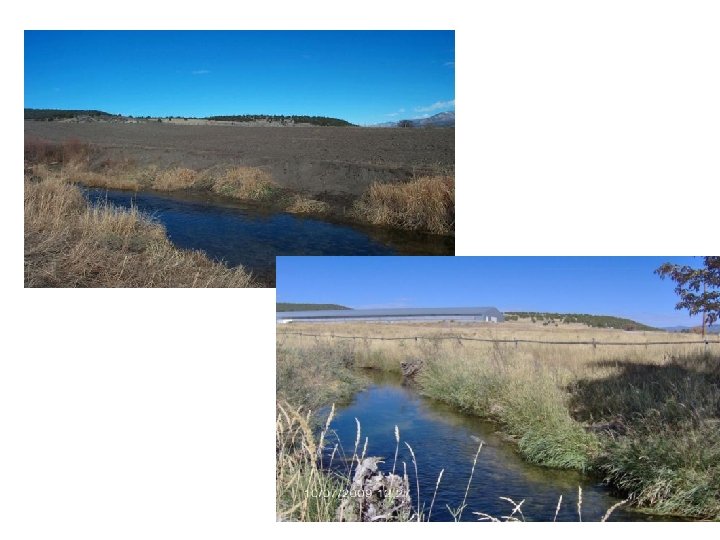
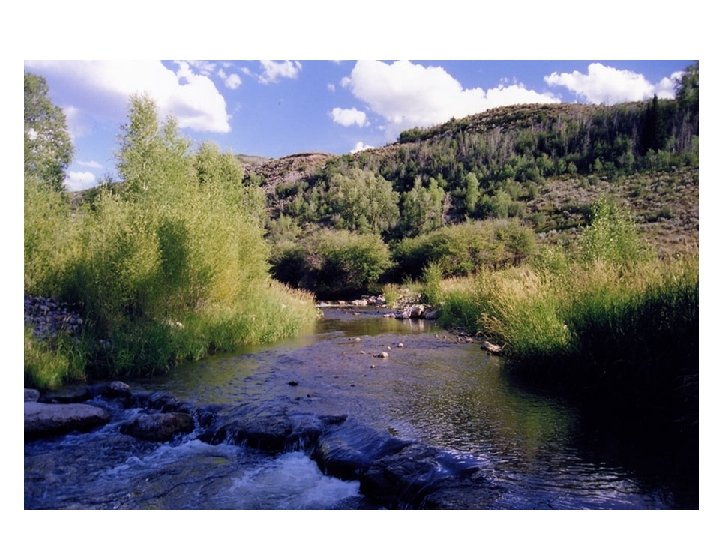
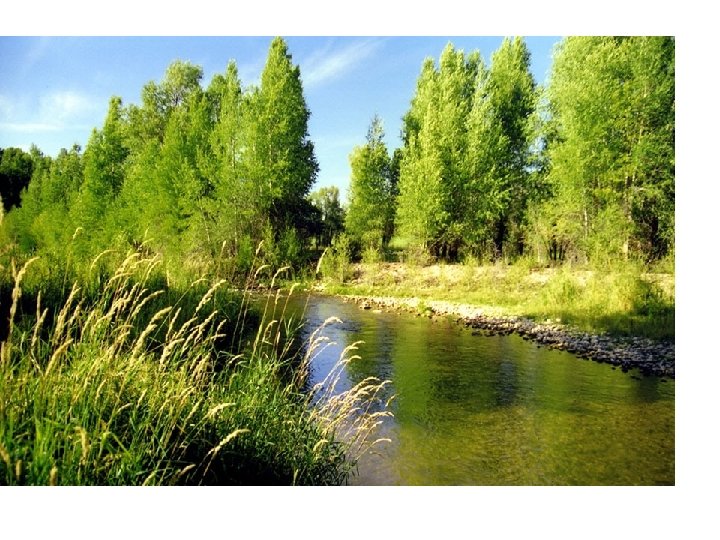
Rural Stream BMPs (20 projects in 4 watersheds)
Rural stream BMPs • Most still in place. Failures associated with extreme runoff events or planting failures. • Producers saw clear connection with BMP and wq impacts. • Different monitoring approaches addressed different objectives / scales
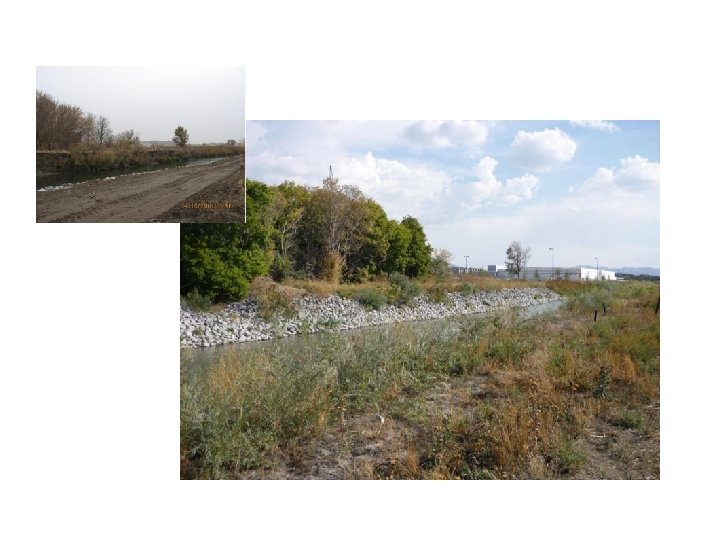
Urban stream BMPs (13 non-319 projects in 1 watersheds)
Urban stream BMPs • Successfully implemented and maintained. • Focus on reduced erosion and improved channel stability. • Unique challenges from constraints (built environment), different hydrology, different objectives
Landowner / manager perception of project value and impacts
Review team field assessments of water quality benefits of BMPs included in this study. Percent of BMPs evaluated in this study 70% 60% 50% 40% 30% 20% 10% 0% No Obvious Benefit Unlikely / Minimal Benefit Unclear Benefit Likely Benefit -10% Animal Waste Irrigation Upland Projects Stream Projects Definite Benefit
Objectives 2 and 3 Key results / recommendations • Most BMPs still in place and functional • Most BMPs appreciated by landowners • 60% likely or definitely produced wq improvements • 25 % likely had little impact on wq due to: - location of BMP - BMP targeted other goal (eg irrigation efficiency).
General Conclusions • More consistency in project files and record keeping • Collect and preserve pre-project condition data in all cases: – At a minimum, collect and preserve photo points, written descriptions of site specific conditions leading to wq impairment, and the plan that was followed. – Consider specific bmp objectives in establishing other monitoring / assessment protocols. – Keep technical and monitoring data with project files
General Conclusions • Most effective projects engaged landowners at multiple levels • We found high value and low value projects with all types of BMPs – those with little impact reflected poor implementation / planning decisions (location, design) • Even minimal post-implementation follow up reaps huge benefits.
1 A. Best Estimate of Total 319 -funded BMP Projects in Watershed (based on annual reports and file reviews) Animal Rural Upland Irrigation Waste Stream grazing Total Chalk Creek 8 12 11 31 Cub & Amalga/Benson 24 1 4 5 32 Beaver 4 9 8 11 32 San Pitch 1 15 6 11 33 Upper Sevier 8 16 1 25 Total 27 Chalk Creek Middle Bear Beaver San Pitch Upper Sevier 41 Animal Waste 9 5 2 - Jordan River Total BMP projects 16 46 39 153 COMPLETED EVALUATIONS Urban Rural Upland Irrigation Riparian grazing 3 7 4 3 4 4 2 6 4 4 3 5 1 13 16 20 13 14 * = Seventeen interviews were done on farms that had implemented multiple types of BMPs. Total 8 12 10 10 9 66
Field interviews / file inspection: current condition compared to expectations, landowner understanding, maintenance issues PFC Reach scale assessment, much more powerful with pre-project data Photo comparisons - many “pre-project” photos were of backhoes Historical aerial photos watershed scale, considerable background relative to BMP impacts HSI sensitive to each parameter.
Field interviews / file inspection: current condition compared to expectations, landowner understanding, maintenance issues PFC Reach scale assessment, much more powerful with pre-project data Photo comparisons - many “pre-project” photos were of backhoes Historical aerial photos watershed scale, considerable background relative to BMP impacts HSI sensitive to each parameter.
$2 500 000 $2 000 $1 500 000 $1 000 $500 000 19 91 19 92 19 93 19 94 19 95 19 96 19 97 19 98 19 99 20 00 20 01 20 02 20 03 20 04 20 05 20 06 20 07 20 08 20 09 20 10 $0 Total EPA grant Staff and Support Annual 319 grants to Utah Contracts