
ASSESSMENT OF FDI ATTRACTIVENESS AN ANALYTIC HIERARCHY PROCESS


- Slides: 20
ASSESSMENT OF FDI ATTRACTIVENESS: AN ANALYTIC HIERARCHY PROCESS (AHP) APPROACH SERCIN SAHIN Yıldız Technical University, Department of Economics sercinsahin@hotmail. com ÖZGÜR ŞENER İstanbul Technical University, Department of Industrial Engineering thesener@yahoo. com
Overview of the presentation n n n Overview of Foreign Direct Investment Data: UNCTAD FDI Variables Method: Analytic Hierarchy Process (AHP) Results Conclusion Further Suggestions
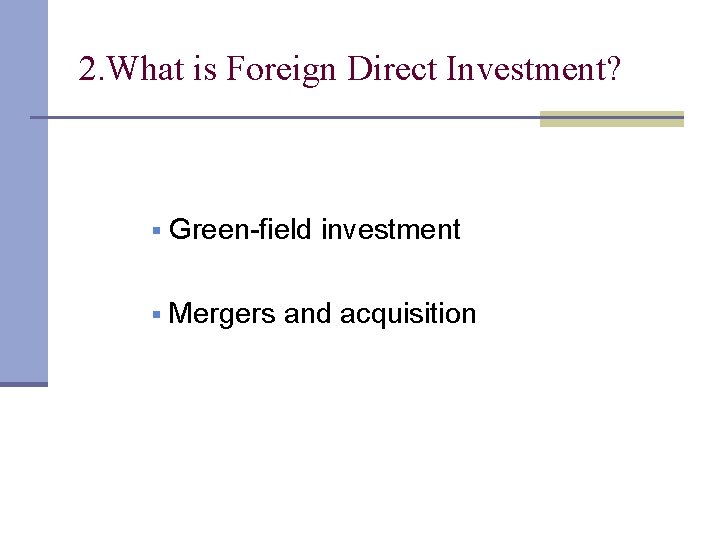
2. What is Foreign Direct Investment? § Green-field investment § Mergers and acquisition
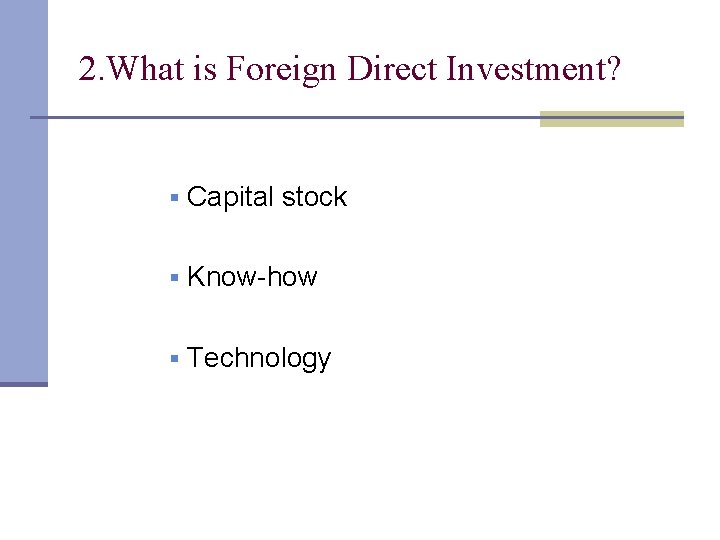
2. What is Foreign Direct Investment? § Capital stock § Know-how § Technology
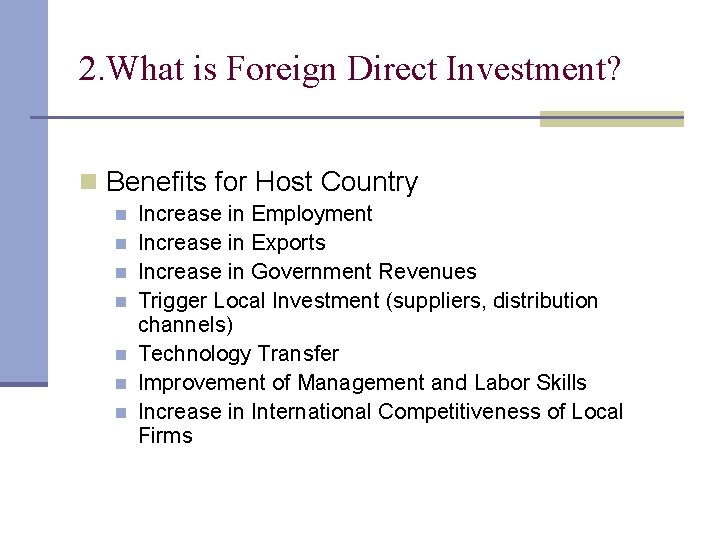
2. What is Foreign Direct Investment? n Benefits for Host Country n n n n Increase in Employment Increase in Exports Increase in Government Revenues Trigger Local Investment (suppliers, distribution channels) Technology Transfer Improvement of Management and Labor Skills Increase in International Competitiveness of Local Firms
3. Data: UNCTAD FDI Variables UNCTAD United Nations Conference on Trade and Development
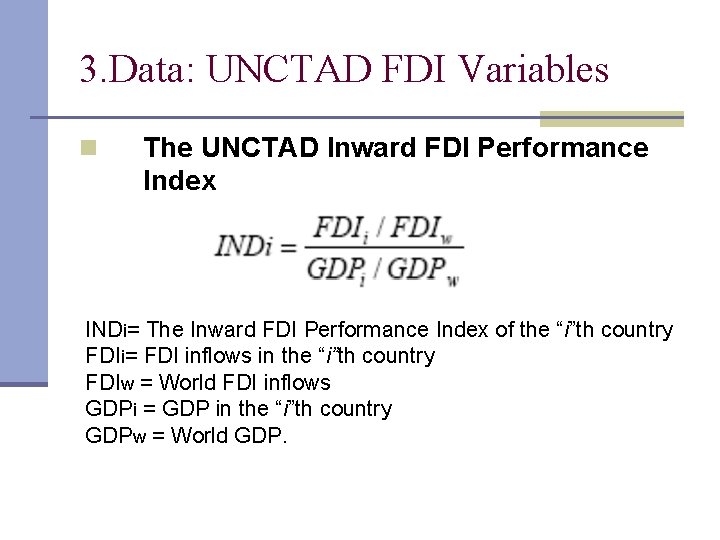
3. Data: UNCTAD FDI Variables n The UNCTAD Inward FDI Performance Index INDi= The Inward FDI Performance Index of the “i”th country FDIi= FDI inflows in the “i”th country FDIw = World FDI inflows GDPi = GDP in the “i”th country GDPw = World GDP.
3. Data: UNCTAD FDI Variables The UNCTAD Inward FDI Potential Index is the unweighted average of the scores on twelve variables (Independent Variables) for each country.
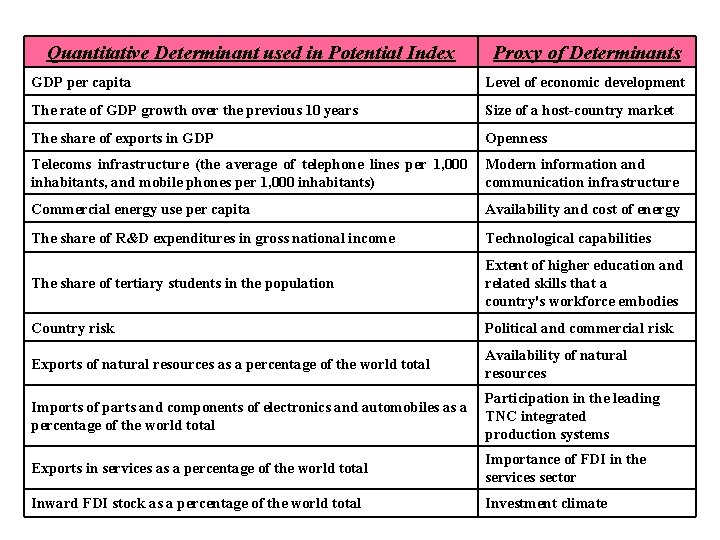
Quantitative Determinant used in Potential Index Proxy of Determinants GDP per capita Level of economic development The rate of GDP growth over the previous 10 years Size of a host-country market The share of exports in GDP Openness Telecoms infrastructure (the average of telephone lines per 1, 000 Modern information and inhabitants, and mobile phones per 1, 000 inhabitants) communication infrastructure Commercial energy use per capita Availability and cost of energy The share of R&D expenditures in gross national income Technological capabilities The share of tertiary students in the population Extent of higher education and related skills that a country's workforce embodies Country risk Political and commercial risk Exports of natural resources as a percentage of the world total Availability of natural resources Participation in the leading Imports of parts and components of electronics and automobiles as a TNC integrated percentage of the world total production systems Exports in services as a percentage of the world total Importance of FDI in the services sector Inward FDI stock as a percentage of the world total Investment climate
4. Method: Analytic Hierarchy Process (AHP) §A multi criteria decision making method §Designed by Saaty(1980).
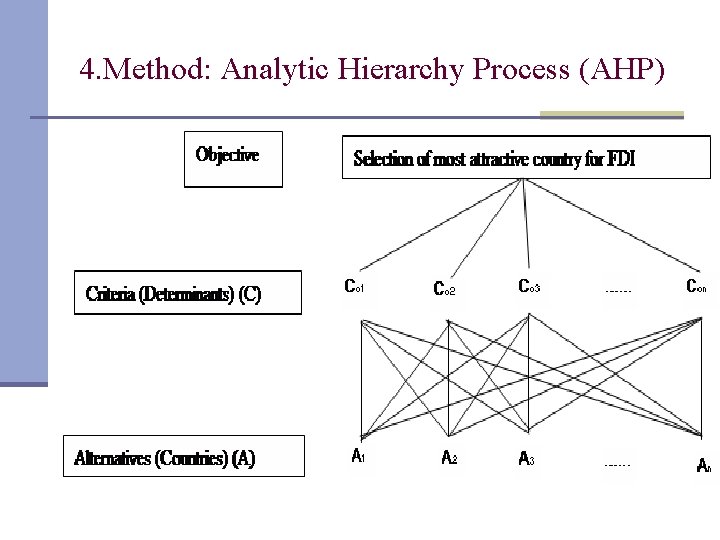
4. Method: Analytic Hierarchy Process (AHP)
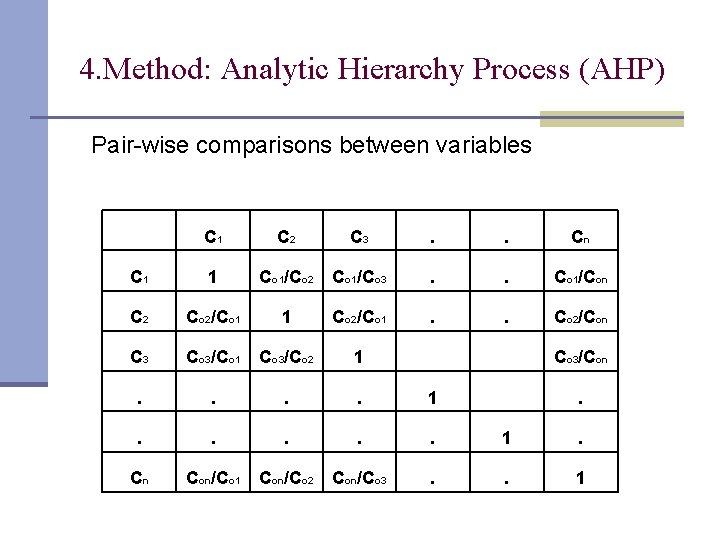
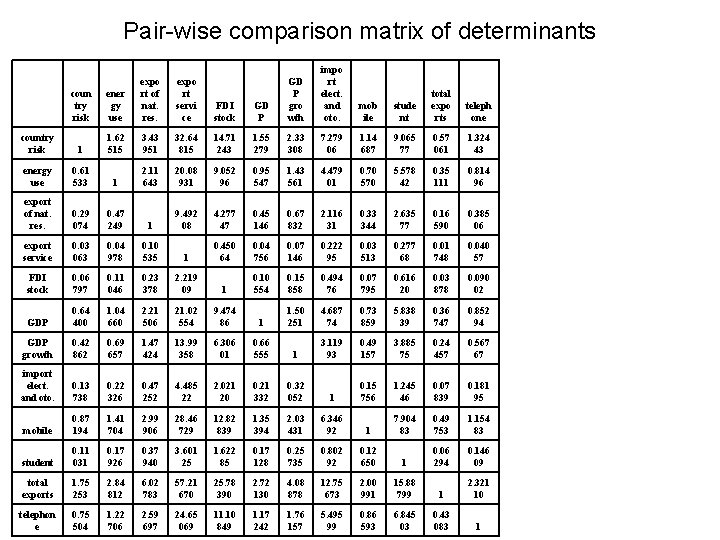
4. Method: Analytic Hierarchy Process (AHP) Pair-wise comparisons between variables C 1 C 2 C 3 . . Cn C 1 1 Co 1/Co 2 Co 1/Co 3 . . Co 1/Con C 2 Co 2/Co 1 1 Co 2/Co 1 . . Co 2/Con C 3 Co 3/Co 1 Co 3/Co 2 1 Co 3/Con . . 1 . . . 1 . Cn Con/Co 1 . . 1 Con/Co 2 Con/Co 3
Correlations between “UNCTAD Inward FDI Performance Index” and “FDI determinants that are used to calculate “UNCTAD FDI Potential Index (Criterion)
Pair-wise comparison matrix of determinants expo rt servi ce FDI stock GD P gro wth impo rt elect. and oto. mob ile stude nt total expo rts teleph one coun try risk ener gy use expo rt of nat. res. country risk 1 1. 62 515 3. 43 951 32. 64 815 14. 71 243 1. 55 279 2. 33 308 7. 279 06 1. 14 687 9. 065 77 0. 57 061 1. 324 43 energy use 0. 61 533 1 2. 11 643 20. 08 931 9. 052 96 0. 95 547 1. 43 561 4. 479 01 0. 70 5. 578 42 0. 35 111 0. 814 96 export of nat. res. 0. 29 074 0. 47 249 1 9. 492 08 4. 277 47 0. 45 146 0. 67 832 2. 116 31 0. 33 344 2. 635 77 0. 16 590 0. 385 06 export service 0. 03 063 0. 04 978 0. 10 535 1 0. 450 64 0. 04 756 0. 07 146 0. 222 95 0. 03 513 0. 277 68 0. 01 748 0. 040 57 FDI stock 0. 06 797 0. 11 046 0. 23 378 2. 219 09 1 0. 10 554 0. 15 858 0. 494 76 0. 07 795 0. 616 20 0. 03 878 0. 090 02 GDP 0. 64 400 1. 04 660 2. 21 506 21. 02 554 9. 474 86 1 1. 50 251 4. 687 74 0. 73 859 5. 838 39 0. 36 747 0. 852 94 GDP growth 0. 42 862 0. 69 657 1. 47 424 13. 99 358 6. 306 01 0. 66 555 1 3. 119 93 0. 49 157 3. 885 75 0. 24 457 0. 567 67 import elect. and oto. 0. 13 738 0. 22 326 0. 47 252 4. 485 22 2. 021 20 0. 21 332 052 1 0. 15 756 1. 245 46 0. 07 839 0. 181 95 mobile 0. 87 194 1. 41 704 2. 99 906 28. 46 729 12. 82 839 1. 35 394 2. 03 431 6. 346 92 1 7. 904 83 0. 49 753 1. 154 83 student 0. 11 031 0. 17 926 0. 37 940 3. 601 25 1. 622 85 0. 17 128 0. 25 735 0. 802 92 0. 12 650 1 0. 06 294 0. 146 09 total exports 1. 75 253 2. 84 812 6. 02 783 57. 21 670 25. 78 390 2. 72 130 4. 08 878 12. 75 673 2. 00 991 15. 88 799 1 2. 321 10 telephon e 0. 75 504 1. 22 706 2. 59 697 24. 65 069 11. 10 849 1. 17 242 1. 76 157 5. 495 99 0. 86 593 6. 845 03 0. 43 083 1
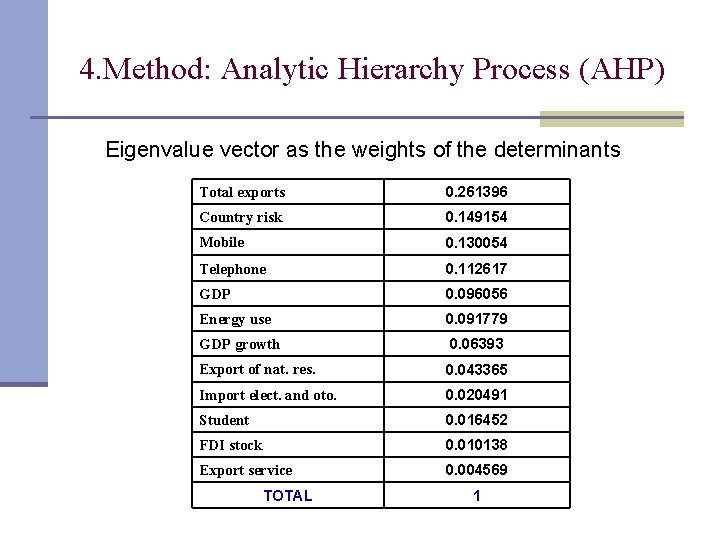
4. Method: Analytic Hierarchy Process (AHP) Eigenvalue vector as the weights of the determinants Total exports 0. 261396 Country risk 0. 149154 Mobile 0. 130054 Telephone 0. 112617 GDP 0. 096056 Energy use 0. 091779 GDP growth 0. 06393 Export of nat. res. 0. 043365 Import elect. and oto. 0. 020491 Student 0. 016452 FDI stock 0. 010138 Export service 0. 004569 TOTAL 1
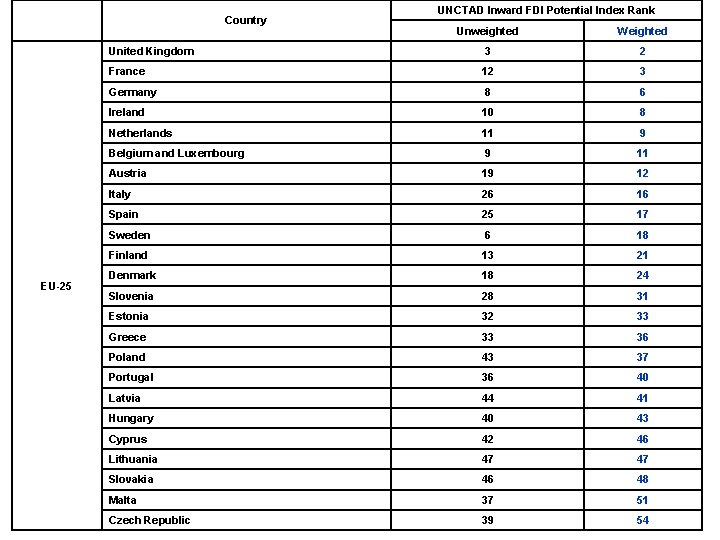
Country EU-25 UNCTAD Inward FDI Potential Index Rank Unweighted Weighted United Kingdom 3 2 France 12 3 Germany 8 6 Ireland 10 8 Netherlands 11 9 Belgium and Luxembourg 9 11 Austria 19 12 Italy 26 16 Spain 25 17 Sweden 6 18 Finland 13 21 Denmark 18 24 Slovenia 28 31 Estonia 32 33 Greece 33 36 Poland 43 37 Portugal 36 40 Latvia 44 41 Hungary 40 43 Cyprus 42 46 Lithuania 47 47 Slovakia 46 48 Malta 37 51 Czech Republic 39 54
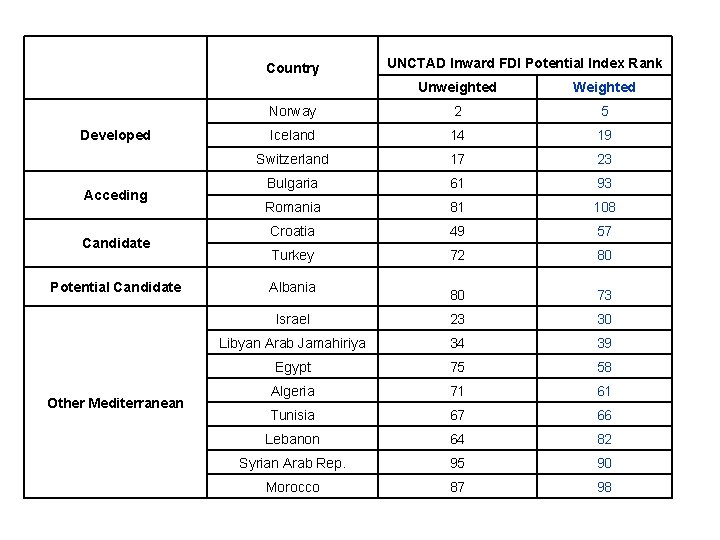
Country Unweighted Weighted Norway 2 5 Iceland 14 19 Switzerland 17 23 Bulgaria 61 93 Romania 81 108 Croatia 49 57 Turkey 72 80 80 73 Israel 23 30 Libyan Arab Jamahiriya 34 39 Egypt 75 58 Algeria 71 61 Tunisia 67 66 Lebanon 64 82 Syrian Arab Rep. 95 90 Morocco 87 98 Developed Acceding Candidate Potential Candidate Other Mediterranean UNCTAD Inward FDI Potential Index Rank Albania
5. Conclusions n In this study it is not attempted to define what are the true determinants of FDI. n But rather tried to weight the determinants which are used to compute UNCTAD’s FDI Inward Potential Index to make the analysis more reliable n And AHP may be an appropriate technique for weighting the determinants.
6. Further Suggestions n Proxies which UNCTAD uses may not indicate the real FDI potential of the countries. Therefore, some other variables should be added to make the analysis more accurate: n n n Tax rates Labor and energy costs, Incentives Property rights Corruption, etc.
GRAZIE