
Assessing the Vulnerability of Agriculture to Climate Change
Assessing the Vulnerability of Agriculture to Climate Change in Botswana Part of "Strategies for Adapting to Climate Change in Rural Sub-Saharan Africa: Targeting the Most Vulnerable", funded by BMZ Presented by P. Zhou, T. Simbini and G, Ramokgotlwane EECG
EECG PROFILE � MOSTLY WORKING IN ENERGY AND ENVIORNMENT INCLDUING CLIMATE CHANGE. SINCE 1993. � FOR CLIMATE CHANGE WORK IN ALL ASPECTS- EMISSIONS, IMPACTS AND MITIGATION � WE SUPPORT NATIONAL CC ACTIVITIES- E. G. FIRST NATIONAL COMMUNICATION. ON IMPACTS DID THE WATER SECTOR � MANAGED AND PARTICIPATED IN REGION CC PROJECTS- E. G. ESKOM CC RESEARCH PROGRAMME, CARBON PROJECT DEVELOPMENT AND MITIGATION MLODELLING IN OTHER AFRICAN COUNTRIES � NOW HELPING MOZAMBIQUE DEVLOP THEIR CC MAINSTREAMING AND CAPACITY BUILDING PROGRAMME � WE ARE SMALL BUT SURVIVE ON PARTNERSHIPS WITH OTHER REGIONAL CENTRES AND ASSOCIATE CONSULTANTS � CORE PRODUCERS OF THE REPORT TICH SIMBINI AND GORATA RAMOKGOTLWANE AND TS WILL MAKE THE PRESENTATION � ACKNWOLEDGE UPFRONT THE INPUTS MADE BY IFPRI-WHO MADE ALL THE MODELLING RESULTS
�Project Background �Objectives �Review of Current Situation and trends �Review of Land Use, Potential, and Limitations �Institutional Policy, Programs and Strategies �Scenarios for the Future �Agricultural Outcomes �Conclusions
�This study is part of a Southern Africa Development Community (SADC) project commissioned by the Food, Agriculture and Natural Resources Policy Analysis Network (FANRPAN) and the International Food Policy Research Institute (IFPRI).
�To assess the region’s vulnerability of Agriculture to climate change with special emphasis being placed on the poor.

Review of Current Situation and Trends
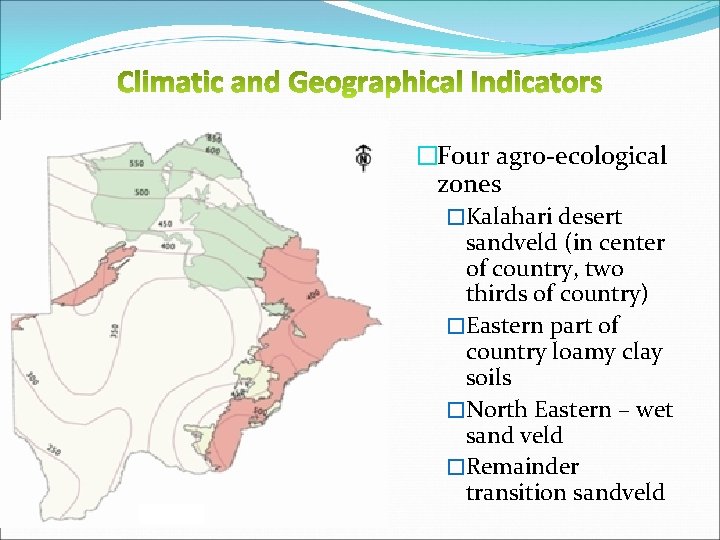
�Four agro-ecological zones �Kalahari desert sandveld (in center of country, two thirds of country) �Eastern part of country loamy clay soils �North Eastern – wet sand veld �Remainder transition sandveld
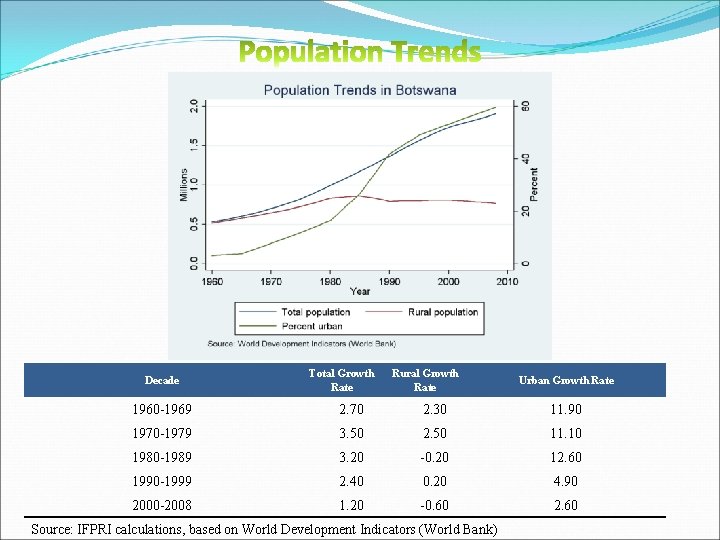
Decade Total Growth Rate Rural Growth Rate Urban Growth Rate 1960 -1969 2. 70 2. 30 11. 90 1970 -1979 3. 50 2. 50 11. 10 1980 -1989 3. 20 -0. 20 12. 60 1990 -1999 2. 40 0. 20 4. 90 2000 -2008 1. 20 -0. 60 2. 60 Source: IFPRI calculations, based on World Development Indicators (World Bank)
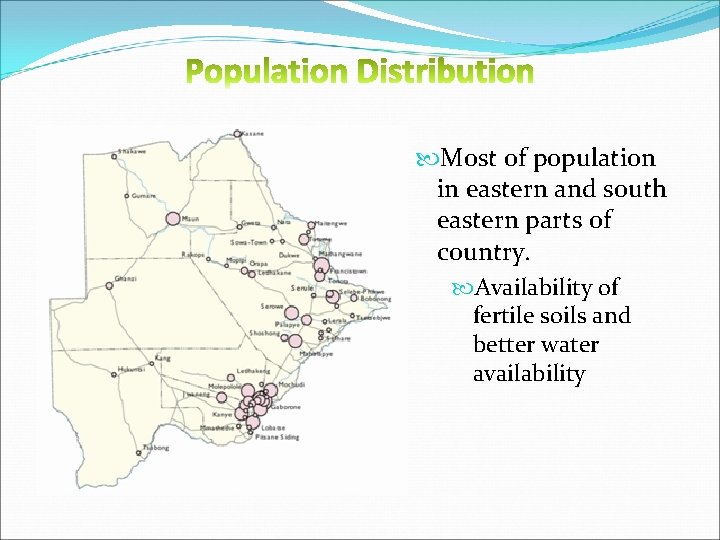
Most of population in eastern and south eastern parts of country. Availability of fertile soils and better water availability
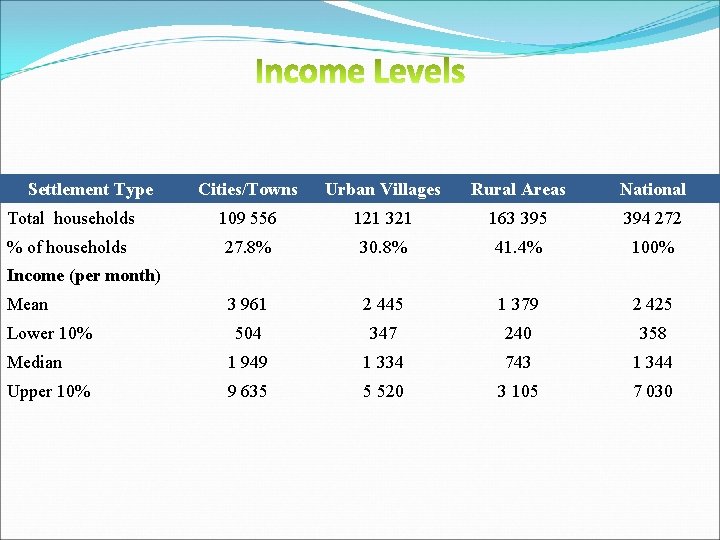
Settlement Type Cities/Towns Urban Villages Rural Areas National Total households 109 556 121 321 163 395 394 272 % of households 27. 8% 30. 8% 41. 4% 100% 3 961 2 445 1 379 2 425 504 347 240 358 Median 1 949 1 334 743 1 344 Upper 10% 9 635 5 520 3 105 7 030 Income (per month) Mean Lower 10%
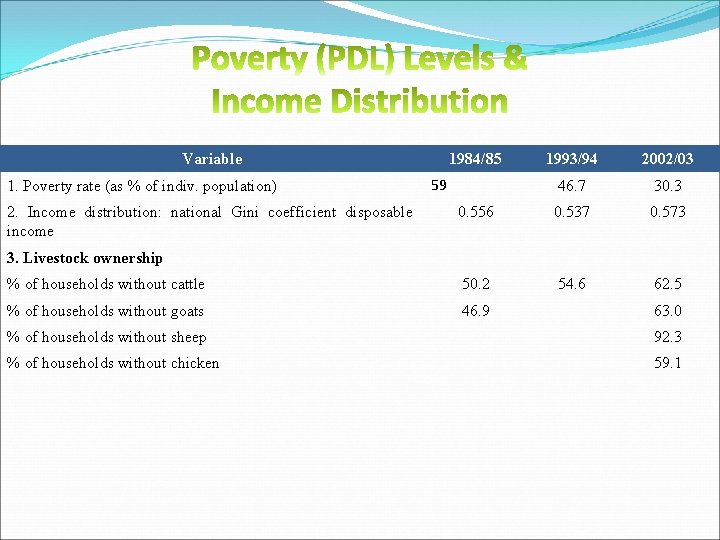
Variable 1993/94 2002/03 46. 7 30. 3 0. 556 0. 537 0. 573 % of households without cattle 50. 2 54. 6 62. 5 % of households without goats 46. 9 1. Poverty rate (as % of indiv. population) 2. Income distribution: national Gini coefficient disposable income 1984/85 59 3. Livestock ownership 63. 0 % of households without sheep 92. 3 % of households without chicken 59. 1
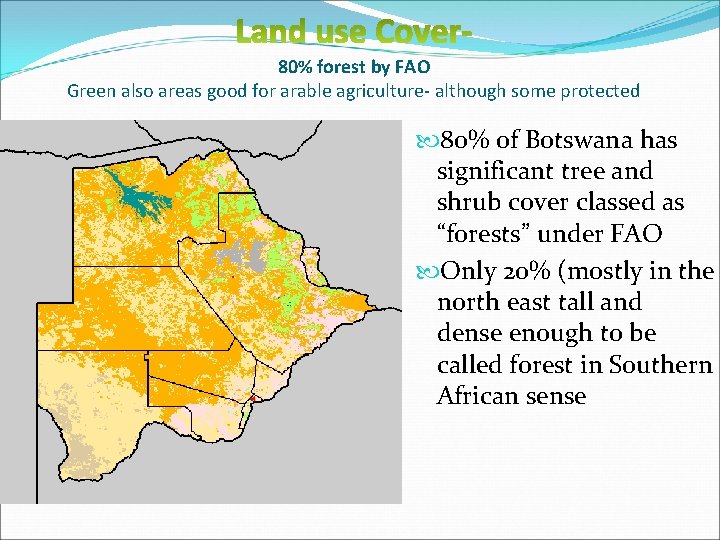
80% forest by FAO Green also areas good for arable agriculture- although some protected 80% of Botswana has significant tree and shrub cover classed as “forests” under FAO Only 20% (mostly in the north east tall and dense enough to be called forest in Southern African sense
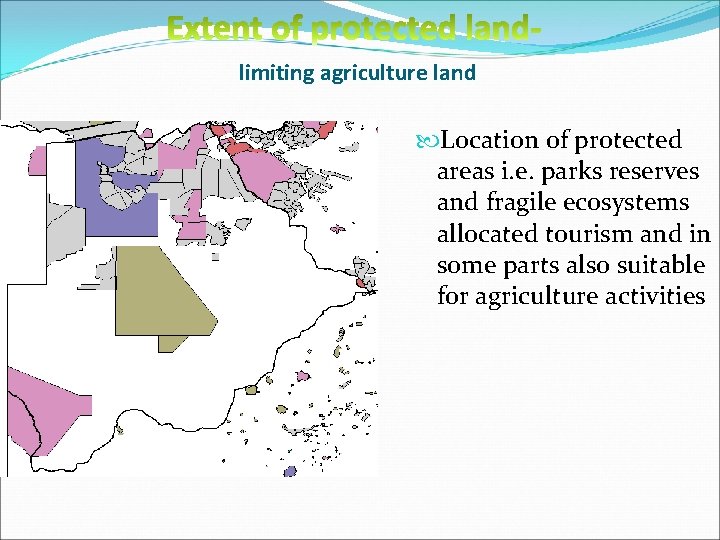
limiting agriculture land Location of protected areas i. e. parks reserves and fragile ecosystems allocated tourism and in some parts also suitable for agriculture activities
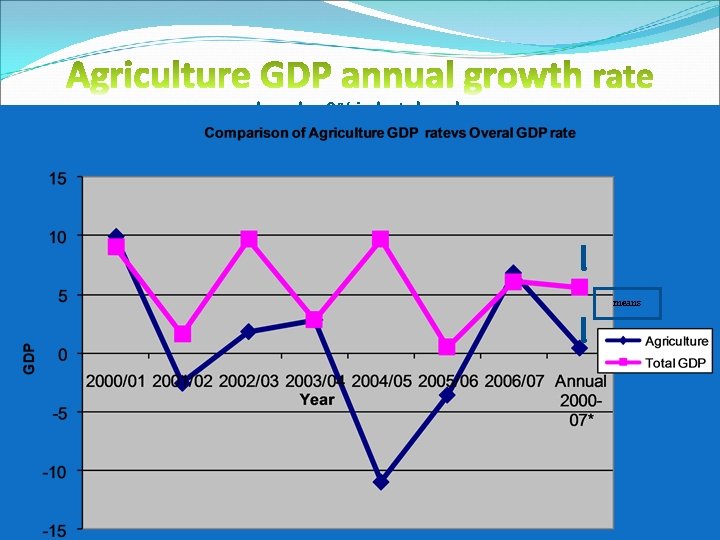
-largely <0% in last decade means
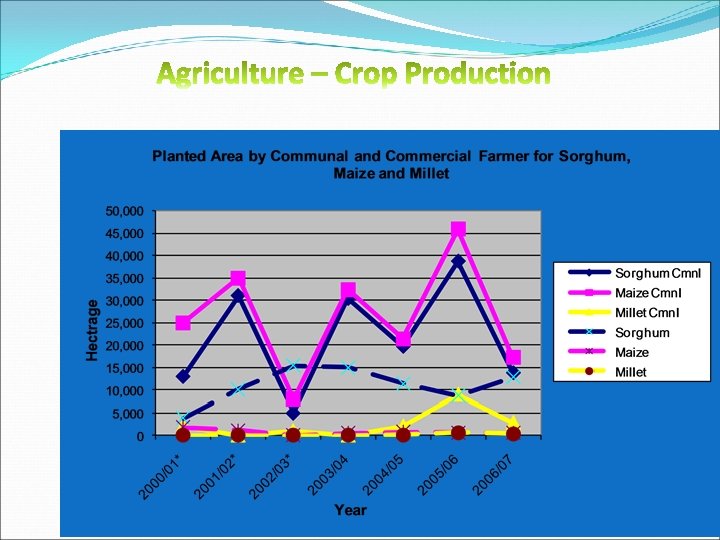
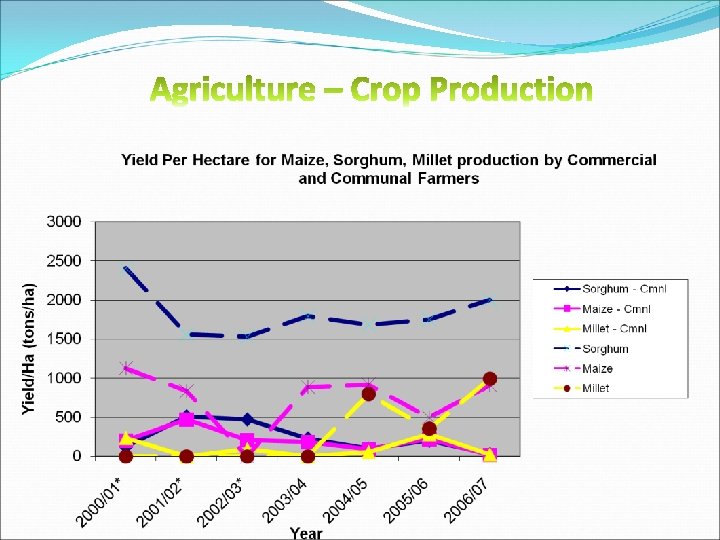
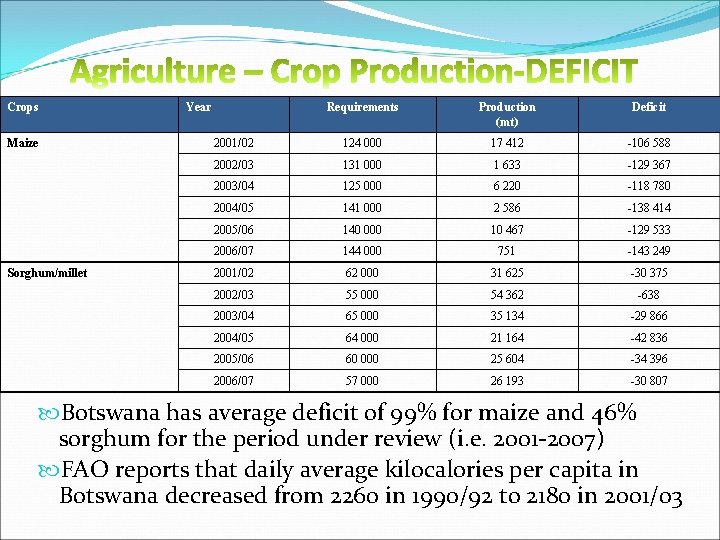
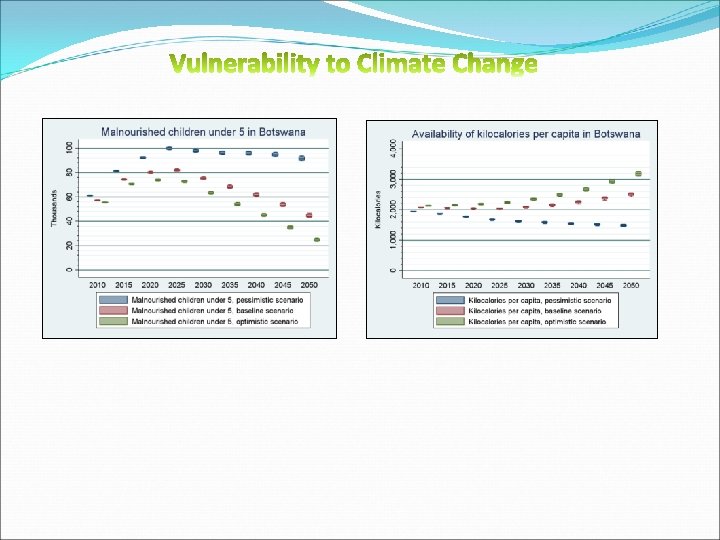
Crops Maize Sorghum/millet Year Requirements Production (mt) Deficit 2001/02 124 000 17 412 -106 588 2002/03 131 000 1 633 -129 367 2003/04 125 000 6 220 -118 780 2004/05 141 000 2 586 -138 414 2005/06 140 000 10 467 -129 533 2006/07 144 000 751 -143 249 2001/02 62 000 31 625 -30 375 2002/03 55 000 54 362 -638 2003/04 65 000 35 134 -29 866 2004/05 64 000 21 164 -42 836 2005/06 60 000 25 604 -34 396 2006/07 57 000 26 193 -30 807 Botswana has average deficit of 99% for maize and 46% sorghum for the period under review (i. e. 2001 -2007) FAO reports that daily average kilocalories per capita in Botswana decreased from 2260 in 1990/92 to 2180 in 2001/03
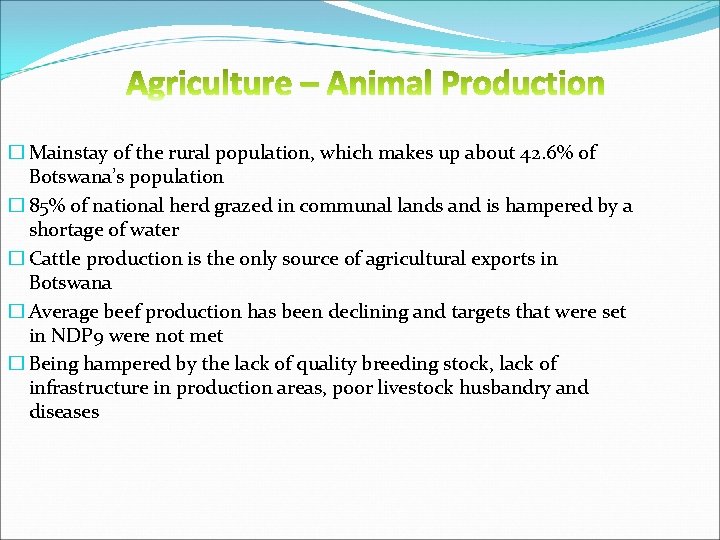
� Mainstay of the rural population, which makes up about 42. 6% of Botswana’s population � 85% of national herd grazed in communal lands and is hampered by a shortage of water � Cattle production is the only source of agricultural exports in Botswana � Average beef production has been declining and targets that were set in NDP 9 were not met � Being hampered by the lack of quality breeding stock, lack of infrastructure in production areas, poor livestock husbandry and diseases
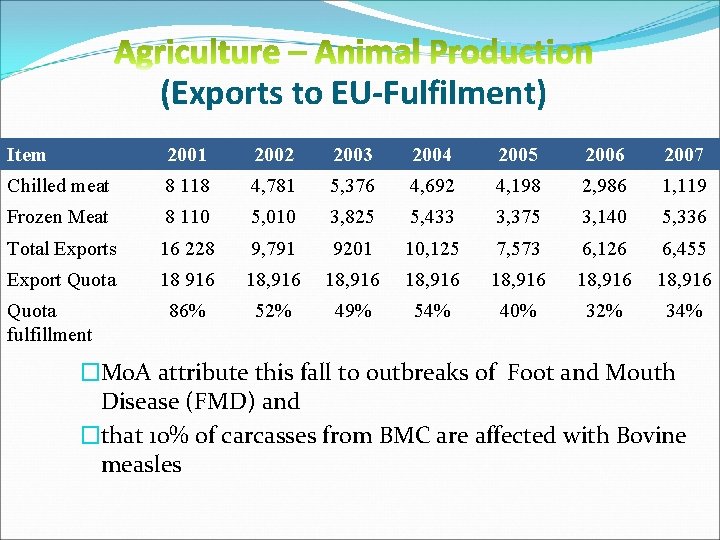
(Exports to EU-Fulfilment) Item 2001 2002 2003 2004 2005 2006 2007 Chilled meat 8 118 4, 781 5, 376 4, 692 4, 198 2, 986 1, 119 Frozen Meat 8 110 5, 010 3, 825 5, 433 3, 375 3, 140 5, 336 Total Exports 16 228 9, 791 9201 10, 125 7, 573 6, 126 6, 455 Export Quota 18 916 18, 916 18, 916 86% 52% 49% 54% 40% 32% 34% Quota fulfillment �Mo. A attribute this fall to outbreaks of Foot and Mouth Disease (FMD) and �that 10% of carcasses from BMC are affected with Bovine measles
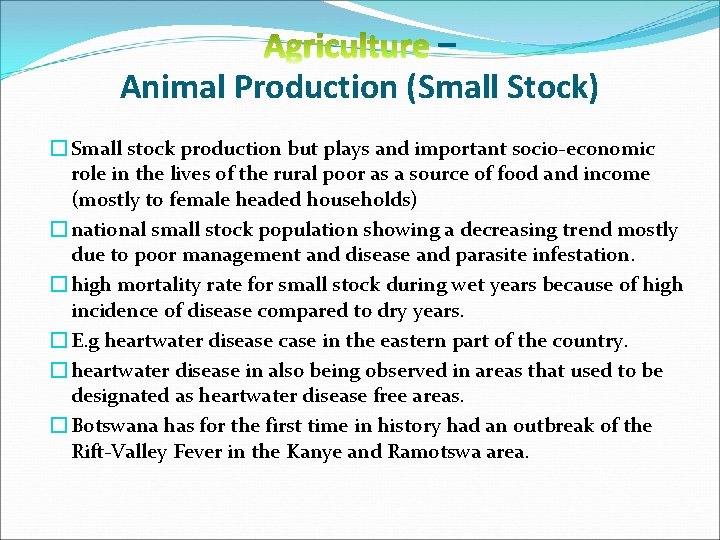
– Animal Production (Small Stock) � Small stock production but plays and important socio-economic role in the lives of the rural poor as a source of food and income (mostly to female headed households) � national small stock population showing a decreasing trend mostly due to poor management and disease and parasite infestation. � high mortality rate for small stock during wet years because of high incidence of disease compared to dry years. � E. g heartwater disease case in the eastern part of the country. � heartwater disease in also being observed in areas that used to be designated as heartwater disease free areas. � Botswana has for the first time in history had an outbreak of the Rift-Valley Fever in the Kanye and Ramotswa area.
Institutional Policy, Programs and Strategies � Institutional Policy, Programs and Strategies that were reviewed include � Vision 2016 � NDP 9 � Integrated Support Programme for Arable Agriculture Development (ISPAAD) � Livestock Management and Infrastructure Development Programme Phase 1 (LIMID) � National Master Plan for Arable Agriculture and Dairy Development (NAMPAADD) � Gender Policy � Botswana’s Agricultural Policy: Critical Sectoral Issues and Future Strategy for Development � Diseases of Animal Act 1977 � Revised National Food Strategy � Programs in Support of Public Goods (Rural Infrastructure, Agricultural Research)
Scenarios for the Future �Changes in mean annual precipitation for SSA and Botswana between 2000 and 2050 �Changes in normal annual maximum temperature for Botswana between 2000 and 2050 �Yield change map under climate change: rainfed maize in Botswana �Yield change map under climate change: rainfed sorghum in Botswana
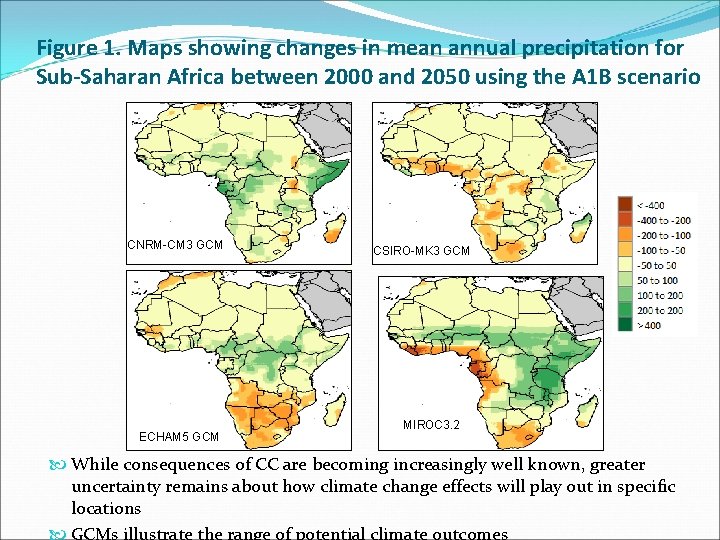
Figure 1. Maps showing changes in mean annual precipitation for Sub-Saharan Africa between 2000 and 2050 using the A 1 B scenario CNRM-CM 3 GCM ECHAM 5 GCM CSIRO-MK 3 GCM MIROC 3. 2 While consequences of CC are becoming increasingly well known, greater uncertainty remains about how climate change effects will play out in specific locations GCMs illustrate the range of potential climate outcomes
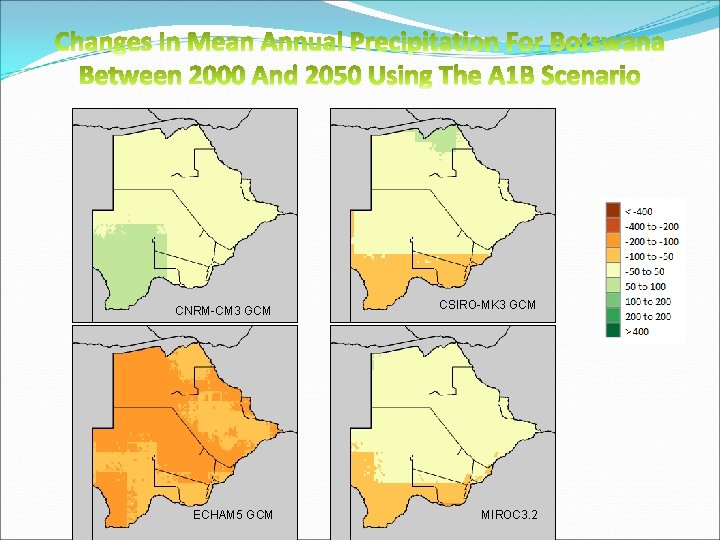
CNRM-CM 3 GCM CSIRO-MK 3 GCM ECHAM 5 GCM MIROC 3. 2
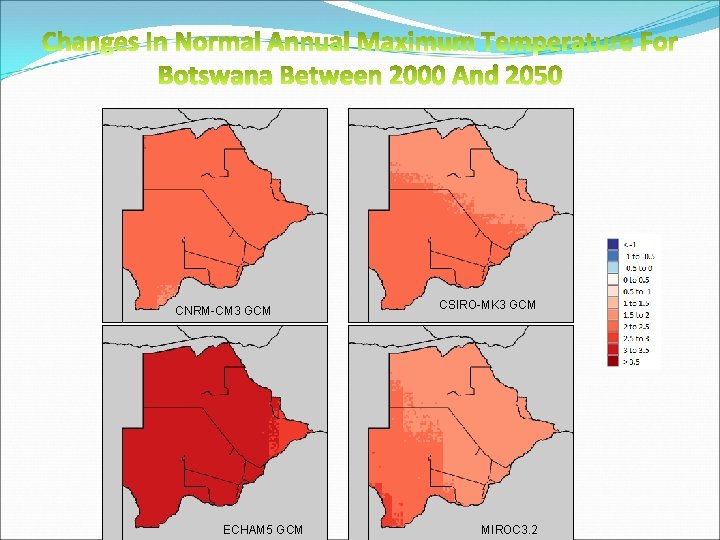
CNRM-CM 3 GCM ECHAM 5 GCM CSIRO-MK 3 GCM MIROC 3. 2
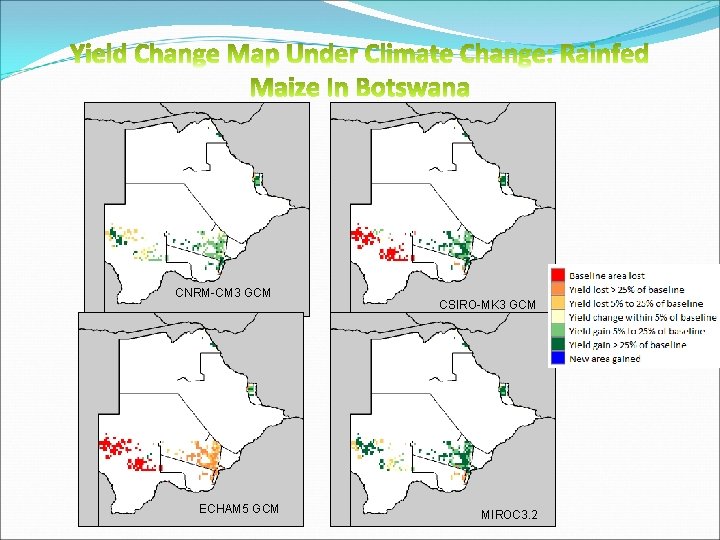
CNRM-CM 3 GCM ECHAM 5 GCM CSIRO-MK 3 GCM MIROC 3. 2
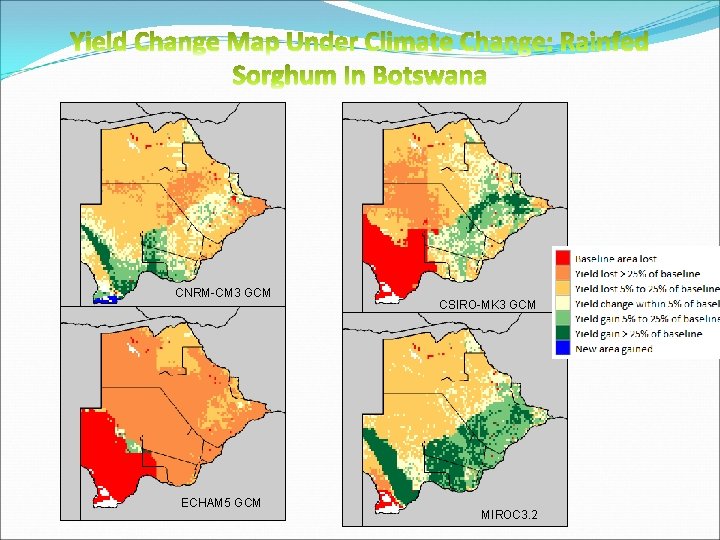
CNRM-CM 3 GCM ECHAM 5 GCM CSIRO-MK 3 GCM MIROC 3. 2
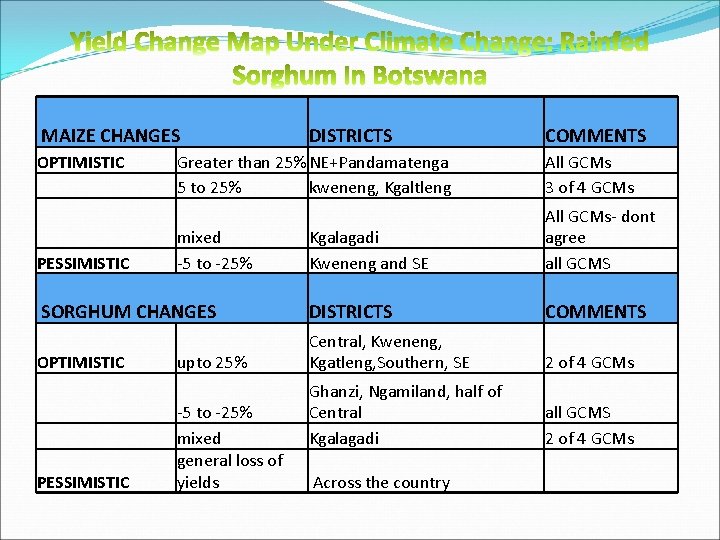
MAIZE CHANGES OPTIMISTIC DISTRICTS COMMENTS Greater than 25% NE+Pandamatenga 5 to 25% kweneng, Kgaltleng All GCMs 3 of 4 GCMs mixed -5 to -25% Kgalagadi Kweneng and SE All GCMs- dont agree all GCMS SORGHUM CHANGES DISTRICTS COMMENTS OPTIMISTIC Central, Kweneng, Kgatleng, Southern, SE 2 of 4 GCMs Ghanzi, Ngamiland, half of Central Kgalagadi all GCMS 2 of 4 GCMs Across the country PESSIMISTIC upto 25% -5 to -25% mixed general loss of yields
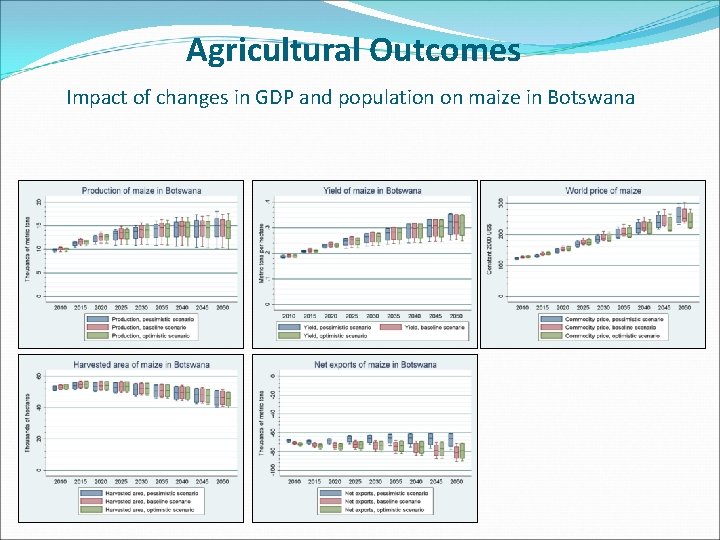
Agricultural Outcomes Impact of changes in GDP and population on maize in Botswana
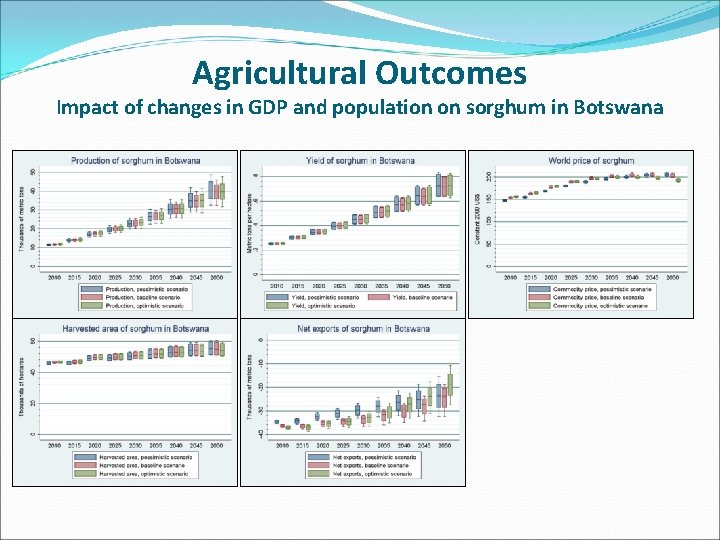
Agricultural Outcomes Impact of changes in GDP and population on sorghum in Botswana
Conclusions �Botswana’s semi-arid climate severely already limits the country’s food production capacity before impacts of climate change � 5% is suitable for cultivation and less than 1% is being cultivated mostly in the eastern parts of the country �Agriculture contribution to GDP reduced from 40% at independence in 1966 to just over 1% at present �Agriculture still remains the mainstay of the rural economy, which is made up of 41. 4% of the country’s households and offers employment to 30% of the country’s employable population
Conclusions �communal farmers cultivate 80% total planted area in the country but produce 38% of the country’s total harvest �Beef production is the only agriculture export earner in Botswana and is dominated by communal farmers who possess about 85% of the national herd �There is currently no policy in Botswana, which caters for the vulnerability of agriculture to climate change �The current policy framework has taken into consideration the drought prone climate of Botswana
Conclusions � Change in precipitation � Most optimistic scenario: - change between -50 to -200 mm in different parts of the country � Most probable scenario: - changes of between -50 to 50 mm in most of the country � Temperature projected to rise by between 1 to 3. 5 o. C across the country � Maize and sorghum yields, projected to increase as the farming methods improve and better hybrid seeds are produced thus resulting in increased production for both crops. � However the increased local production will not be sufficient to satisfy the local demand � Communal farmers are more vulnerable to the effects of climate change than commercial farmers
RECOMMENDATIONS �HERE ONLY VULNERABILITY-NO ADAPTATION MEASURES �EVEN ON VULNERABILITY ASSESSMENT- NOT A ONCE OFF EXERCISE-NEED CONTINUED ASSESSMENTS TO GAIN BETTERUNDERSTANDING OF THE POTENTIAL IMPACTS (E. G. ON LIVELIHOODS) AND HOW TO PREPARE FOR THEM. �IDENTIFY MODELS THAT BEST SUITE BOTSWANA �IDENTIFY IMPORTANT INPUTS INTO PLANNING PROCESSES �ON ADAPTATION OPTIONS �MAP ADAPTATION STRATEGIES AND COSTING THE STRATEGIES
RECOMMENDATIONS CONTD �BUILD NECESSARY CAPACITY FOR MODELLING �LEARN FROM GOOD PRACTICES AND BAD PRACTICES- THINKING COST BENEFIT �UPSCALING OF HOPEFUL PILOT STRATEGIES �REVISION OF POLICIES/PLANS/STRAGEIES/PROGRAMMES TO INCORPORATE CC. MAINSTREAMING CC INTO DEVELOPMENT �FORUM OF INFORMATION SHARING �M&E FRAMEWORK
- Slides: 37