
Assessing The Impact of Climate Change On U
- Slides: 25
Assessing The Impact of Climate Change On U. S. Municipal Ratings Kurt Forsgren Boston Municipal Analyst Forum Managing Director – Sector Lead US Public Finance Ratings kurt. forsgren@spglobal. com (617)-530 -8308 Copyright © 2020 by S&P Global. All rights reserved.
Agenda 1. Background: S&P Global Ratings and ESG 2. Framework for Disclosure & Environmental Data 3. Factoring Climate Risk into Credit Ratings 4. Factoring Climate Risk into Local Government Ratings 2
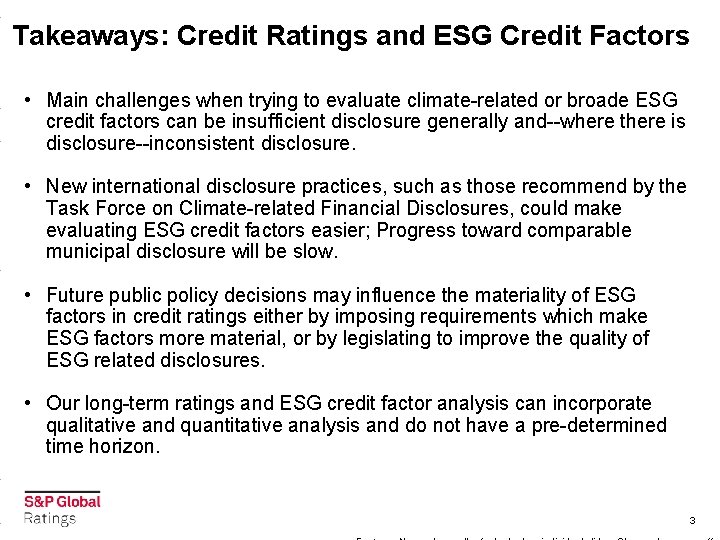
Takeaways: Credit Ratings and ESG Credit Factors • Main challenges when trying to evaluate climate-related or broade ESG credit factors can be insufficient disclosure generally and--where there is disclosure--inconsistent disclosure. • New international disclosure practices, such as those recommend by the Task Force on Climate-related Financial Disclosures, could make evaluating ESG credit factors easier; Progress toward comparable municipal disclosure will be slow. • Future public policy decisions may influence the materiality of ESG factors in credit ratings either by imposing requirements which make ESG factors more material, or by legislating to improve the quality of ESG related disclosures. • Our long-term ratings and ESG credit factor analysis can incorporate qualitative and quantitative analysis and do not have a pre-determined time horizon. 3
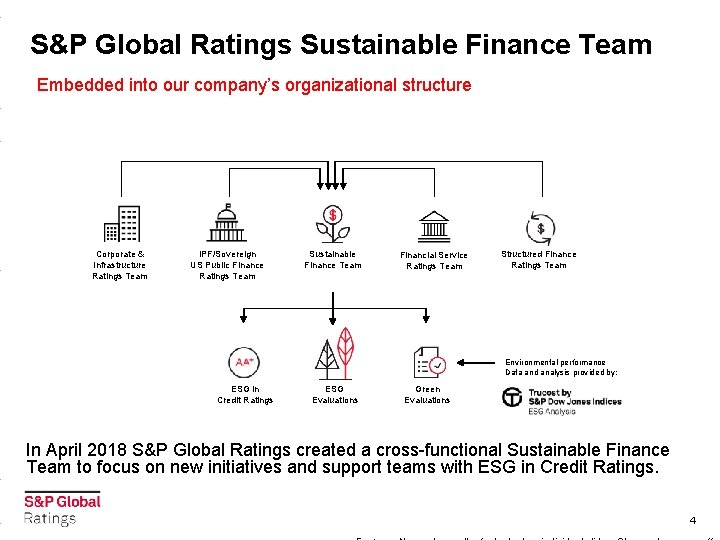
S&P Global Ratings Sustainable Finance Team Embedded into our company’s organizational structure Corporate & Infrastructure Ratings Team IPF/Sovereign US Public Finance Ratings Team Sustainable Finance Team Financial Service Ratings Team Structured Finance Ratings Team Environmental performance Data and analysis provided by: ESG in Credit Ratings ESG Evaluations Green Evaluations In April 2018 S&P Global Ratings created a cross-functional Sustainable Finance Team to focus on new initiatives and support teams with ESG in Credit Ratings. 4
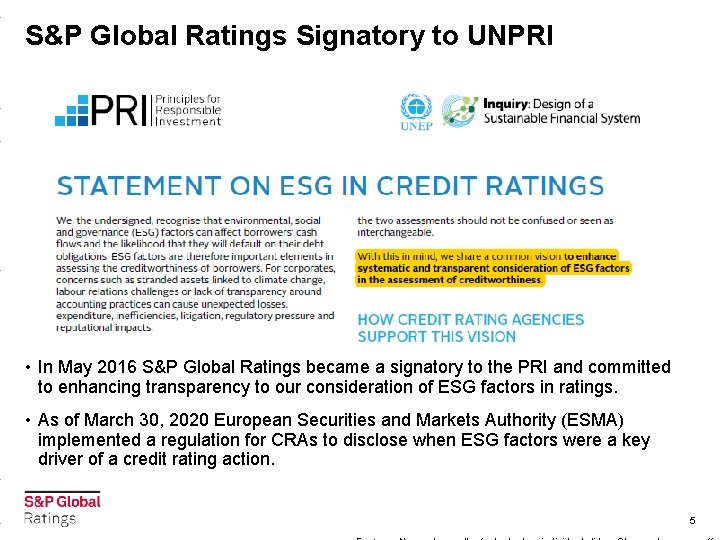
S&P Global Ratings Signatory to UNPRI • In May 2016 S&P Global Ratings became a signatory to the PRI and committed to enhancing transparency to our consideration of ESG factors in ratings. • As of March 30, 2020 European Securities and Markets Authority (ESMA) implemented a regulation for CRAs to disclose when ESG factors were a key driver of a credit rating action. 5
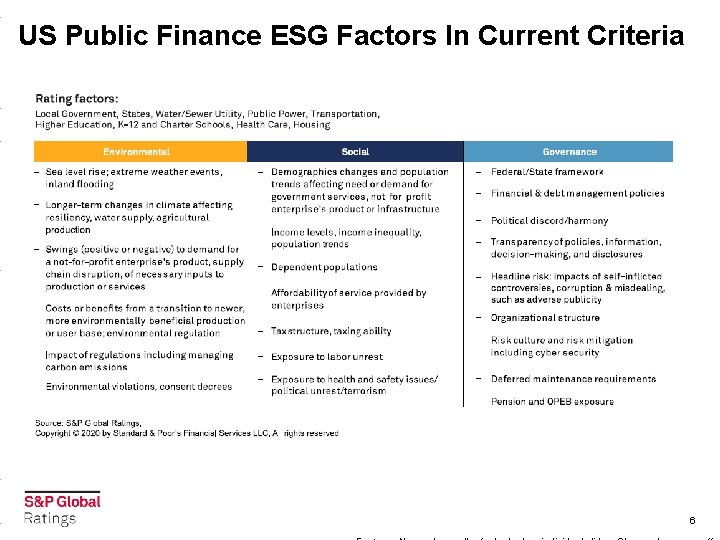
US Public Finance ESG Factors In Current Criteria 6
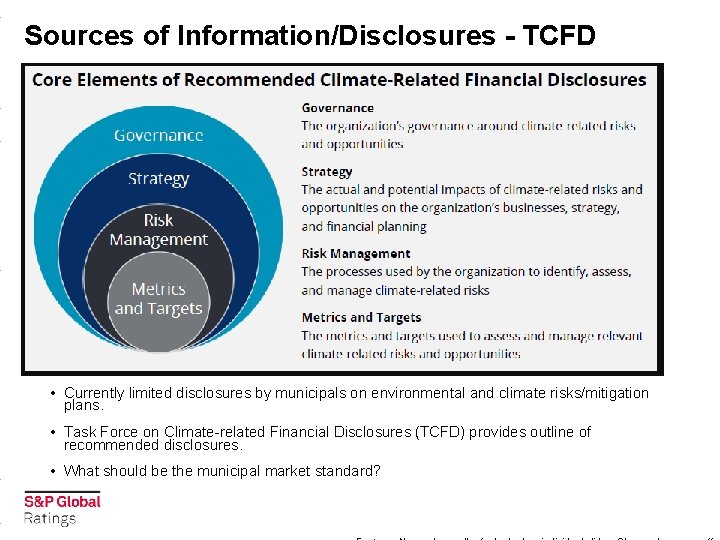
Sources of Information/Disclosures - TCFD • Currently limited disclosures by municipals on environmental and climate risks/mitigation plans. • Task Force on Climate-related Financial Disclosures (TCFD) provides outline of recommended disclosures. • What should be the municipal market standard?
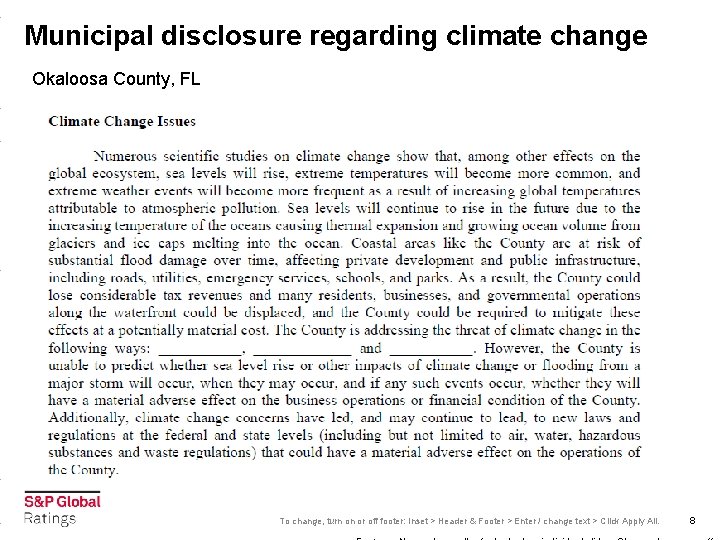
Municipal disclosure regarding climate change Okaloosa County, FL To change, turn on or off footer: Inset > Header & Footer > Enter / change text > Click Apply All. 8
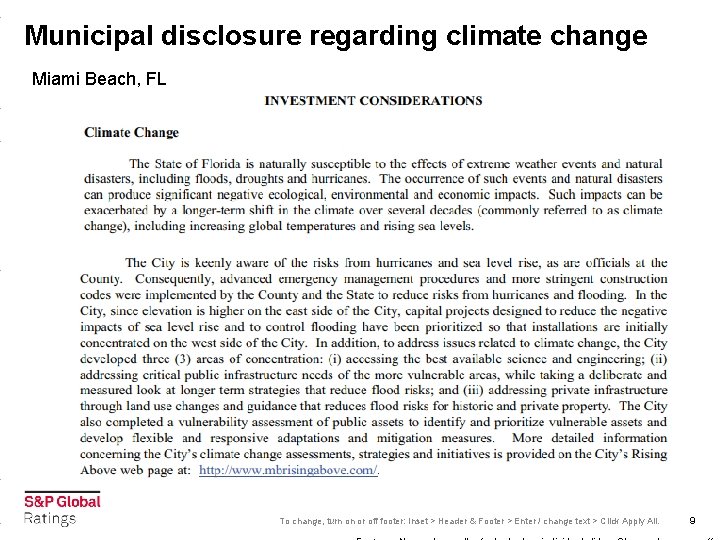
Municipal disclosure regarding climate change Miami Beach, FL To change, turn on or off footer: Inset > Header & Footer > Enter / change text > Click Apply All. 9
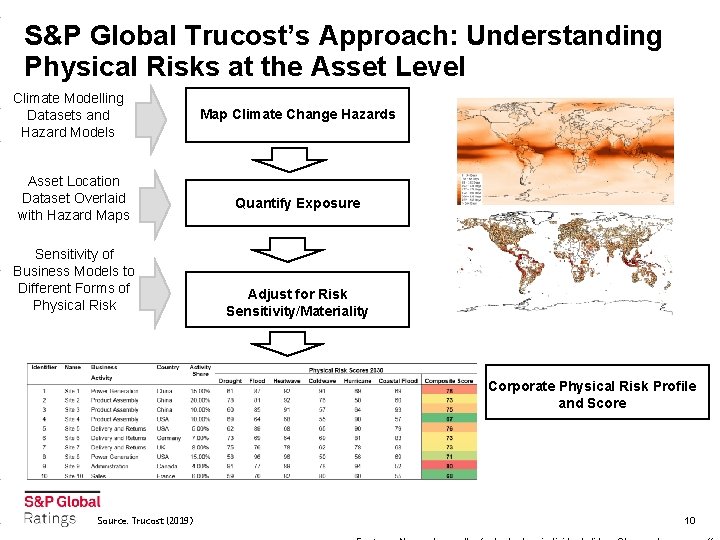
S&P Global Trucost’s Approach: Understanding Physical Risks at the Asset Level Climate Modelling Datasets and Hazard Models Asset Location Dataset Overlaid with Hazard Maps Sensitivity of Business Models to Different Forms of Physical Risk Map Climate Change Hazards Quantify Exposure Adjust for Risk Sensitivity/Materiality Corporate Physical Risk Profile and Score Source: Trucost (2019) 10
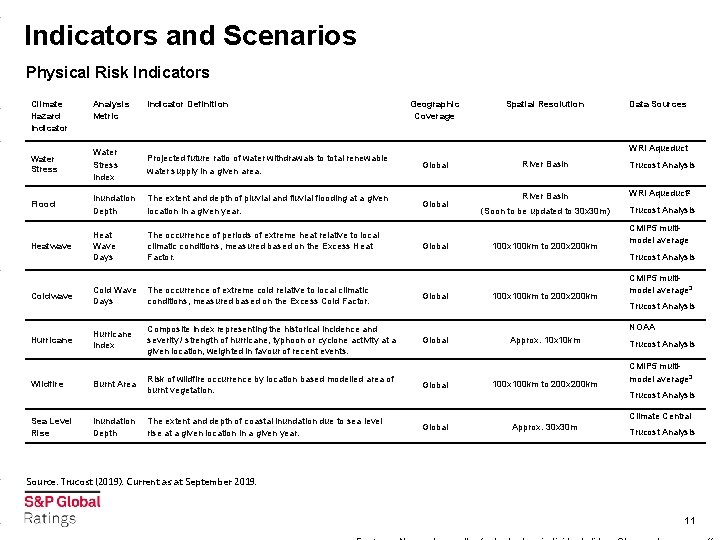
Indicators and Scenarios Physical Risk Indicators Climate Hazard Indicator Analysis Metric Indicator Definition Geographic Coverage Water Stress Index Projected future ratio of water withdrawals to total renewable water supply in a given area. Global Flood Inundation Depth The extent and depth of pluvial and fluvial flooding at a given location in a given year. Global Heatwave Heat Wave Days The occurrence of periods of extreme heat relative to local climatic conditions, measured based on the Excess Heat Factor. Cold Wave Days The occurrence of extreme cold relative to local climatic conditions, measured based on the Excess Cold Factor. Global Hurricane Index Composite index representing the historical incidence and severity / strength of hurricane, typhoon or cyclone activity at a given location, weighted in favour of recent events. Global Burnt Area Risk of wildfire occurrence by location based modelled area of burnt vegetation. Global The extent and depth of coastal inundation due to sea level rise at a given location in a given year. Global Hurricane Wildfire Sea Level Rise Inundation Depth Data Sources WRI Aqueduct Water Stress Coldwave Spatial Resolution Global River Basin Trucost Analysis River Basin WRI Aqueduct 2 (Soon to be updated to 30 x 30 m) Trucost Analysis 100 x 100 km to 200 x 200 km CMIP 5 multimodel average 3 Trucost Analysis NOAA Approx. 10 x 10 km 100 x 100 km to 200 x 200 km Trucost Analysis CMIP 5 multimodel average 3 Trucost Analysis Climate Central Approx. 30 x 30 m Trucost Analysis Source: Trucost (2019). Current as at September 2019. 11
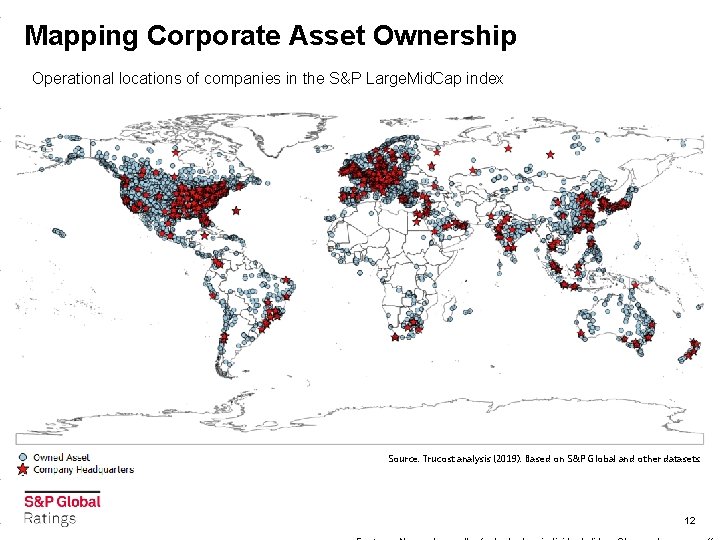
Mapping Corporate Asset Ownership Operational locations of companies in the S&P Large. Mid. Cap index Source: Trucost analysis (2019). Based on S&P Global and other datasets. 12
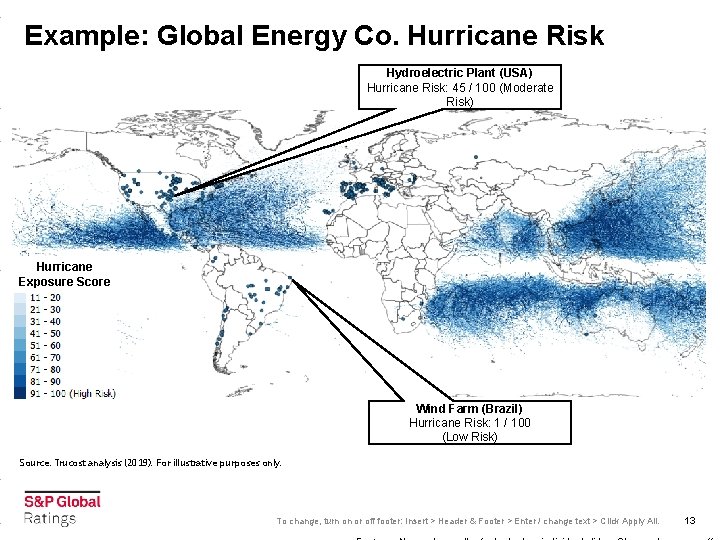
Example: Global Energy Co. Hurricane Risk Hydroelectric Plant (USA) Hurricane Risk: 45 / 100 (Moderate Risk) Hurricane Exposure Score Wind Farm (Brazil) Hurricane Risk: 1 / 100 (Low Risk) Source: Trucost analysis (2019). For illustrative purposes only. To change, turn on or off footer: Insert > Header & Footer > Enter / change text > Click Apply All. 13
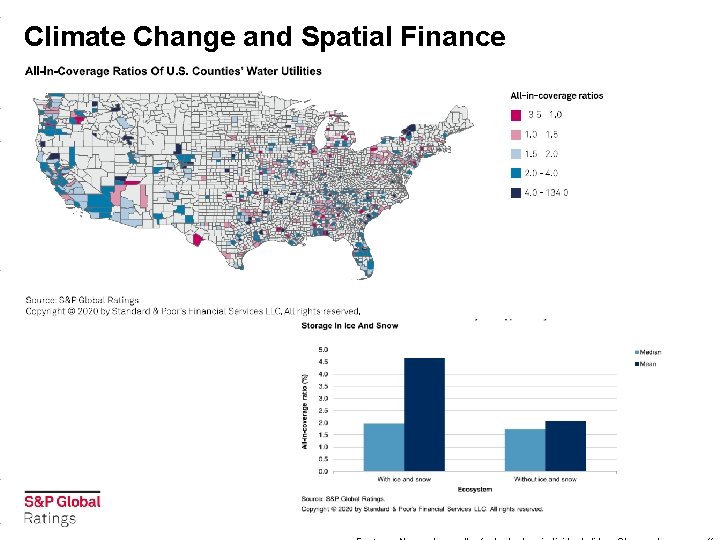
Climate Change and Spatial Finance
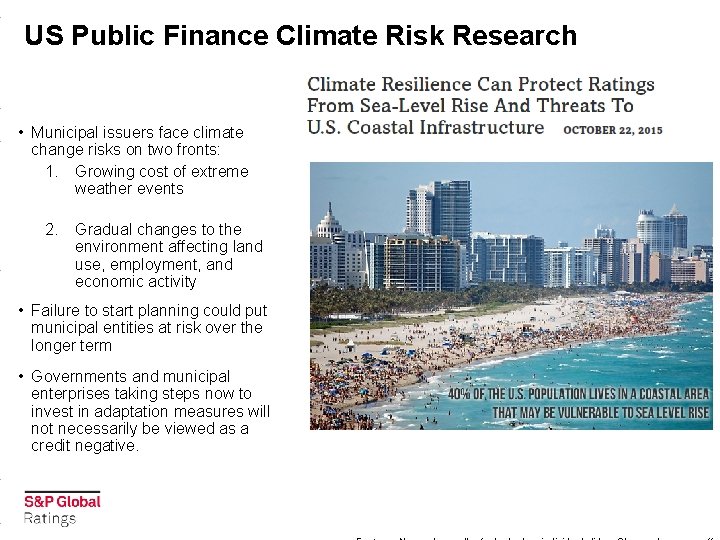
US Public Finance Climate Risk Research • Municipal issuers face climate change risks on two fronts: 1. Growing cost of extreme weather events 2. Gradual changes to the environment affecting land use, employment, and economic activity • Failure to start planning could put municipal entities at risk over the longer term • Governments and municipal enterprises taking steps now to invest in adaptation measures will not necessarily be viewed as a credit negative.
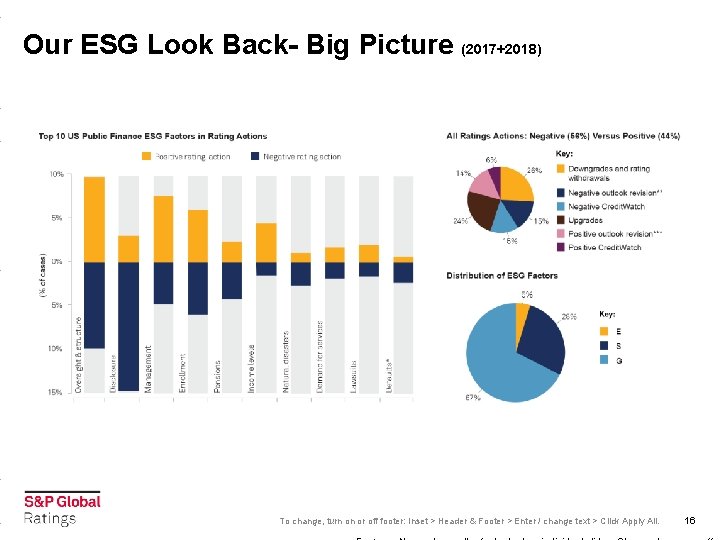
Our ESG Look Back- Big Picture (2017+2018) To change, turn on or off footer: Inset > Header & Footer > Enter / change text > Click Apply All. 16
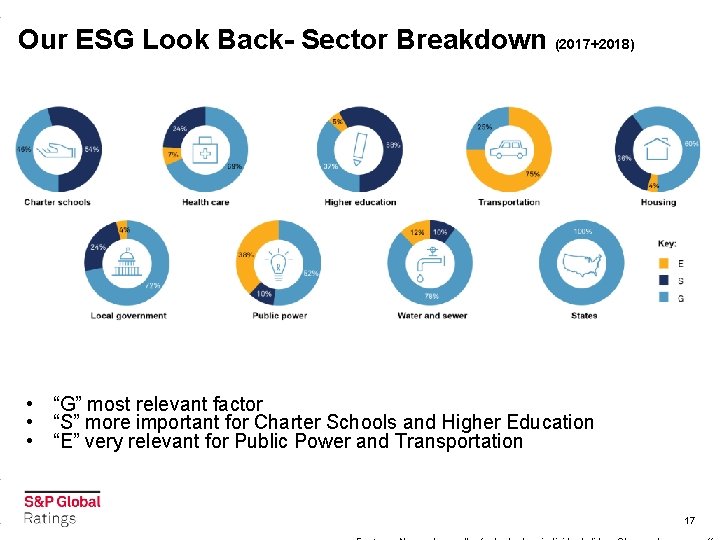
Our ESG Look Back- Sector Breakdown (2017+2018) • “G” most relevant factor • “S” more important for Charter Schools and Higher Education • “E” very relevant for Public Power and Transportation 17
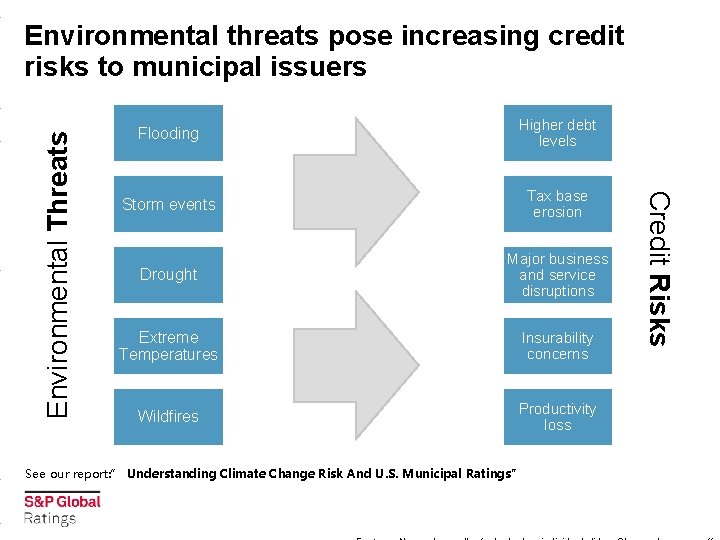
Flooding Higher debt levels Storm events Tax base erosion Drought Major business and service disruptions Extreme Temperatures Insurability concerns Wildfires Productivity loss See our report: ” Understanding Climate Change Risk And U. S. Municipal Ratings” Credit Risks Environmental Threats Environmental threats pose increasing credit risks to municipal issuers
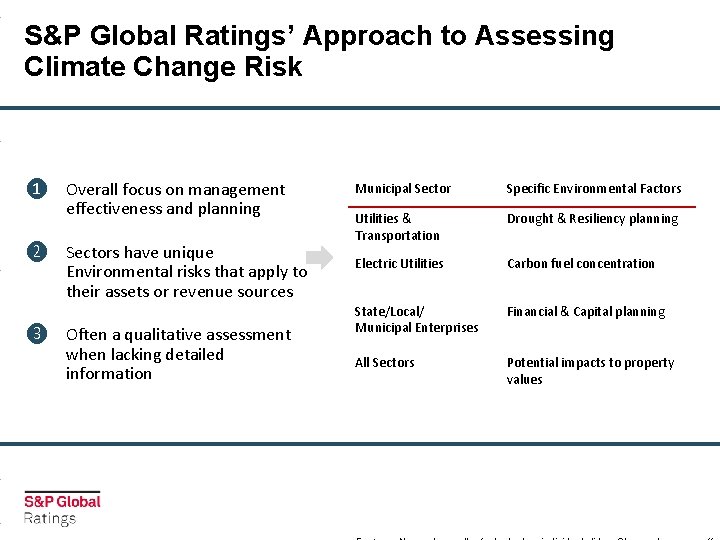
S&P Global Ratings’ Approach to Assessing Climate Change Risk ❶ Overall focus on management effectiveness and planning ❷ Sectors have unique Environmental risks that apply to their assets or revenue sources ❸ Often a qualitative assessment when lacking detailed information Municipal Sector Specific Environmental Factors Utilities & Transportation Drought & Resiliency planning Electric Utilities Carbon fuel concentration State/Local/ Municipal Enterprises Financial & Capital planning All Sectors Potential impacts to property values
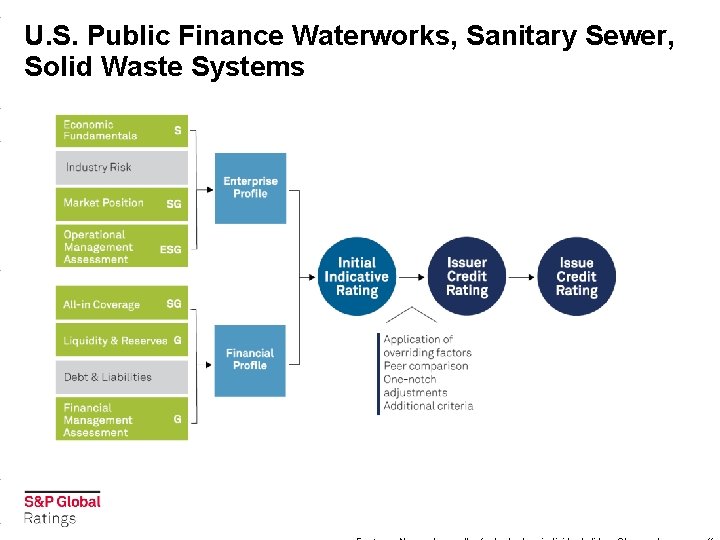
U. S. Public Finance Waterworks, Sanitary Sewer, Solid Waste Systems
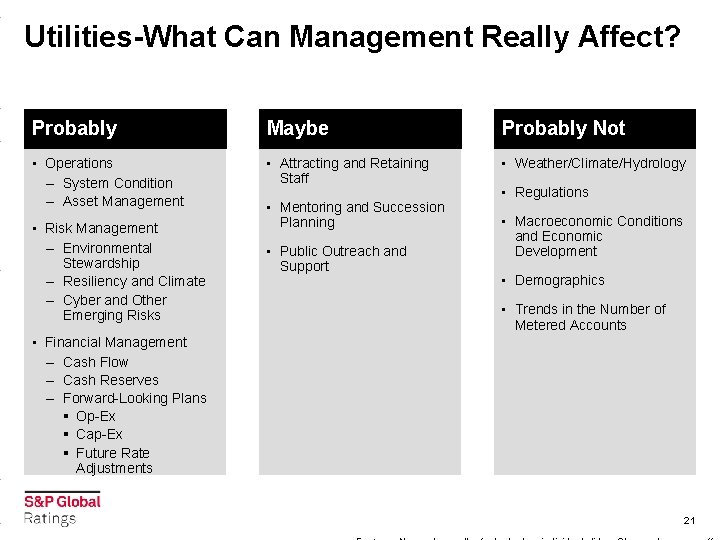
Utilities-What Can Management Really Affect? Probably Maybe Probably Not • Operations – System Condition – Asset Management • Attracting and Retaining Staff • Weather/Climate/Hydrology • Risk Management – Environmental Stewardship – Resiliency and Climate – Cyber and Other Emerging Risks • Mentoring and Succession Planning • Public Outreach and Support • Regulations • Macroeconomic Conditions and Economic Development • Demographics • Trends in the Number of Metered Accounts • Financial Management – Cash Flow – Cash Reserves – Forward-Looking Plans § Op-Ex § Cap-Ex § Future Rate Adjustments 21
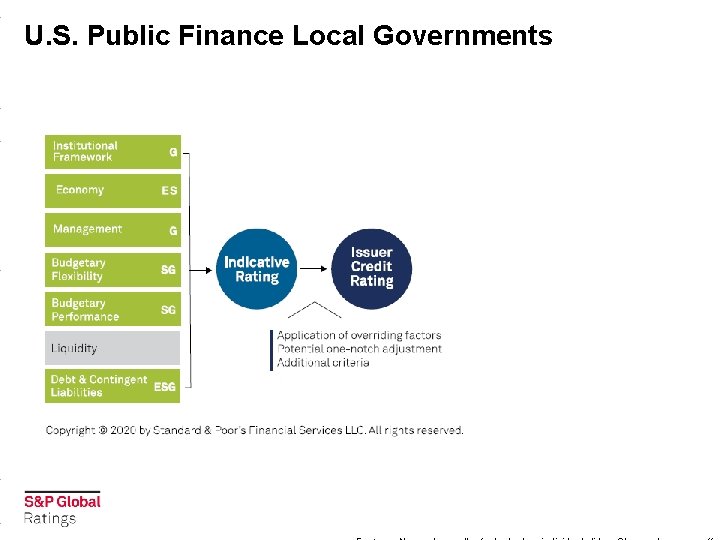
U. S. Public Finance Local Governments
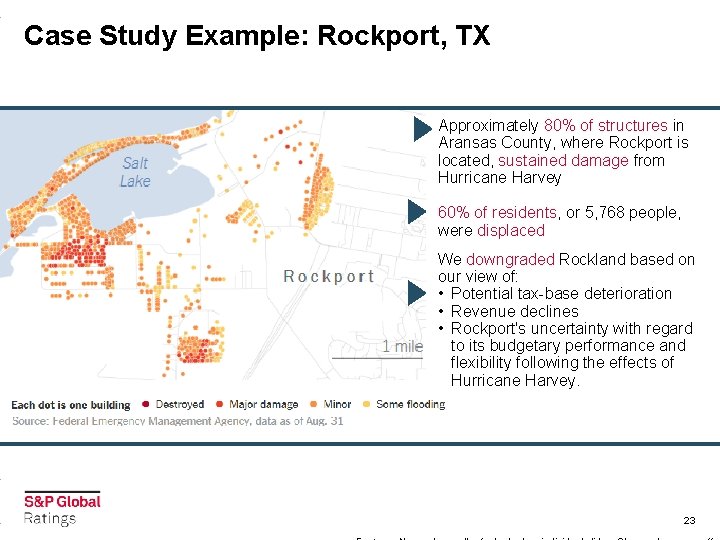
Case Study Example: Rockport, TX Approximately 80% of structures in Aransas County, where Rockport is located, sustained damage from Hurricane Harvey 60% of residents, or 5, 768 people, were displaced We downgraded Rockland based on our view of: • Potential tax-base deterioration • Revenue declines • Rockport's uncertainty with regard to its budgetary performance and flexibility following the effects of Hurricane Harvey. 23
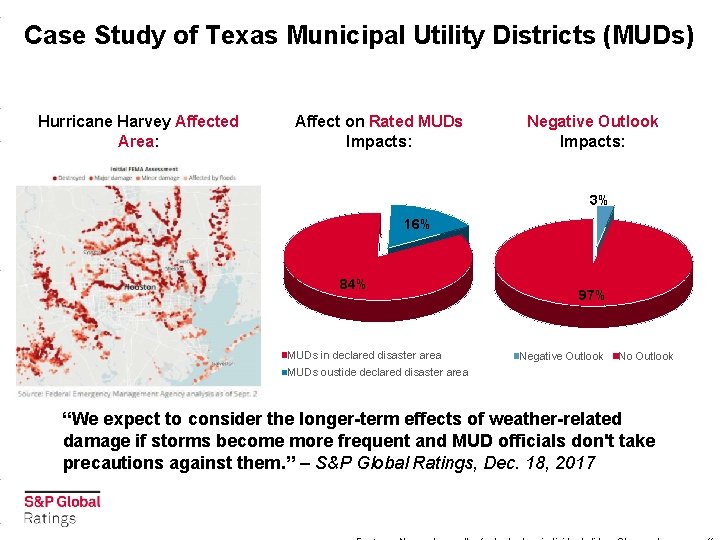
Case Study of Texas Municipal Utility Districts (MUDs) Hurricane Harvey Affected Area: Affect on Rated MUDs Impacts: Negative Outlook Impacts: 3% 16% 84% MUDs in declared disaster area 97% Negative Outlook No Outlook MUDs oustide declared disaster area “We expect to consider the longer-term effects of weather-related damage if storms become more frequent and MUD officials don't take precautions against them. ” – S&P Global Ratings, Dec. 18, 2017
Conclusion • S&P Global Ratings incorporates ESG credit factors into its credit analysis across all sectors if we believe the factors are material and relevant to our opinions of creditworthiness. • Main challenges can be insufficient and inconsistent disclosure. • Increasing availability of environmental data – what is of value to the market? • The impact of climate-related risks and other ESG credit factors depends on our opinion of how much they affect the capacity and willingness of an obligor to meet its financial commitments. • Climate change risk will be increasingly considered in our rating analysis.