Assessing Potential Bias in Preliminary Estimates of Global

Assessing Potential Bias in Preliminary Estimates of Global GHG Trends Ed Dlugokencky, Kirk Thoning, and Molly Crotwell NOAA ESRL Global Monitoring Division Acknowledgement: Ken Masarie & Pieter Tans
")
NOAA Trends Products: • In situ MLO CO 2 trends (daily & monthly updates) • In situ global CO 2 trends (daily updates) – Deseasonalized average of 4 NOAA observatories (BRW, MLO, SMO, and SPO) • Global CO 2 and CH 4 trends (monthly updates) – Based on cooperative global air sampling network • ~35, 000 hits per month
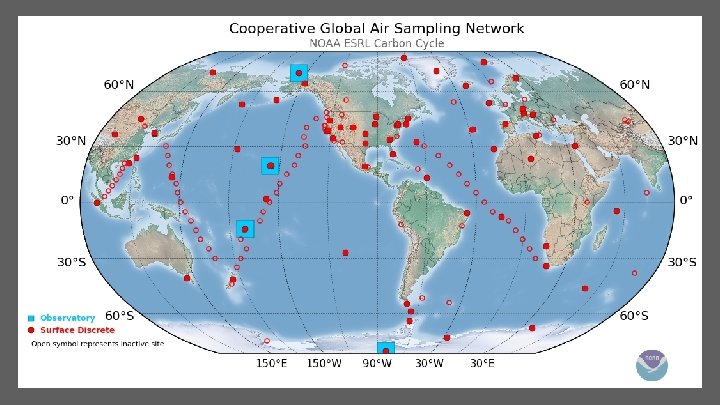

• 5 th of month → “web runs” • Use subset of weekly BG sites • Smooth each record in time • Synchronized values from curve
 • Fit curves as function of sine(latitude) at each t-step S")
CH 4 (ppb) • Fit curves as function of sine(latitude) at each t-step S Sine (lat) N

• Matrix of values → zonal and global means • 48 time steps yr-1 • Lag between sampling and measurement • End effects

“Global Trends” https: //www. esrl. noaa. gov/gmd/ccgg/trends/global. html • Monthly updates of: – Annual means – Monthly means – Annual increase – Uncertainties estimated annually using nonparametric methods • For CO 2 and CH 4 (soon: N 2 O and SF 6)

What Issues Are We Addressing and Why? • Web runs: 1990 - 2017 – Compare initial estimates with “finalized” ones • Are initial estimates biased? – Network “lag” effects: delay between sampling and analysis – Curve fitting end effects: lack of constraint at time of web run • If biased, how do we minimize the bias? • Avoid claims of exaggerating changes

Annual Means: CO 2 ? 1990 -2017 u = ± 0. 1 ppm ? Initial estimates of annual means: relatively small bias that converges quickly; insensitive to method.

2013 - POC 1991 - CRZ added

Monthly Means: CH 4 u = ± 1. 2 ppb

Monthly Means: CO 2 u = ± 0. 1 ppm

Annual Increase: CO 2 u = ± 0. 07 ppm yr-1 1990 -2017 Initial estimates of annual increase can have relatively large bias; add caveat to web page.

Annual Increase: CH 4 u ≈ ± 0. 6 ppb yr-1 Initial estimates of annual increase can have significant bias, even with 4 month lag. Add caveat to page.

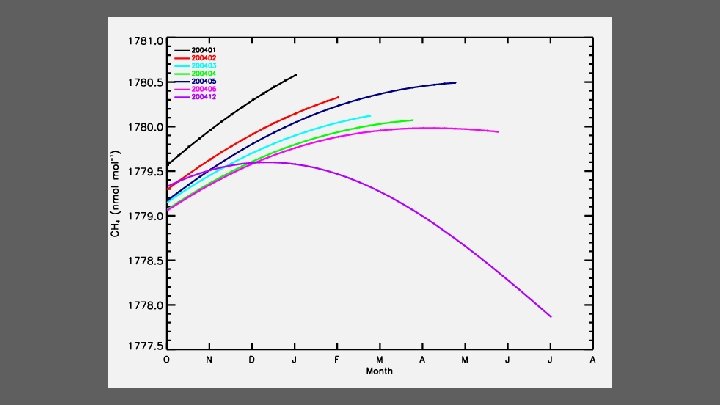
Curve Fit End Effects Oct. , 2003 - Apr. , 2004 Network effects eliminated: Based on sample date.

Summary and Conclusions • Initial estimates are biased by more than uncertainty • Initial estimates poorly constrained by web run – Not improved by averaging method • Annual means: – Relatively small bias: most of year already constrained • Monthly means: – Large changes: smooth curve needs 6 weeks or more to be constrained • Delay release by 3 to 4 months • Annual increase: – Large changes: trend needs 6 mos. or more to be fully constrained • Delay release by 3 to 4 months • Add caveat to web page text

Extra Slides

Network/Curve Fitting End Effects With network effects 1990 -2014 Without network effects
 • Used for CH 4 trends website. • Starts with standard")
Extension Method (EXT) • Used for CH 4 trends website. • Starts with standard weekly global averages. • Calculates monthly means using only those values that fall within the month (Fig. , red symbols). • De-seasonalized trend is similar to 12 -month running mean (red trend line). • Moderates IAV in signals. • Annual increase calculated from deseasonalized trend curve as: Jan 1 (year+1) - Jan 1 (year). • This is the method used to smooth discreet air samples to calculate weekly zonal averages. Alternate Method (PPT) • Used for CO 2 trends website. • Starts with weekly global averages. • Calculates monthly means using 5 -value weighted average that overlaps with previous and following months (blue symbols). • Deseasonalized trend curve determined by subtracting 7 adjacent seasonal cycles centered on the month to be corrected (blue trend line). This result is less-smoothed than with EXT. • Larger IAV than EXT in the deseasonalized trend. • Annual increase calculated from deseasonalized monthly means: (Dec(yr)+Jan(yr+1))/2 -(Dec(yr-1)+Jan(yr))/2
 Method: Alternative (PPT) Method: Standard (EXT) MM Difference:")
Processing Global Means: Smoothing (Monthly Mean) Method: Alternative (PPT) Method: Standard (EXT) MM Difference: PPT - EXT Trend Difference: PPT - EXT
 Method: Alternative (PPT) Method: Standard (EXT) Trend Difference: PPT")
Processing Global Means: Smoothing (Trend) Method: Alternative (PPT) Method: Standard (EXT) Trend Difference: PPT - EXT

Monthly Means: Average over months 2009 u = ± 0. 1 ppm 2010 u = ± 1. 2 ppb To limit bias, delay release of means by 3 (CO 2) or 4 (CH 4) months

Annual Means: CH 4 u = ± 0. 7 ppb 1990 -2017 Initial estimates of annual means: relatively small bias that converges quickly; insensitive to method.

Monthly Means: Average over months u = ± 1. 2 ppb u = ± 0. 1 ppm To limit bias, delay release of means by 3 or 4 months

Monthly Means: W/ and W/O ABS Taking ABS: Difference always positive and smaller SD

Annual Increase: N 2 O u ≈ ± 0. 13 ppb yr-1

Annual Means: N 2 O

Annual Increase: SF 6 u ≈ ± 0. 01 ppt yr-1

Annual Means: SF 6

• 5 th of month → “web runs” • Use subset of weekly BG sites • Smooth each record in time • Fit curves as function of latitude • Matrix of values → zonal and global means • 48 time steps yr-1 • Lag between sampling and measurement • End effects
- Slides: 31