ASSESSING PAST USE OF TANNERY WASTE SLUDGE AS


 to soil by farmer & nearby residents. §")
![Cr. VI SCREENING LEVELS § Represent mean [Cr. VI] across exposure area that would](https://slidetodoc.com/presentation_image_h2/882d0b51d378cd9839a9e1c4a244cb8d/image-8.jpg "Cr. VI SCREENING LEVELS § Represent mean [Cr. VI] across exposure area that would")


![DECISION RULE § If 95% UCL on [Cr. VI] (measured using SUIS) in any](https://slidetodoc.com/presentation_image_h2/882d0b51d378cd9839a9e1c4a244cb8d/image-11.jpg "DECISION RULE § If 95% UCL on [Cr. VI] (measured using SUIS) in any")


 ID Ave of SUIS DU-IS Result")


- Slides: 30
ASSESSING PAST USE OF TANNERY WASTE SLUDGE AS FARM FIELD FERTILIZER IN NORTHWEST MISSOURI July 20, 2010 ITRC Meeting Seattle, WA
BACKGROUND § § Sludge applied 1983 -2009 56, 000 acres affected 100+ locations across 4 counties Concern about risk posed by hexavalent chromium (Cr VI) in sludge.
CSM JACKPOT: TANNERY KEPT LOTS OF DATA ON SLUDGE APPLICATION
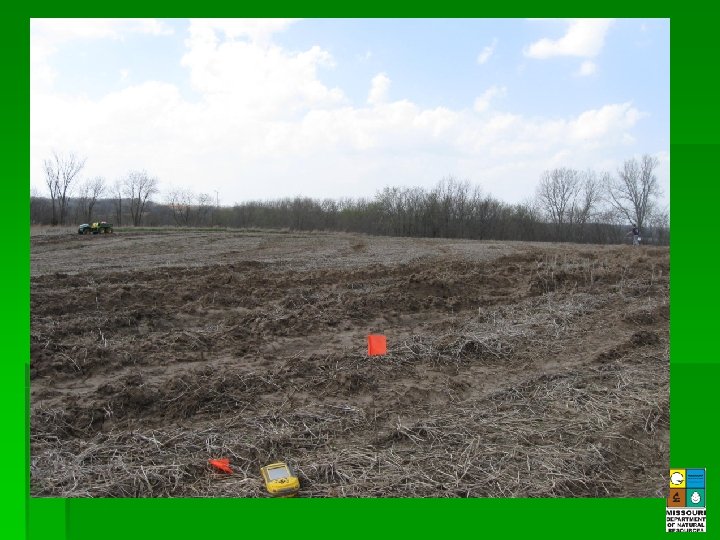
STUDY AREA
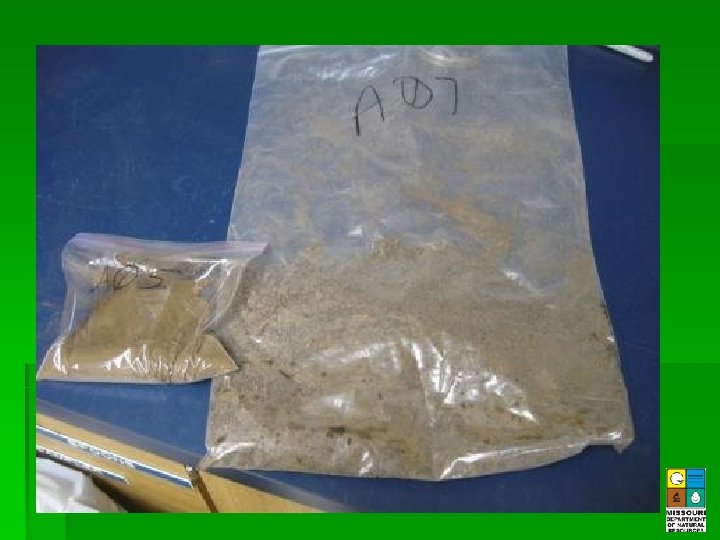
HERE COMES THE SLUDGE
CONCEPTUAL SITE MODEL § Applications uniform except near buffers, corners, access gates. § Appl. rates frequencies & mechanism known § Runoff concentrates sludge in low areas § High f. OC, low p. H, & high redox all act to reduce Cr VI to Cr III.
EXPOSURE PATHWAYS § Direct exposure (inh/ingest) to soil by farmer & nearby residents. § Interested in particle fraction <0. 25 mm § Leaching to groundwater & GW ingestion § Surface water, ecological risk (not assessed)
Cr. VI SCREENING LEVELS § Represent mean [Cr. VI] across exposure area that would pose risk to resident child living adjacent. § Farm field = 86 ppm. Based on 80 -acre field.
SAMPLING STRATEGY § 56, 000 acres affected. Can’t sample it all: Select 15 -20 farm field DUs for sampling. § DUs= Exposure Area = 80 acres § SU = 1 acre squares w/in DU § Fields chosen based on CSM (judgemental) – appl. Rate, frequency, time, geography, field type (row crop vs. pasture). § SUs also chosen based on CSM – attempt to select SUs with maximum within-SU and between SU heterogeneity (most conservative).
FARM FIELD DU WITH OVERLAY GRID OF SUs
DECISION RULE § If 95% UCL on [Cr. VI] (measured using SUIS) in any farm field DU exceeds the screening level, investigation will be expanded; otherwise conclude that sludge applications do not pose risk NFA.
PILOT STUDY § 30 Discrete collected in three FF plots § XRF for total Cr few $/sample. Cr. VI analysis $160/sample. § Analyzed for total and hex Cr § Variograms showed total and hex Cr vary across fields in similar way & var of Cr >Cr. VI. § Used worst case observed ratio of Cr. VI: Cr (~20%) to convert Cr. VI SL to Cr SL.
Farm Field Design = Farm Field DU area = 1 -acre SU area = SU increment sample location Start with 3 SUs and 10 discretes (increments) SU 80 SU 72 Analyze each increment 4 x by XRF -Provides measure of within bag heterogeneity -Use mean, SD, AL in VSP to determine # incr. needed in SU -If >10 increments needed, collect them. SU 45 REPEAT FOR OTHER 2 SUs SU 28 SU 4
VISUAL SAMPLE PLAN ANALYSIS Our decision error tolerance Cr. VI AL converted to total Cr AL (using pilot data) From discrete sample From SUXRF data Number of samples needed within the SU
XRF ANALYSIS
Farm Field Design SU 80 Increments combined in oe bag = Farm Field DU area = 1 -acre SU area = SU increment sample location Combine SU increments together to form SUIS & XRF 4 x SU 72 -Use mean, SD, AL of the 3 SUIS in VSP to determine number of SUs needed for the DU. Increments combined in one bag -If >3 SUs needed, collect them SU 45 DUIS SU 28 Increments combined in one bag -Split SUIS and combine aliquots to form DUIS (2 nd Tier). XRF that. -Send SU & DU IS samples for Cr. VI analysis SU 4
INCREMENTS/SU & SUs/DU § None of the 60 SUs required more than 10 increments based on VSP analysis (none even >4). § None of the 19 DUs required more than 3 SUs to be sampled. § SDs were low, but key factor was the distance between our estimates of mean [Cr. VI] & the screening level.
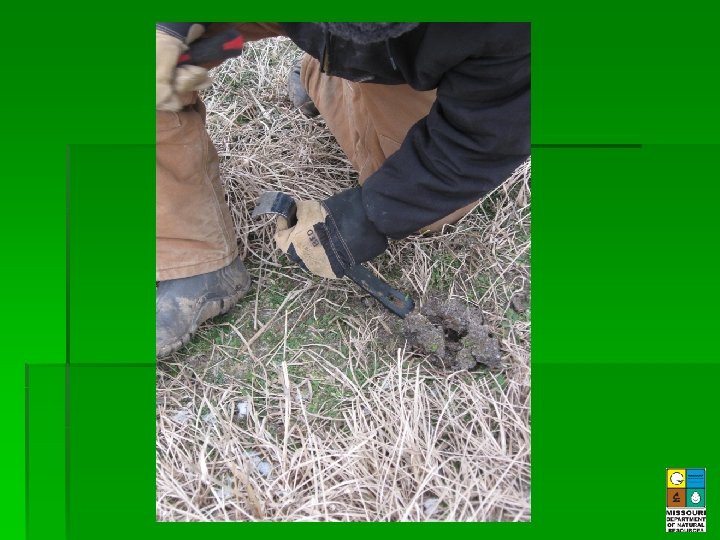
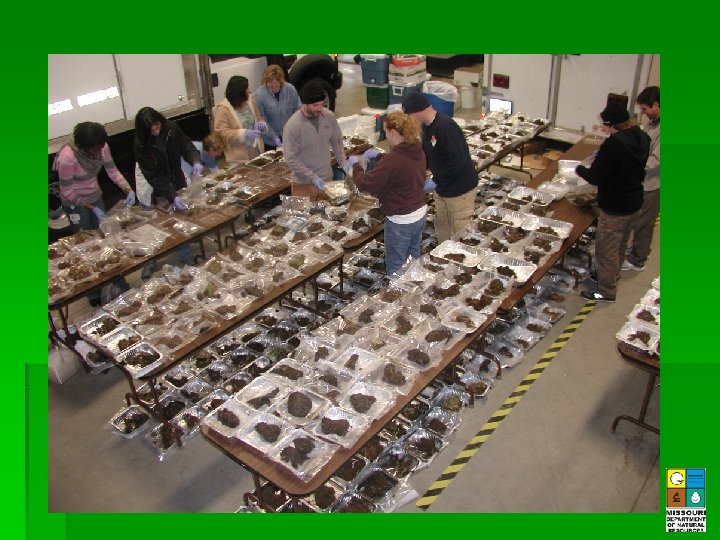
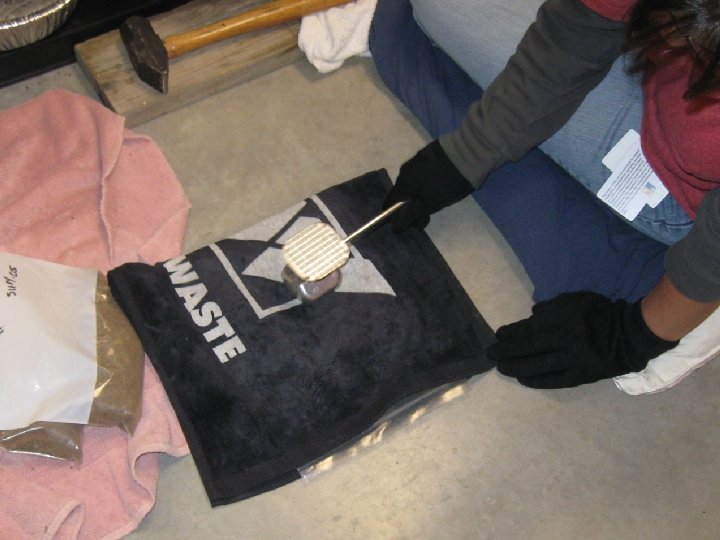
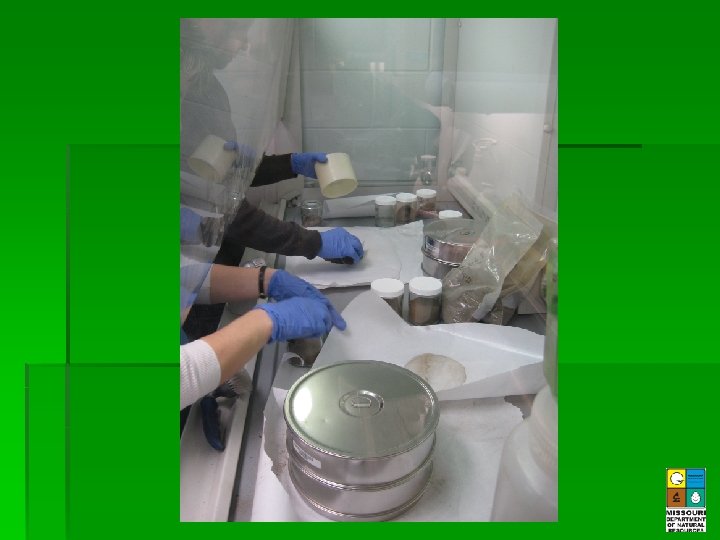
Sample Processing § § § Air dry discretes, disaggregate, sieve 60 mesh Create SUIS from discretes Split SUIS into 3; one to form DUIS, one to lab, one for archive. Split technique was simple mix & pour from bag. § All SUIS and half the DUIS submitted for Cr. VI analysis § Lab used 2 D Japanese slabcake for subsampling
SU IS Replicates Hexavalent Cr, mg/kg SU Repl 1 Repl 2 Repl 3 Total Cr, mg/kg RSD SU Repl 1 Repl 2 Repl 3 RSD 205 -88 1. 02 0. 652 0. 779 22. 9 205 -88 105 149 159 20. 9 214 -37 1. 13 0. 715 0. 674 30. 0 214 -37 264 289 267 5. 0 221 -162 4. 07 3. 45 4. 57 13. 9 221 -162 97 115 105 8. 5 *SUIS made up of 10 increments collected in systematic (serpentine) pattern
Analytical Subsampling DU-SU Cr VI Lab dup Cr. VI RPD 201 0. 063 4. 9 209 -96 1. 05 0. 942 10. 8 205 -88 1. 110 0. 938 16. 8 212 -53 0. 605 0. 750 21. 4 213 -44 0. 833 0. 788 5. 6 214 -25 1. 610 1. 620 0. 6 215 -55 0. 069 0. 080 14. 8 0. 793 0. 775 2. 3 4. 38 3. 76 15. 2 217 -103 221 -162 2 D Japanese Slabcake Method Used
Comparison of IS Tiers Total Cr, mg/kg (XRF) ID Ave of SUIS DU-IS Result Hexavalent Cr, mg/kg %RPD ID Ave of SUIS DU-IS Result %RPD DU 202 135 131 3 DU 203 68 67 1 DU 212 0. 75 0. 49 42 DU 204 133 126 5 DU 213 1. 04 0. 703 38 DU 205 146 141 3 DU 214 0. 77 0. 35 75 DU 209 52 48 7 DU 215 0. 62 1. 73 95 DU 210 61 61 0 DU 217 1. 05 1. 16 10 DU 212 227 251 10 DU 213 244 254 4 DU 221 2. 59 1. 64 45 DU 214 285 225 23 DU 225 1. 38 1. 48 7 DU 215 263 282 7 DU 216 109 116 7 DU 217 268 264 2 DU 218 197 204 3 DU 219 60 63 5 DU 221 104 96 8 DU 222 118 108 9 DU 223 78 80 3 DU 224 44 39 11 DU 225 103 97 6 Micro scale heterogeneity of total Cr in matrix controlled well by sample splitting technique. Less well for Cr. VI.
Analysis of Relative Uncertainties Data Variability Measured by Width of 1 Side of Uncertainty Interval Normalized to the Mean (i. e. , interval width/mean) General trends: -Higher variability in Cr. VI vs. total Cr -Variability incr. with scale from within sample to within SU to between SU. But, -For some DUs, micro-scale variability within sample dominates. *only portion of DU data shown
DATA VALIDATES CSM? § Selection of DUs based on application data captured worst case fields. – Yes, pos. correlation of application rates/frequency to Cr levels. § Our selection of SUs maximized within and between SU variability – Yes, SUs chosen as high variability in field had highest SD, SUs chosen as low variability had lower SD. § Soil redox conditions control ratio of Cr 6: Cr in fields. – Yes, f. OC highly (negatively) correlated with Cr. VI
DECISION § Accounting for all sources of variability, and making most conservative assumptions, no 95% UCL was within an order of magnitude of the screening level. § No further investigation planned