Assessing Influenza Vaccination Coverage during the 2010 11


 Child Influenza Module Methodology q Random-digit–dialed telephone survey of households")
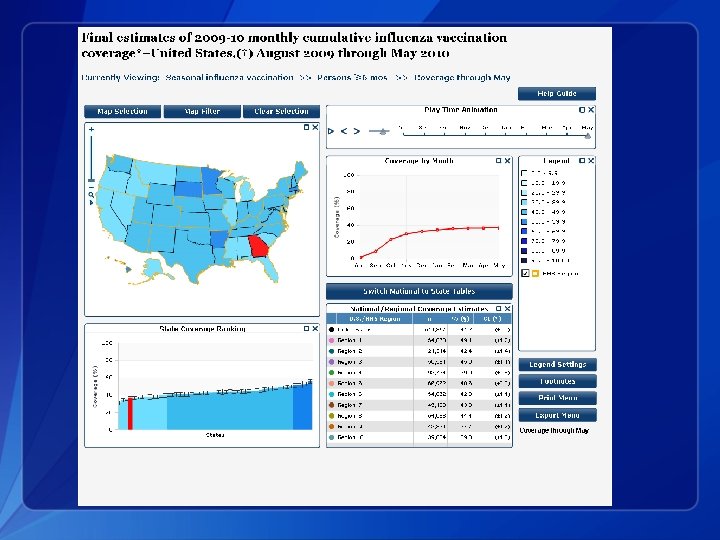
 Monthly cumulative influenza vaccination coverage by selected age groups −")


 q Provides mid-season influenza vaccination coverage")
")
")

 * Influenza vaccination coverage among pregnant women, United States, November")
 Rather")
 • Population-based surveillance system. Collects information on maternal")
 • Nationally representative annual cross-sectional household survey • Obtains")


 q Continue comprehensive assessment systems used for 201011 season")


- Slides: 38
Assessing Influenza Vaccination Coverage during the 2010– 11 Season Rosanna W. Setse, MD, MPH, Ph. D Sr. Epidemiologist, Science Applications International Corporation (SAIC) Contractor, Assessment Branch, Immunization Services Division NCIRD, CDC. National Center for Immunization & Respiratory Diseases Immunization Services Division
Influenza vaccination q Each year, in the United States, serious illness, hospitalization & deaths result from influenza epidemics q Disease Burden: During 1979 -2001, ~226, 000 influenza related hospitalizations each year. During 1976 -2007, deaths ranged from 3, 349 to 48, 614 1, 2 q Single most effective strategy for preventing influenza related morbidity and mortality – annual vaccination q Advisory Committee on Immunization Practices (ACIP) recommendation: § Annual influenza vaccination for all persons ≥ 6 months who do not have contraindications to vaccine use
Vaccination Coverage Assessment q CDC routinely monitors influenza vaccination coverage in the civilian non-institutionalized population q Assessment Branch of Immunization Services Division: § Provides scientific leadership on measurement of vaccination coverage across the lifespan § Collects, analyzes and disseminates accurate vaccination coverage data § Promotes use of these data at the national, state and local levels
Uses of Influenza Vaccination Coverage Estimates q At state level § § q Promote vaccination during National Influenza Vaccination Week Local briefings with state government officials Evaluate progress of state vaccination campaign Issue briefs on influenza vaccination coverage among specialized populations At national level § § § Identify states doing very well or lagging behind Estimate denominator for vaccine safety studies Use in models to estimate burden of influenza averted by vaccination Provide information to improve vaccination programs and policy Briefing of CDC leadership and ACIP on vaccination progress during 2009 H 1 N 1 pandemic
2009 -10 influenza season q Characterized by the 2009 H 1 N 1 pandemic q CDC established a comprehensive influenza vaccination coverage monitoring system q Need for in-season vaccination coverage estimates q Coverage estimates determined from multiple sources BRFSS, NHFS, RAND/KN, PRAMS, SDI claims data & CMS claims data (for nursing home residents) q New analytic methods used q Lessons learned during the 2009 -10 season have been applied to the 2010 -11 season
2010 -11 influenza Season q First season post-H 1 N 1 pandemic season q 1 st year of implementation of ACIP universal vaccination recommendation q Need for in-season and post season coverage estimates q Coverage estimates being derived from several traditional and non-traditional sources q National and state-level influenza vaccination coverage estimates with interactive reports available on-line at CDC website (Flu. Vax. View)
New CDC webpage for Influenza Vaccination Coverage http: //www. cdc. gov/flu/professionals/vaccination/vaccinecoverage. htm
Data Sources: 2010 -11 influenza Season q Monthly State-level Data September 2010 -June 2011 § BRFSS for adult vaccination § NIS sampling frame for children q Rapid National Flu Surveys § Telephone surveys conducted early November 2010, repeat March 2011, national and 20 local areas q Internet panel surveys of pregnant women & healthcare personnel. Conducted November 2010, repeat April 2011 q Weekly In-season claims data § Third-party vaccination claims data § Center for Medicaid & Medicare Services claims data q Data available in 2012 § National Health Interview Survey (NHIS) § Pregnancy Risk Assessment Monitoring system (PRAMS)
Behavioral Risk Factor Surveillance System q State-based random-digit-dialed household telephone survey q Sample size ~400, 000 randomly selected adults ≥ 18 years from all 50 states, District of Columbia and U. S. affiliated jurisdictions q Influenza Vaccination related data § Receipt of influenza vaccine, month of vaccination, shot or spray q Primary source of monthly state-level and aggregate “national” data for adults ≥ 18 years (2 -3 month lag) q Child Influenza Module of vaccination questions only conducted in 20 states
National Immunization Survey (NIS) Child Influenza Module Methodology q Random-digit–dialed telephone survey of households with children 19– 35 months from all 50 states & the U. S. Virgin Islands q Parents of children 6 m-17 years are identified during screening for NIS-Child and NIS-Teen q Vaccination variables – (based on parental report) § Receipt of influenza vaccination, number of doses, shot or spray, vaccination month, place of vaccination, intent to be vaccinated q Provides weekly (2 week lag) national & state-level influenza vaccination coverage estimates for children & adolescents
Influenza vaccination coverage (%) Monthly cumulative influenza vaccination coverage by selected age groups − Behavioral Risk Factor Surveillance System (BRFSS) and National Immunization Survey (NIS), August through November 2010 70, 0 60, 0 50, 0 Aug Sept Oct Nov 40, 0 30, 0 20, 0 10, 0 6+ mos 18+ yrs 18 -49 yrs HRC* 50 -64 yrs 65+ yrs * High-risk conditions
Aug 7 Aug 21 Sep 4 Sept 18 Oct 2 Oct 16 Oct 30 Nov 13 Nov 27 Dec 11 Dec 25 Jan 8 Jan 22 Feb 5 Feb 19 Mar 5 Reported influenza vaccination intent among children 6 months – 17 years, by week and age group, NIS Child Influenza Module, interviews conducted August 1, 2010 - March 5, 2011 Will Probably Get 6 mos --17 yrs Will Definitely Get 6 - 23 mos Vaccinated 100 90 80 70 60 50 40 30 20 10 0 2 - 4 yrs 5 - 17 Years
Comparison: Influenza vaccination coverage* among children, 6 months-17 years, 2009 -10 and 2010 -11 seasons Influenza vaccination coverage (%) 60, 0 50, 0 40, 0 30, 0 2009 -10 (Seasonal or H 1 N 1 vaccinations) 20, 0 2009 -10 (seasonal Flu vaccinations only) 10, 0 2010 -11 season ay M ril Ap Au gu Se st pt em be r O ct ob N ov er em be D r ec em be r Ja nu ar y Fe br ua ry M ar ch 0, 0 Calendar month *Data sources: 2010 -11 estimates based on 2010 BRFSS & NIS data. 2009 -10 estimates based on 2009 BRFSS & NHFS data
Comparison: Influenza vaccination coverage* among adults ≥ 18 years, 2009 -10 and 2010 -11 seasons Influenza vaccination coverage (%) 60, 0 50, 0 40, 0 30, 0 2009 -10 (Seasonal + H 1 N 1 vaccinations) 20, 0 2009 -10 (seasonal Flu vaccinations only) 10, 0 2010 -11 season ay M ril Ap Au gu Se st pt em be r O ct ob er N ov em be D r ec em be r Ja nu ar y Fe br ua ry M ar ch 0, 0 Calendar month *Data sources: 2010 -11 estimates based on 2010 BRFSS & NIS data. 2009 -10 estimates based on 2009 BRFSS & NHFS data
Internet panel survey of health care personnel (HCP) q Provides mid-season influenza vaccination coverage estimates and information on knowledge, attitudes, and behaviors related to influenza vaccination among HCP q Respondents (n=2010) recruited from self-identified HCP participating in a nationally representative, online research panel and the Physician Consulting Network q Web-based questionnaire was administered November 4 16, 2010 q Measured self-reported influenza vaccination from August 2010 q Follow-up survey will be administered in April 2011
Influenza vaccination coverage among U. S. healthcare personnel by age, November 2010 (n=2, 010) Influenza vaccination coverage (%) 100 90 80 70 60 50 40 30 20 10 0 All 18 -29 30 -44 Age, years 45 -59 ≥ 60
Influenza vaccination coverage among U. S. health-care personnel by occupation, November 2010 (n=2, 010) Other occupation Administrative/nonclinical support Technician/assistant/a id Allied health professional Nurse Physician/dentist/NP/ PA 0 10 20 30 40 50 60 Influenza vaccination coverage (%) 70 80 90
Internet panel survey of pregnant women q Goal : To provide mid-season influenza vaccination coverage estimates and information on knowledge, attitudes, and behaviors related to influenza vaccination q Target population: - all women ≥ 18 years pregnant at anytime from August through mid-November 2010 q Sample (n=1506) selected by screening households in a general population panel of ~1 million households to identify those with ≥ 1 eligible pregnant woman q Survey completion rate – 92. 7% q Follow-up survey will be administered in April 2011
Influenza vaccination coverage (%) * Influenza vaccination coverage among pregnant women, United States, November 2010 70 60 50 40 30 20 10 0 All 18 -20 21 -24 25 -29 30 -34 35 -39 Age, years *Percentages are weighted to the U. S. pregnant women population in 2010 40 -44
Place of vaccination, pregnant women, internet panel survey, United States, November 2010 (n=597) Rather not say Elementary/Middle/High School Other medically-related place Other non-medically-related place Grocery store Other clinic or health center My midwife’s office Health Department Hospital Workplace Pharmacy or drug store My family doctor or other doctor’s office My OB/GYN’s office 0, 0 5, 0 10, 0 15, 0 20, 0 Percent 25, 0 30, 0 35, 0 40, 0
Pregnancy Risk Assessment Monitoring system (PRAMS) • Population-based surveillance system. Collects information on maternal attitudes & experiences before, during & after pregnancy • Conducted by 37 states and New York City • Monthly stratified random samples of 100 --300 women with recent live births recorded in state birth certificate registries • Selected mothers are mailed a questionnaire 2 --6 months after delivery. Non-responders are contacted by telephone • Provides state-level influenza vaccination coverage estimates for pregnant women. • Data available post-season
National Health Interview Survey (NHIS) • Nationally representative annual cross-sectional household survey • Obtains information on health indicators, healthcare utilization & access, and health-related behaviors • “Gold standard”. Address based sampling frame, 75% of interviews are in-person • Information on adult vaccinations is self-reported • Information on child vaccinations is provided by a knowledgeable adult household member • Provides national influenza vaccination coverage estimates for children and adults approximately 16 months post vaccination season
Summary: 2010– 11 season coverage assessment systems System Strengths Limitations BRFSS Provides state level estimates for adults Self-reported , 2 – 3 month lag Child influenza module not conducted by all states NIS Child Influenza Module In-season state -level child estimates Vaccinations provider verified after annual data collection period Parent-reported Rapid Flu surveys In-season estimates for adults and children Data for selected local areas No state-level estimates Internet panel surveys Provide in-season coverage estimates for HCP and pregnant women No state-level estimates Excludes pregnant women with no internet No national sampling frame
Summary: 2010– 11 season coverage assessment systems System Strengths Limitations Third-party claims data Weekly national, state & local estimates of vaccinations administered in provider offices Cost CMS claims data Only source of in-season coverage Under estimates coverage estimates for nursing home residents PRAMS Provides state -level influenza vaccination coverage estimates for pregnant women Data not available in season Nationally representative coverage estimates for children and adults Data not available in season: available 16 months post season NHIS Under estimates coverage Not all states participate
Future plans (2011 -12 season) q Continue comprehensive assessment systems used for 201011 season q Publish in-season estimates on interactive CDC website http: //www. cdc. gov/flu/professionals/vaccination/vaccinecoverage. htm q Increase use of Immunization Information Systems (IIS) for state/local monitoring q Use of electronic medical records
Acknowledgments q CDC NCIRD ISD– § Carla Black, Carolyn Furlow, Liz Monsell, Helen Ding, Leah Bryan, Peng-Jun Lu, Tammy Santibanez, Amparo Gonzalez. Feliciano, Erin Kennedy , Gary Euler, Stacie Greby, Jim Singleton, Cindy Weinbaum, Abigail Shefer. q CDC BRFSS Team – Machell Town, Lina Balluz q CDC NCHS – Kathleen O’Connor, Marcie Cynamon q CMS – Jeff Kelman q NORC – Ken Copeland, Margrethe Montgomery, Nick Davis q Rand / Knowledge Networks q SDI
Thank-you. Rosanna W. Setse rsetse@cdc. gov
References 1. Thompson, MG, Shay, DK, Zhou, H. Et al. Estimates of Deaths Associated with Seasonal Influenza - United States, 1976— 2007. MMWR, August 2010: 59(33); 1057 -1062 2. Thompson WW, Shay DK, Weintraub E, et al. Influenza-associated hospitalizations in the United States. JAMA 2004; 292: 1333 --40. Disclaimer: The findings and conclusions in this report are those of the authors and do not necessarily represent the official position of the CDC.
Extra slides
Comparison: Influenza vaccination coverage* among all persons ≥ 6 months, 2009 -10 and 2010 -11 seasons 60, 0 50, 0 2009 -10 (Seasonal or H 1 N 1 vaccinations) 40, 0 30, 0 2009 -10 (seasonal Flu vaccinations only) 10, 0 2010 -11 season 0, 0 Se Au gu s pt em t b O er ct N ob ov er em b D ec er em b Ja er nu Fe ary br ua ry M ar ch Ap ril M ay Influenza vaccination coverage (%) 70, 0 Calendar month *Data sources: 2010 -11 estimates based on 2010 BRFSS & NIS data. 2009 -10 estimates based on 2009 BRFSS & NHFS data
Comparison: Influenza vaccination coverage* among children, 6 months-17 years, 2009 -10 and 2010 -11 seasons Adults ≥ 18 years Children, 6 months-17 years 60, 0 Influenza vaccination coverage (%) 50, 0 40, 0 30, 0 20, 0 10, 0 50, 0 40, 0 30, 0 2009 -10 (Seasonal + H 1 N 1 vaccinations) 2009 -10 (seasonal Flu vaccinations only) 2010 -11 season 20, 0 10, 0 Calendar month Se Aug pt us em t O be N cto r ov b e e D mb r ec e em r Ja be n r Fe ua br ry ua M ry ar ch Ap ril M ay 0, 0 A Se ug pt us em t O be c N to r ov be e r D mb ec e em r Ja ber n Fe uar br y ua M ry ar ch Ap ril M ay Influenza vaccination coverage (%) 60, 0 Calendar month
Changes in ACIP Recommendations Year Influenza vaccination recommended for: 2000 -01 Vaccination recommended for all persons aged 50– 64 years 2002 all children aged 6 -23 months, + household contacts and caregivers for children aged <2 years 2004 -05 all children aged 6 months--18 years with high-risk medical conditions and those aged 6 months-18 years who are household contacts of persons at high risk for influenza complications. 2008 --09 all children aged 5 --18 years 2009 -10 all children aged 6 months--18 years 2010 -11 all persons >6 months
Aug 7 Aug 21 Sep 4 Sept 18 Oct 2 Oct 16 Oct 30 Nov 13 Nov 27 Dec 11 Dec 25 Jan 8 Jan 22 Feb 5 Feb 19 Mar 5 Aug 7 Aug 21 Sep 4 Sept 18 Oct 2 Oct 16 Oct 30 Nov 13 Nov 27 Dec 11 Dec 25 Jan 8 Jan 22 Feb 5 Feb 19 Mar 5 Reported influenza vaccination intent among children 6 months – 17 years, by race/ethnicity, NIS Child Influenza Module, Interviews Conducted August 1, 2010 - March 5, 2011 Will Probably Get Total Non-Hispanic White Will Definitely Get Hispanic Vaccinated 100 90 80 70 60 50 40 30 20 10 0 Non-Hispanic Black Non-Hispanic Other
Aug 7 Aug 21 Sep 4 Sept 18 Oct 2 Oct 16 Oct 30 Nov 13 Nov 27 Dec 11 Dec 25 Jan 8 Jan 22 Feb 5 Feb 19 Mar 5 Reported Influenza Vaccination intent among children 6 months – 17 years, by poverty status, NIS Child Influenza Module, Interviews Conducted August 1, 2010 - March 5, 2011 Vaccinated Total Will Definitely Get Above Poverty, Income > $75 K Will Probably Get 100 90 80 70 60 50 40 30 20 10 0 Above Poverty, Income < $75 K Below Poverty
Place of Vaccination for Children 6 months - 17 Years NIS, Interviews Conducted December 26 2010 - January 29, 2011 100 90 80 70 60 50 40 30 20 10 Medical location 84. 6% Non-medical location 15. 1% Refused Don't know Other Non-Medical Place School Workplace Pharmacy or Drug Store Health Department Other Medically-Related Place Hospital Clinic or Health Center Doctor's Office 0
State-level cumulative Influenza Vaccination Coverage , Adults ≥ 18 years, BRFSS, August through November 2010