Assessing Global Tropical Cyclone Intensity Through Crowd Sourcing

Assessing Global Tropical Cyclone Intensity Through Crowd Sourcing Chris Hennon 1, Ken Knapp 2, Carl Schreck III 3 and Scott Stevens 3 Paula Hennon 3, Jim Kossin 2, Michael Kruk 4, Jared Rennie 3, Laura Stevens 3, Peter Thorne 3 3 David Miller, David Weiner Citizen Science Alliance 1 4 2
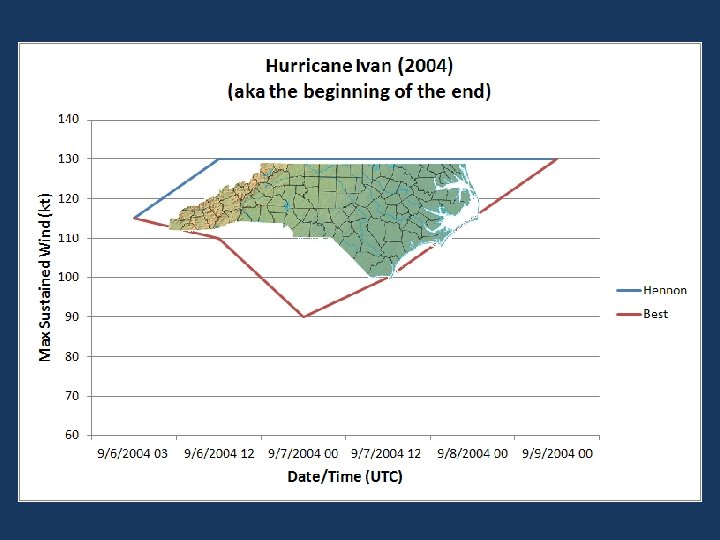

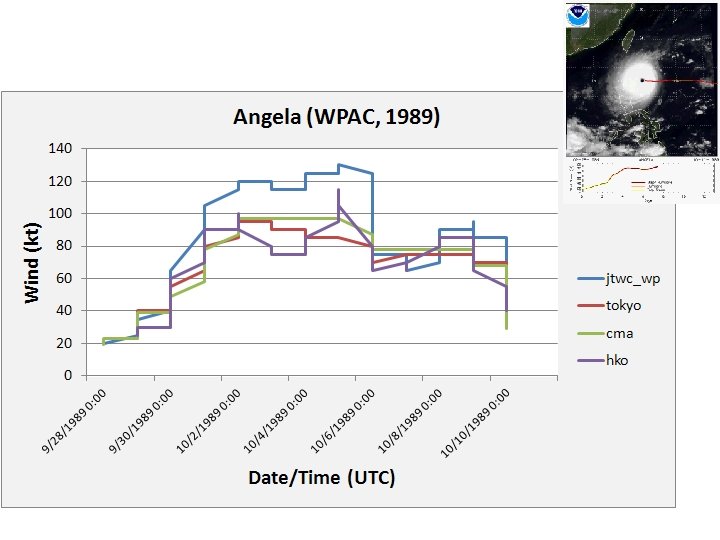
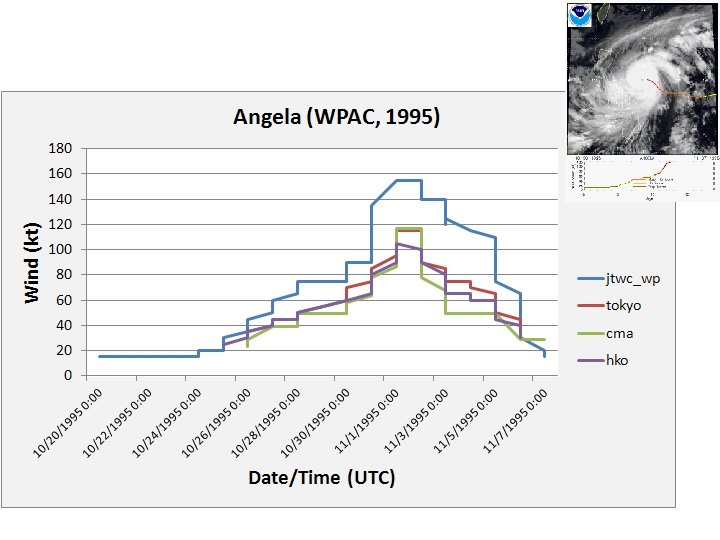
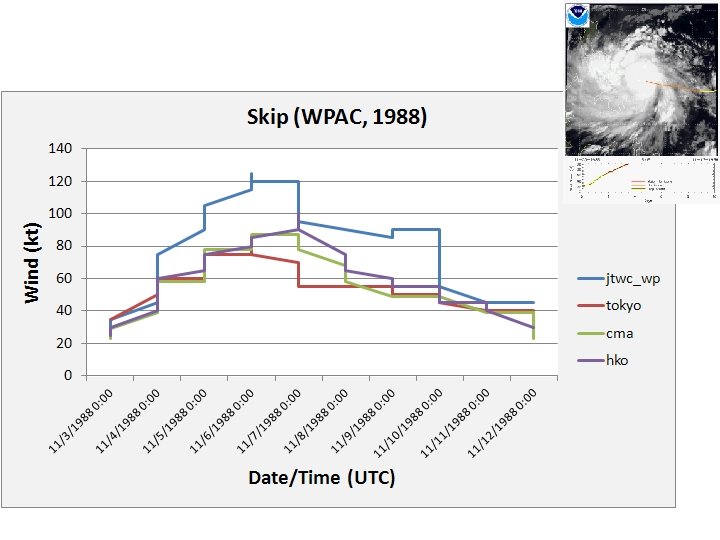
Motivation • Heterogeneous tropical cyclone intensity record – Little if any recon – Deviations from Dvorak rules between RSMCs – Operational intensities from a small number of opinions

Western Pacific WPAC Recon ends

Objective • Provide a global analysis of 3 -hourly tropical cyclone intensity – Focus on storms where there is large disagreement in intensities among RSMCs – Quantify uncertainties in intensity determination – Provide information on storm characteristics • e. g. size, eye type, eye size, cloud pattern, T(b)

But We Already Have the ADT? • Premise: Main shortcoming of Dvorak Technique is the “inherent subjectivity and the widely varying expertise levels of the TC forecasters who use it” • Our Premise: Subjective estimates by thousands of trained users is potentially powerful – Humans better at pattern recognition • Complement traditional Dvorak and ADT Olander and Velden (2007)

Date/ Time CI Adj. Ini. Raw Scene Lat. Lon. Fix Method 09/2330 3. 9 4. 0 EMBC 16. 87 129. 17 FCST 10/0000 3. 9 4. 0 EMBC 16. 91 129. 20 FCST 10/0030 3. 9 EMBC 16. 92 129. 08 SPRL 10/0100 3. 9 UNIFRM 16. 86 129. 11 SPRL 10/0130 4. 4 5. 5 EYE 10/0200 4. 0 3. 7 EMBC 17. 88 128. 97 SPRL 10/0230 4. 5 5. 5 EYE 17. 10 129. 10 SPRL 10/0300 4. 1 4. 4 5. 6 EYE 17. 15 129. 03 SPRL 10/0330 4. 1 4. 5 5. 8 EYE 17. 20 129. 07 SPRL 17. 02 129. 14 COMBO
 Have users apply Dvorak-like procedure")
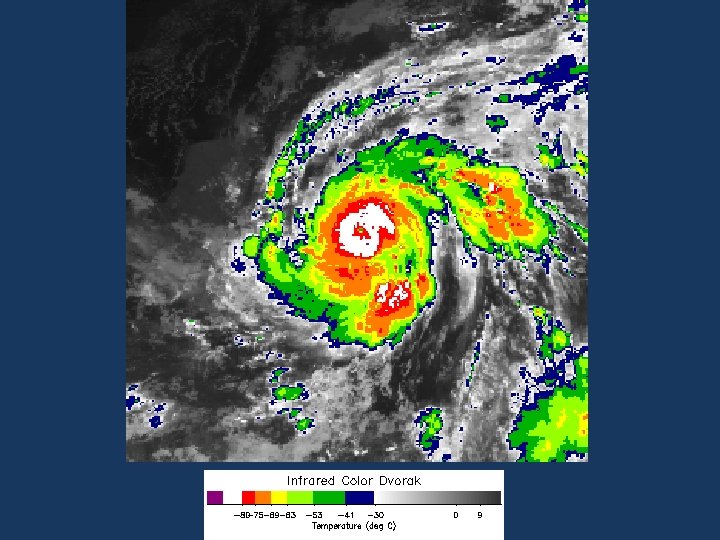
How Will This Work? Global IR Satellite Imagery (HURSAT) Have users apply Dvorak-like procedure Apply QC procedures/ constraints

HURSAT Overview Raw Satellite Data Geostationary Imagers • Infrared window • Visible • Infrared water vapor Format? Navigation? Remapping? Data volume? Analysis HURSAT-B 1 • Brightness Temperatures • Geo-located • Calibrated • net. CDF • New intensity estimates (e. g. , Kossin et al. 2006)
")
HURSAT-B 1 • Global reanalyzed satellite data from International Satellite Cloud Climatology Project (ISCPP) – 1978 -2009 – 8 km spatial resolution, 3 -hourly time resolution – 25 satellites, 3321 TCs, 198, 556 unique storm observations – Visible (~0. 6 μm), IR (~11 μm) regularly available Knapp and Kossin 2007

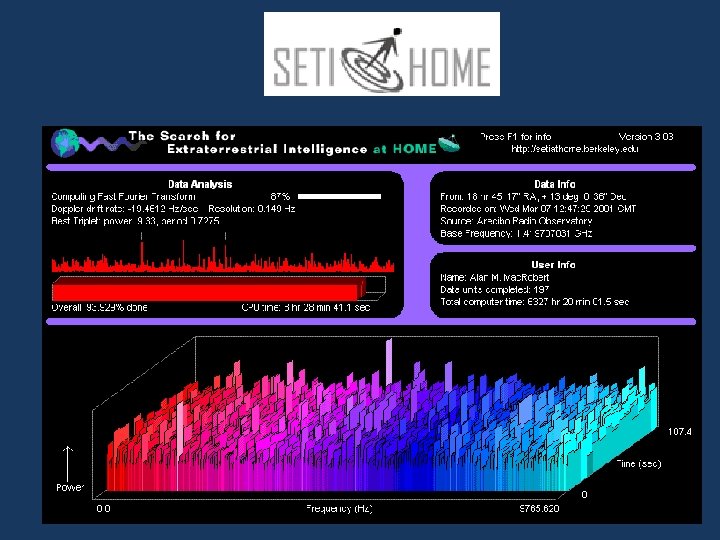
Bringing Collaborators Into the Project • Citizen Science - Accessing the power of numbers to collect and analyze scientific data – Large research projects requiring thousands of hours can be accomplished in much less time – Promotes public engagement with science – Serendipity – Accuracy

Power of the People • 200, 000 images x 20 classifications/each x 5 minutes/classification = 20, 000 minutes – 38 years for 1 person, 7. 6 years for a team of 5 working non-stop • 1 -2 months for a “team” of 100, 000 people if they do 40 classifications each
 27 counters (1900) to thousands")
Christmas Bird Count First Example of Citizen Science (1900) 27 counters (1900) to thousands today Frank Chapman Audubon Society European Starling - most counted bird in Miami-Dade County
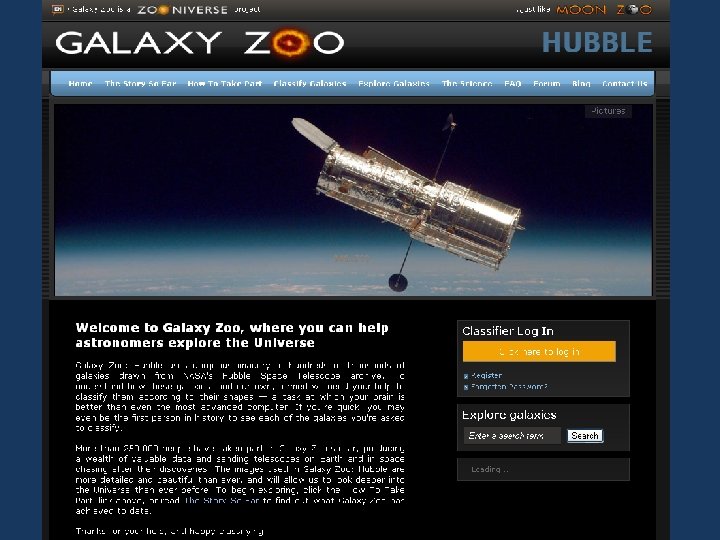

“…a collaboration of scientists, software developers and educators who collectively develop, manage, and utilise internet-based citizen science projects in order to further science itself, and the public understanding of both science and the scientific process. These projects use the time, abilities and energies of a distributed community of citizen scientists who are our collaborators”

The Training Process • Use examples to train first time users on the tasks they will have to do – Determine cloud pattern – Eye type – Finding the center – Banding length – IR Enhancement scheme (like a layer cake)

Selecting an image to classify Bank 2 – 16 Hand-picked images ~1000 each Bank 1 – All images in HURSAT (~200, 000) 20 -50 each ~300 each Bank 3 – 1000 images, including storms with biggest differences Collaborator (200, 000? )

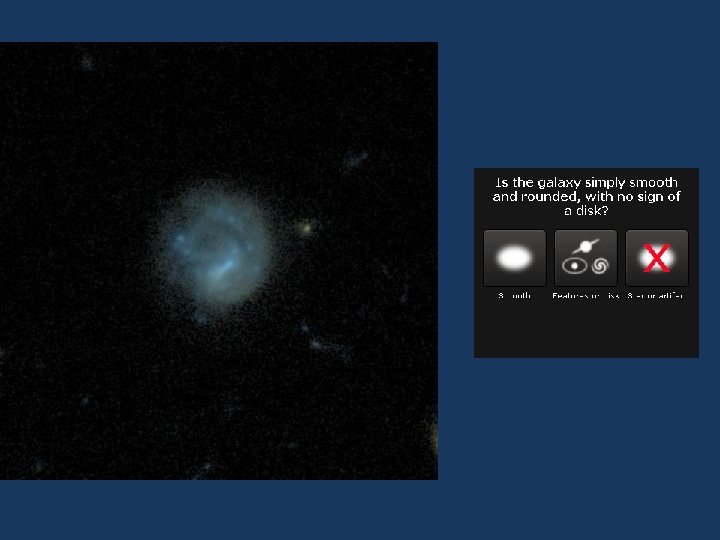
The Classification Process • Apply Dvorak technique to scene presented to user – User has no knowledge of storm history (or even what storm it is) – Responses to questions will lead to other targeted questions – Classification (“DT-like” number) based on user responses to questions and user actions • Software handles other decisions behind the scenes – E. g. , Eye temp vs. coldest band temp
")
Sample TC Classification (Eye Pattern – Hurricane Katrina)

Does this tropical cyclone have an “eye”? Yes No User clicks “Yes”

What type of eye most resembles the eye in the image? Sharp, distinct Ragged User clicks “sharp” Pinhole

Click on the image where you believe the center of the eye is. Center position recorded in database

Draw a circle that designates the outer edge of the eye Program determines and records the warmest pixel inside the user-defined circle. Can also record eye size for database.

Which color completely surrounds the eye? User should select white, perhaps black
![Draw a line from the inner edge of the [color] band (closest to the](http://slidetodoc.com/presentation_image_h2/ab4136b0b152e68567bac5c0de07c0f0/image-31.jpg "Draw a line from the inner edge of the [color] band (closest to the")
Draw a line from the inner edge of the [color] band (closest to the eye) to the outer edge at the thinnest point in the band User draws line as indicated Program calculates distance the line traverses. If it is at least 0. 5 degrees, then use that color for the eye adjustment. If it is < 0. 5 degrees, ask them to measure again for the next color (black)– other rules apply

• A CF number can now be calculated – CF = Eye Number + Eye Adjustment • For this case (from Dvorak tables), – Eye Number = 5. 5 – Eye Adjustment (based on eye temperature) = 1. 0 – CF = 6. 5 • In most cases, DT = CF for eye feature storms Give user the final intensity (maximum wind: DT 6. 5 = 127 kt. /146 mph/Category 4 ) Best track = 145 kt. at 1200 UTC 08/28/05

Post-Processing of DT Data • Filter outlier classifications • Apply Dvorak constraints – changes in DT numbers – pattern requirements • Apply advanced Dvorak adjustments? • Calculate uncertainties

Metadata • Opportunity to collect other storm information along the way – Eye size, temperature, pattern type – Storm size and shape – Banding features • Uncertainties • Other?
 Web development (April-May) Tutorial development and testing(June-July)")
Timeline • • Decision trees established (March) Web development (April-May) Tutorial development and testing(June-July) Launch September 1, 2012

Challenges and Questions • How good will a community “Dvorak” technique work? Can it be done well enough to yield a useful intensity dataset? • How will challenging patterns be handled? • Can a reasonable classification be done in the absence of visible/microwave imagery, esp. without prior storm knowledge? • Can reliable Dvorak-like classifications be done with 8 km resolution data? • Sub-tropical systems

Applications of Intensity Data • A new source of TC intensity during the satellite era (3 -hourly) • New climatology of storm morphology • Comparisons to ADT (has been run on entire HURSAT archive) • Comparisons to other reanalysis efforts • Comparisons to Brown and Franklin Dvorak errors • Other ideas? ?

References • Knapp, K. R. , and J. P. Kossin, 2007: New global tropical cylone data from ISCCP B 1 geostationary satellite observations. Journal of Applied Remote Sensing, 1, 013505. • Kossin, J. P. , K. R. Knapp, D. J. Vimont, R. J. Murnane, and B. A. Harper, 2006: A globally consistent reanlysis of hurricane variability and trends. Geophysical Research Letters, 34, L 04815, DOI: 10. 1029/2006 GL 028836. • Olander, T. L. , and C. S. Velden, 2007: The advanced Dvorak technique: Continued development of an objective scheme to estimate tropical cyclone intensity using geostationary infrared imagery. Weather and Forecasting, 22, 287 -298.
- Slides: 38