
Assessing English Proficiency and Using Language Data for

- Slides: 23
Assessing English Proficiency and Using Language Data for EAL Learners EAL Briefing 22 nd November 2018 Lambeth Civic Centre Brixton
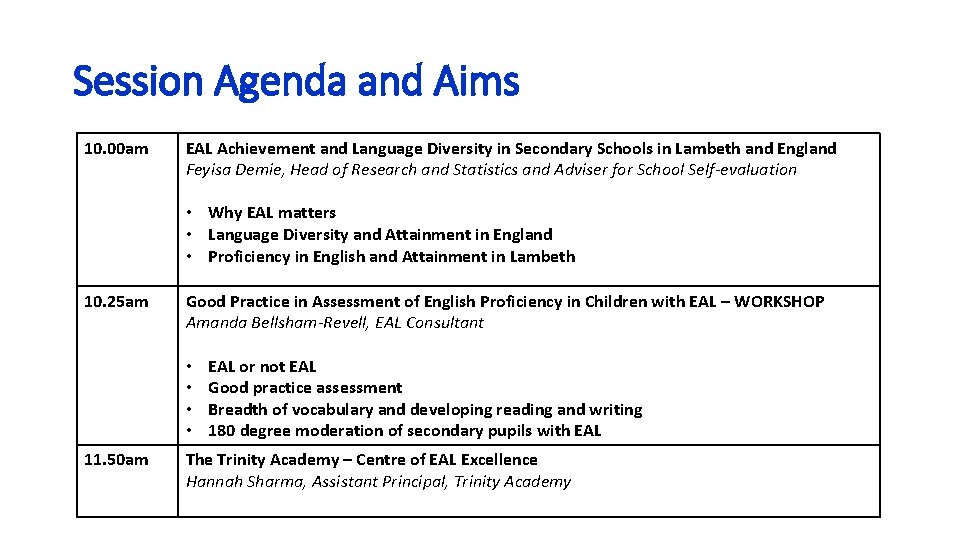
Session Agenda and Aims 10. 00 am EAL Achievement and Language Diversity in Secondary Schools in Lambeth and England Feyisa Demie, Head of Research and Statistics and Adviser for School Self-evaluation • Why EAL matters • Language Diversity and Attainment in England • Proficiency in English and Attainment in Lambeth 10. 25 am Good Practice in Assessment of English Proficiency in Children with EAL – WORKSHOP Amanda Bellsham-Revell, EAL Consultant • • 11. 50 am EAL or not EAL Good practice assessment Breadth of vocabulary and developing reading and writing 180 degree moderation of secondary pupils with EAL The Trinity Academy – Centre of EAL Excellence Hannah Sharma, Assistant Principal, Trinity Academy
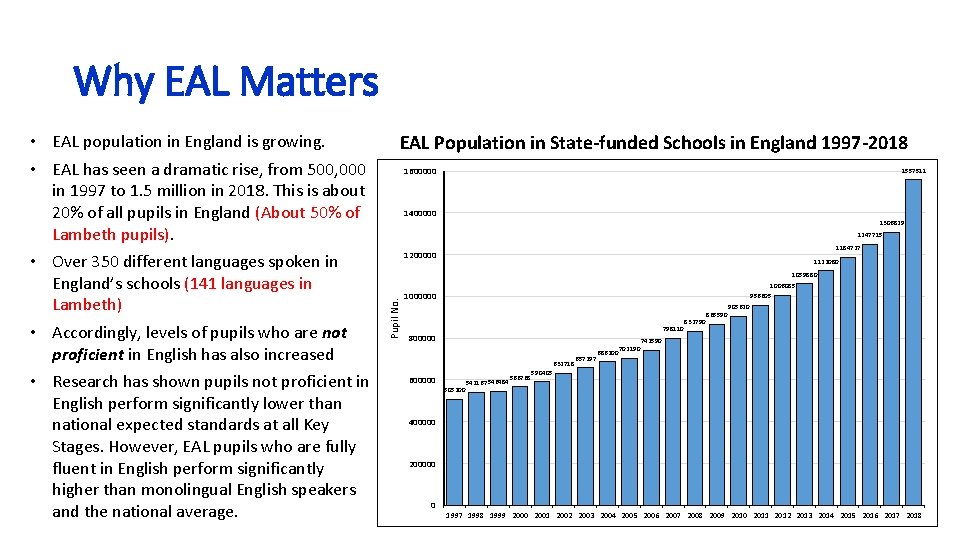
Why EAL Matters EAL Population in State-funded Schools in England 1997 -2018 1600000 1557511 1400000 1306829 1247715 1184727 1200000 1122080 1059880 Pupil No. • EAL population in England is growing. • EAL has seen a dramatic rise, from 500, 000 in 1997 to 1. 5 million in 2018. This is about 20% of all pupils in England (About 50% of Lambeth pupils). • Over 350 different languages spoken in England’s schools (141 languages in Lambeth) • Accordingly, levels of pupils who are not proficient in English has also increased • Research has shown pupils not proficient in English perform significantly lower than national expected standards at all Key Stages. However, EAL pupils who are fully fluent in English perform significantly higher than monolingual English speakers and the national average. 1006085 956605 1000000 798110 800000 632718 600000 505200 542167 546484 566768 657297 686200 702190 832790 865590 905620 742590 590405 400000 200000 0 1997 1998 1999 2000 2001 2002 2003 2004 2005 2006 2007 2008 2009 2010 2011 2012 2013 2014 2015 2016 2017 2018
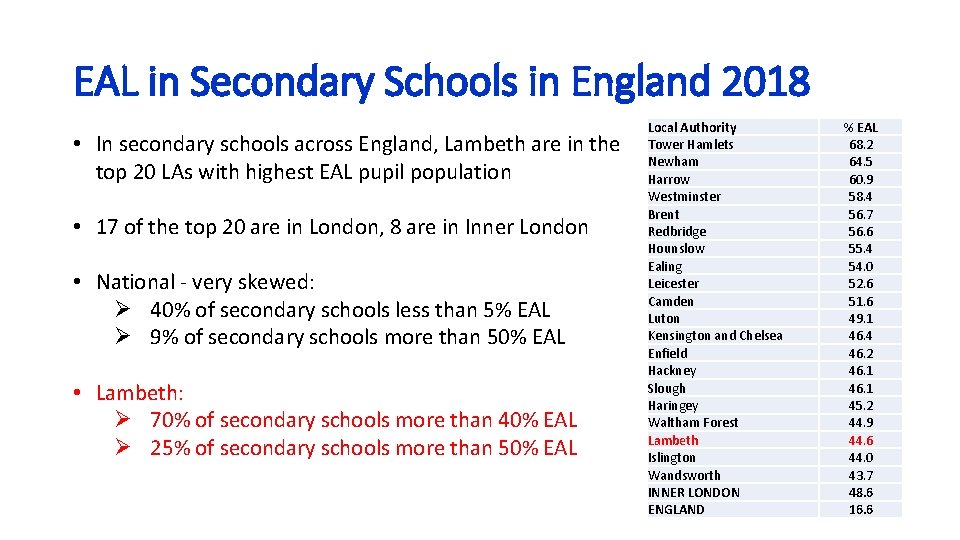
EAL in Secondary Schools in England 2018 • In secondary schools across England, Lambeth are in the top 20 LAs with highest EAL pupil population • 17 of the top 20 are in London, 8 are in Inner London • National - very skewed: Ø 40% of secondary schools less than 5% EAL Ø 9% of secondary schools more than 50% EAL • Lambeth: Ø 70% of secondary schools more than 40% EAL Ø 25% of secondary schools more than 50% EAL Local Authority Tower Hamlets Newham Harrow Westminster Brent Redbridge Hounslow Ealing Leicester Camden Luton Kensington and Chelsea Enfield Hackney Slough Haringey Waltham Forest Lambeth Islington Wandsworth INNER LONDON ENGLAND % EAL 68. 2 64. 5 60. 9 58. 4 56. 7 56. 6 55. 4 54. 0 52. 6 51. 6 49. 1 46. 4 46. 2 46. 1 45. 2 44. 9 44. 6 44. 0 43. 7 48. 6 16. 6
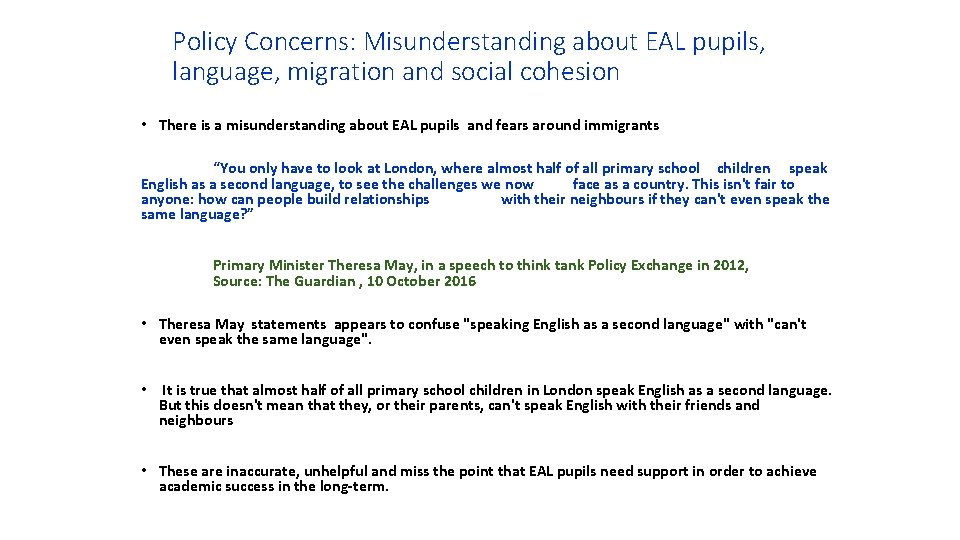
Policy Concerns: Misunderstanding about EAL pupils, language, migration and social cohesion • There is a misunderstanding about EAL pupils and fears around immigrants “You only have to look at London, where almost half of all primary school children speak English as a second language, to see the challenges we now face as a country. This isn't fair to anyone: how can people build relationships with their neighbours if they can't even speak the same language? ” Primary Minister Theresa May, in a speech to think tank Policy Exchange in 2012, Source: The Guardian , 10 October 2016 • Theresa May statements appears to confuse "speaking English as a second language" with "can't even speak the same language". • It is true that almost half of all primary school children in London speak English as a second language. But this doesn't mean that they, or their parents, can't speak English with their friends and neighbours • These are inaccurate, unhelpful and miss the point that EAL pupils need support in order to achieve academic success in the long-term.
What does the data tell us about EAL English Proficiency?
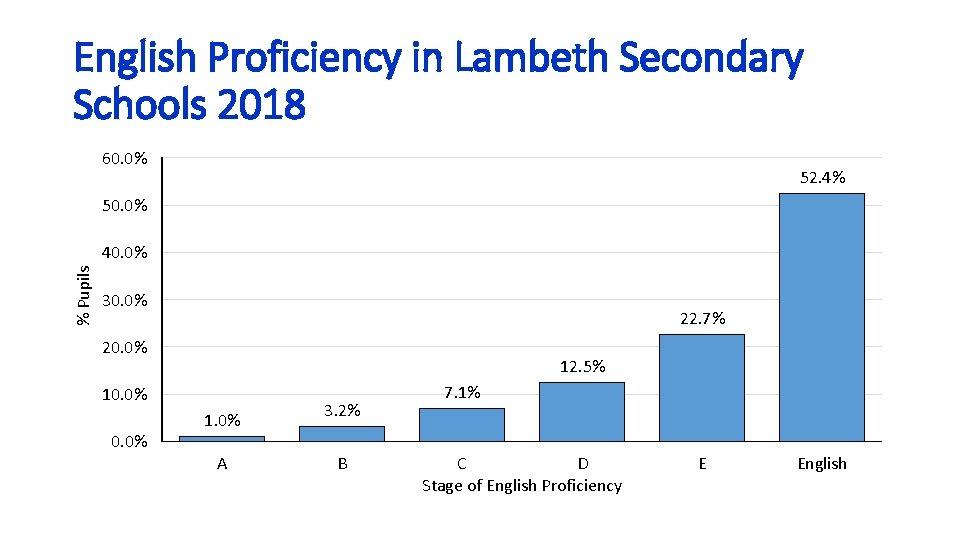
English Proficiency in Lambeth Secondary Schools 2018 60. 0% 52. 4% 50. 0% % Pupils 40. 0% 30. 0% 22. 7% 20. 0% 12. 5% 10. 0% 1. 0% A 3. 2% B 7. 1% C D Stage of English Proficiency E English
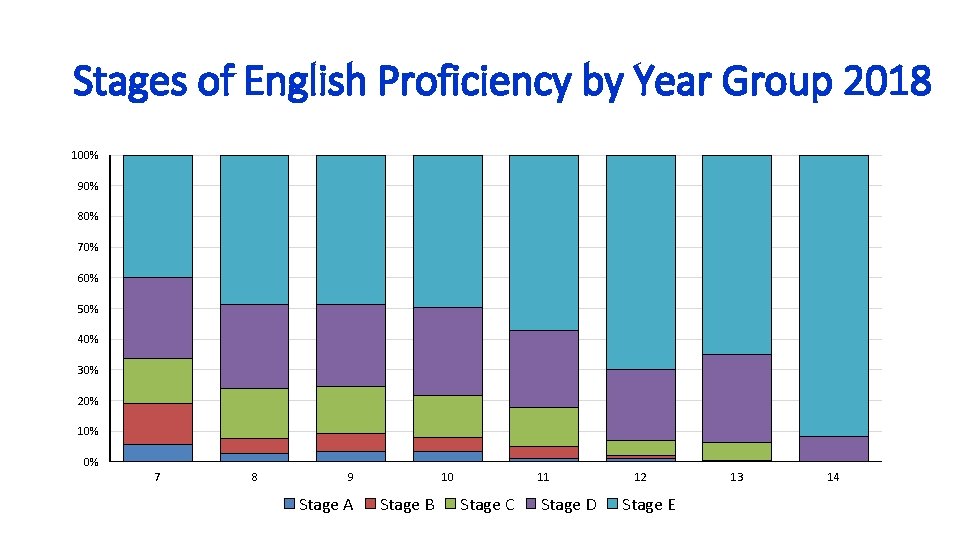
Stages of English Proficiency by Year Group 2018 100% 90% 80% 70% 60% 50% 40% 30% 20% 10% 0% 7 8 9 Stage A 10 Stage B 11 Stage C Stage D 12 Stage E 13 14
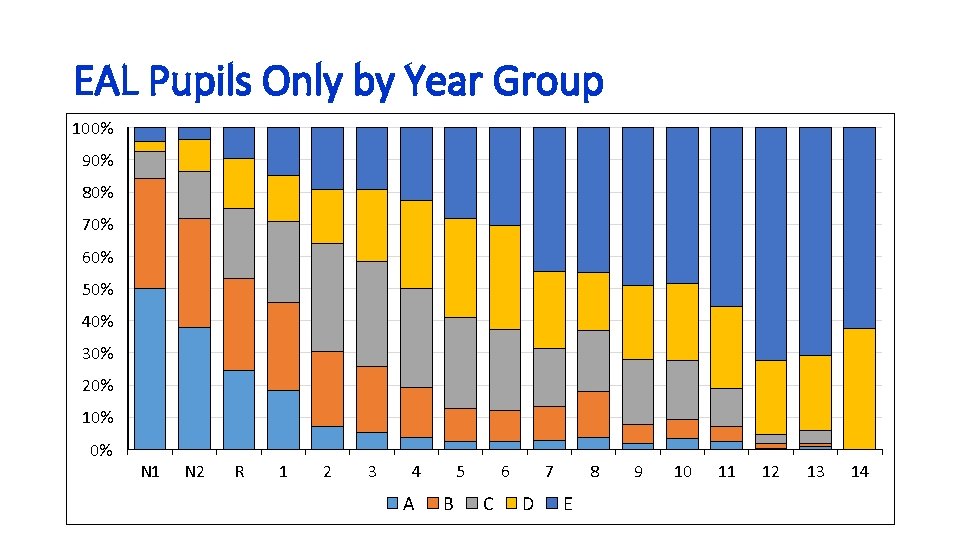
EAL Pupils Only by Year Group 100% 90% 80% 70% 60% 50% 40% 30% 20% 10% 0% N 1 N 2 R 1 2 3 4 A 5 B 6 C 7 D 8 E 9 10 11 12 13 14
What does the data tell us about EAL Attainment and Language Diversity?
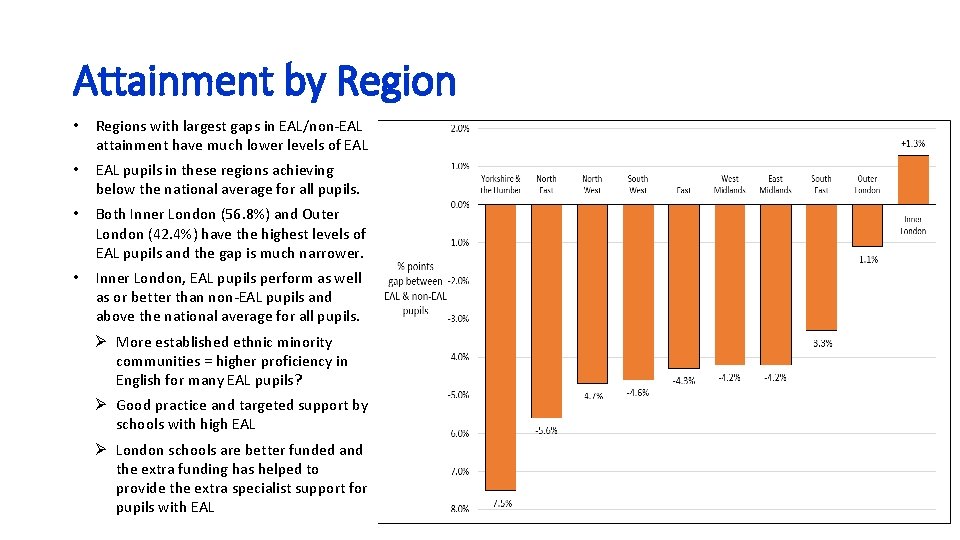
Attainment by Region • Regions with largest gaps in EAL/non-EAL attainment have much lower levels of EAL • EAL pupils in these regions achieving below the national average for all pupils. • Both Inner London (56. 8%) and Outer London (42. 4%) have the highest levels of EAL pupils and the gap is much narrower. • Inner London, EAL pupils perform as well as or better than non-EAL pupils and above the national average for all pupils. Ø More established ethnic minority communities = higher proficiency in English for many EAL pupils? Ø Good practice and targeted support by schools with high EAL Ø London schools are better funded and the extra funding has helped to provide the extra specialist support for pupils with EAL
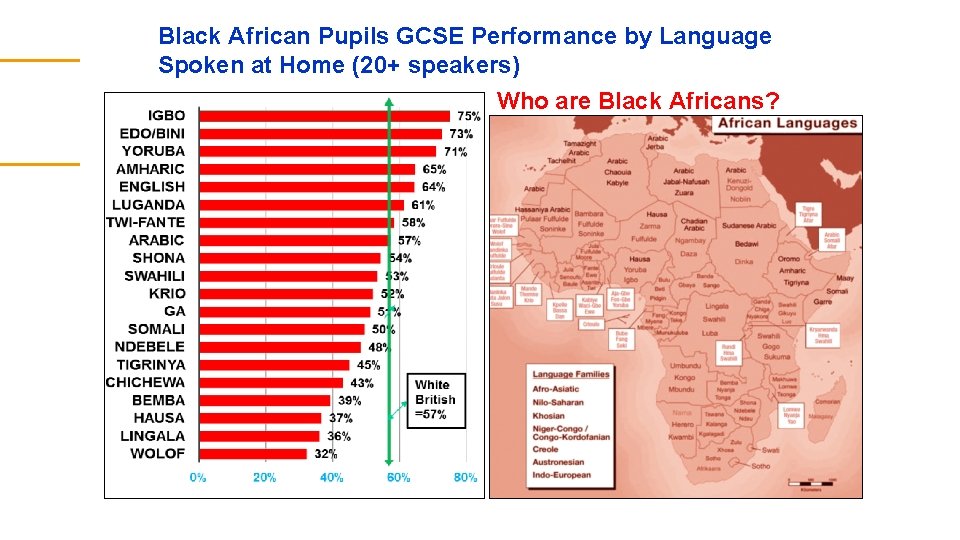
Concerns about using EAL and non-EAL categories for monitoring EAL attainment • A need to be cautious when talking about EAL/Non-EAL and attainment • EAL is a very heterogeneous group made up of pupils from many different ethnic and cultural backgrounds. Some of these sub-groups of EAL pupils do very well academically, others perform very poorly. • Conflating all of these pupils into a single group, masks underachieving groups of pupils • Ethnicity and EAL map together very well and has allowed research to analyse different ethnic groups of pupils with EAL. • However, previous research has noted that the recording of ethnicity in England usually refers, confusingly, to a combination of national boundaries (Indian, Pakistani, Bangladeshi) but also colour (Black, White) and more general geographic distinctions, that supersede national boundaries (Black Caribbean, Black African). • Language data instead can help to identify specific groups of pupils who may be high performing or underachieving
Black African Pupils GCSE Performance by Language Spoken at Home (20+ speakers) Who are Black Africans?
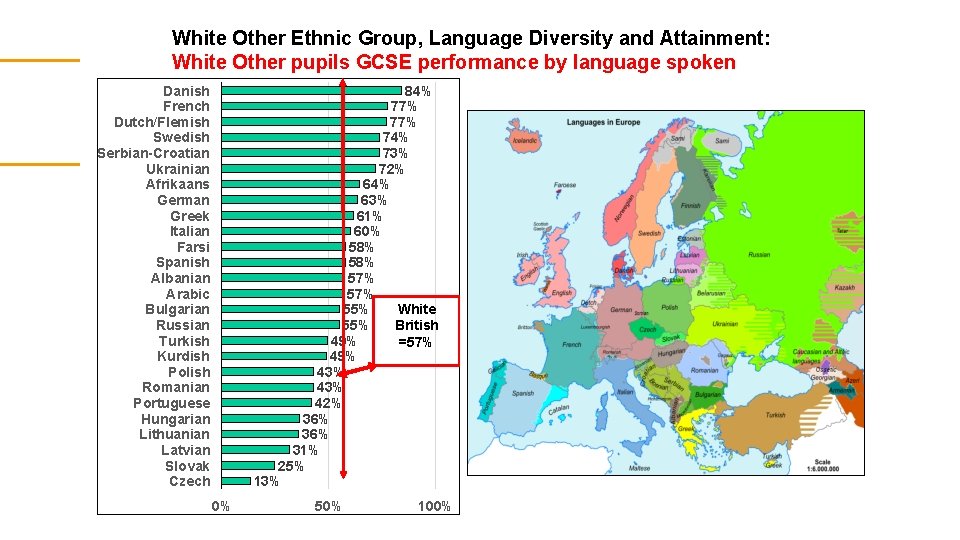
White Other Ethnic Group, Language Diversity and Attainment: White Other pupils GCSE performance by language spoken Danish French Dutch/Flemish Swedish Serbian-Croatian Ukrainian Afrikaans German Greek Italian Farsi Spanish Albanian Arabic Bulgarian Russian Turkish Kurdish Polish Romanian Portuguese Hungarian Lithuanian Latvian Slovak Czech 84% 77% 74% 73% 72% 64% 63% 61% 60% 58% 57% White 55% British 49% =57% 49% 43% 42% 36% 31% 25% 13% 0% 50% 100%
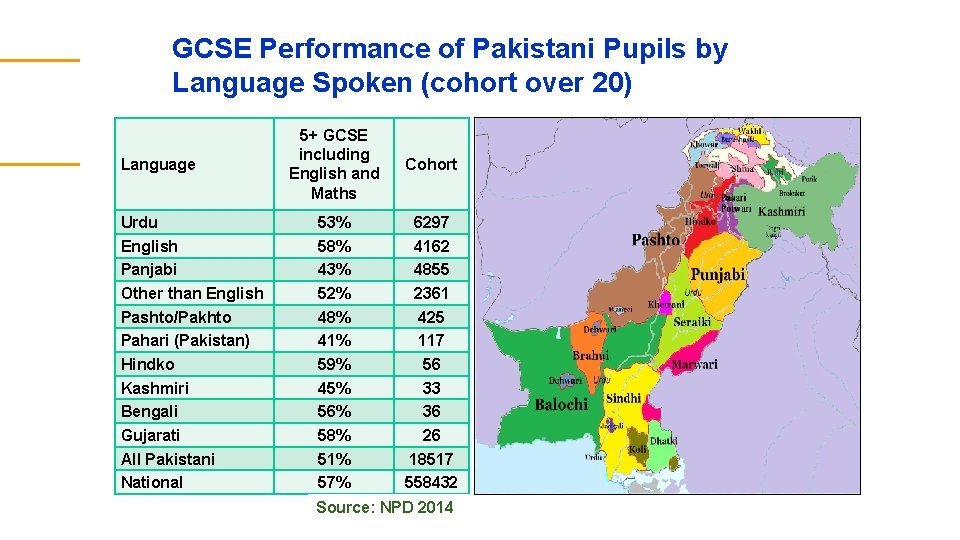
GCSE Performance of Pakistani Pupils by Language Spoken (cohort over 20) Language Urdu English Panjabi Other than English Pashto/Pakhto Pahari (Pakistan) Hindko Kashmiri Bengali Gujarati All Pakistani National 5+ GCSE including English and Maths Cohort 53% 58% 43% 52% 48% 41% 59% 45% 56% 58% 51% 57% 6297 4162 4855 2361 425 117 56 33 36 26 18517 558432 Source: NPD 2014
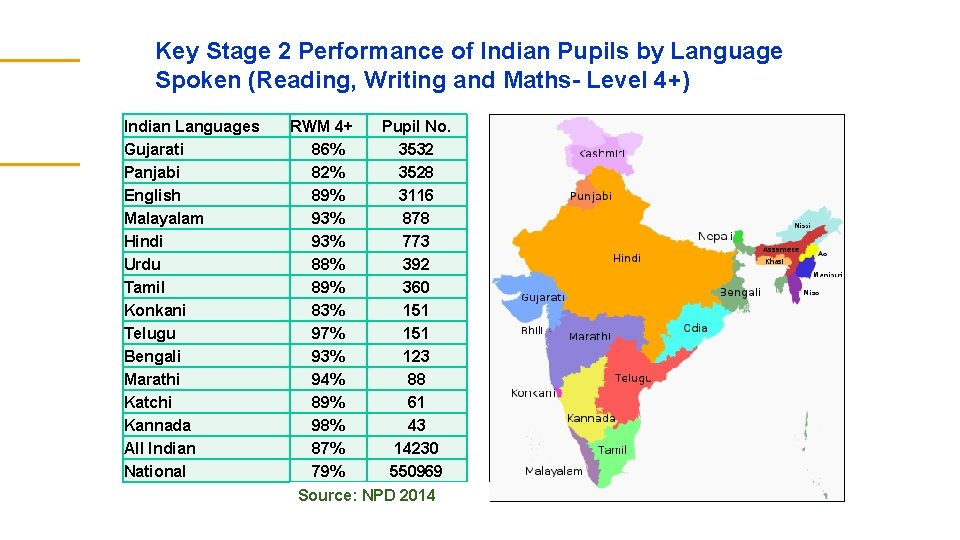
Key Stage 2 Performance of Indian Pupils by Language Spoken (Reading, Writing and Maths- Level 4+) Indian Languages Gujarati Panjabi English Malayalam Hindi Urdu Tamil Konkani Telugu Bengali Marathi Katchi Kannada All Indian National RWM 4+ 86% 82% 89% 93% 88% 89% 83% 97% 93% 94% 89% 98% 87% 79% Pupil No. 3532 3528 3116 878 773 392 360 151 123 88 61 43 14230 550969 Source: NPD 2014
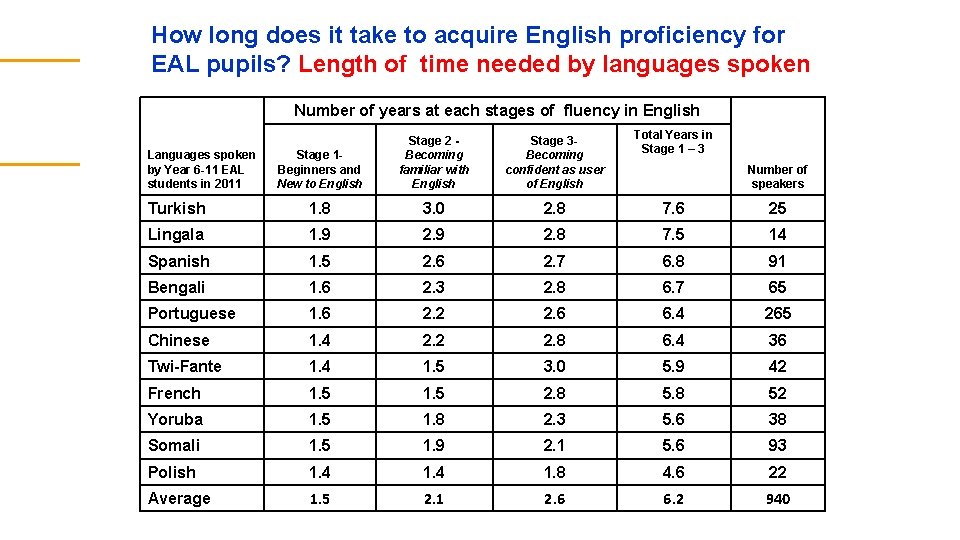
School Funding and EAL Proficiency Issues: How long does it take to acquire English proficiency for EAL pupils? • One of the most commonly asked questions about the education of EAL students not fluent in English is how long they need special language support. • For pupils to have full access to the curriculum, they need to be fluent in English. Local Authorities and schools have an obligation to provide appropriate services to EAL students to learn English. • No previous research on how long it takes to acquire English fluency in UK because of lack of data but in Lambeth we tracked backwards 940 year 6 -11 EAL pupils in the LA who were fully fluent in English, year by year, to establish how long each pupil was at a particular stage of English fluency and how long it took overall to become fully fluent from the time they were first assessed when they started school. • The Lambeth study suggests it takes about 5 to 7 years, on average, for EAL pupils to acquire academic English fluency. • However there is a variation how long it takes at each stage of fluency. Longitudinal data in the LA shows that it takes about 1. 5 years to complete beginner stage 1 level of fluency, about 2 years to complete stage 2 in becoming familiar with English and another two-and-ahalf years to complete stage 3 -becoming a confident user of English. • It makes more sense to set aside the seven years of primary and secondary schooling as a reasonable time frame for students to gain English proficiency.
How long does it take to acquire English proficiency for EAL pupils? Length of time needed by languages spoken Number of years at each stages of fluency in English Total Years in Stage 1 – 3 Stage 1 - Beginners and New to English Stage 2 Becoming familiar with English Stage 3 Becoming confident as user of English Turkish 1. 8 3. 0 2. 8 7. 6 25 Lingala 1. 9 2. 8 7. 5 14 Spanish 1. 5 2. 6 2. 7 6. 8 91 Bengali 1. 6 2. 3 2. 8 6. 7 65 Portuguese 1. 6 2. 2 2. 6 6. 4 265 Chinese 1. 4 2. 2 2. 8 6. 4 36 Twi-Fante 1. 4 1. 5 3. 0 5. 9 42 French 1. 5 2. 8 52 Yoruba 1. 5 1. 8 2. 3 5. 6 38 Somali 1. 5 1. 9 2. 1 5. 6 93 Polish 1. 4 1. 8 4. 6 22 Average 1. 5 2. 1 2. 6 6. 2 940 Languages spoken by Year 6 -11 EAL students in 2011 Number of speakers
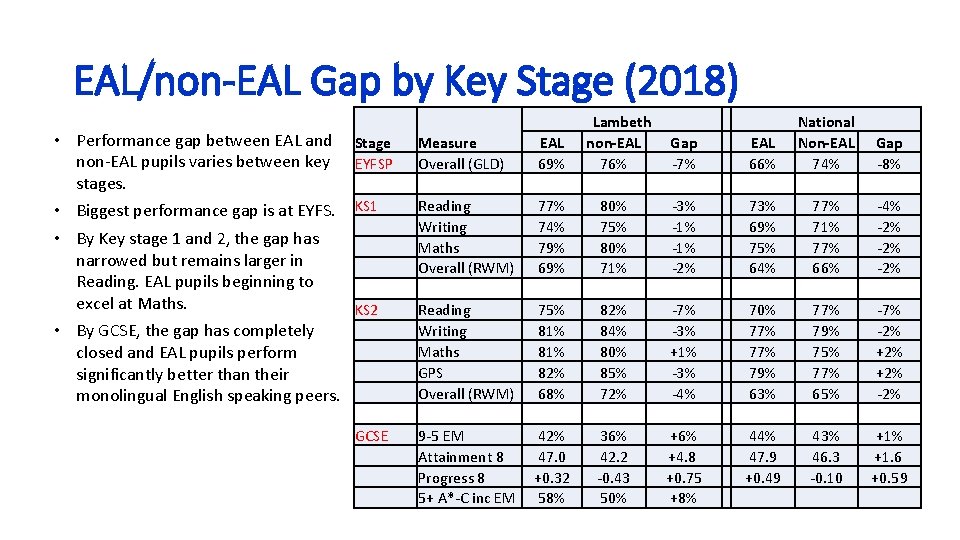
EAL/non-EAL Gap by Key Stage (2018) • Performance gap between EAL and non-EAL pupils varies between key stages. • Biggest performance gap is at EYFS. • By Key stage 1 and 2, the gap has narrowed but remains larger in Reading. EAL pupils beginning to excel at Maths. • By GCSE, the gap has completely closed and EAL pupils perform significantly better than their monolingual English speaking peers. Stage EYFSP KS 1 KS 2 GCSE Measure Overall (GLD) EAL 69% Reading Writing Maths Overall (RWM) Reading Writing Maths GPS Overall (RWM) 9 -5 EM Attainment 8 Progress 8 5+ A*-C inc EM 77% 74% 79% 69% 75% 81% 82% 68% 42% 47. 0 +0. 32 58% Lambeth non-EAL 76% 80% 75% 80% 71% 82% 84% 80% 85% 72% 36% 42. 2 -0. 43 50% Gap -7% -3% -1% -2% -7% -3% +1% -3% -4% +6% +4. 8 +0. 75 +8% EAL 66% National Non-EAL 74% Gap -8% 73% 69% 75% 64% 70% 77% 79% 63% 44% 47. 9 +0. 49 77% 71% 77% 66% 77% 79% 75% 77% 65% 43% 46. 3 -0. 10 -4% -2% -2% -7% -2% +2% -2% +1% +1. 6 +0. 59
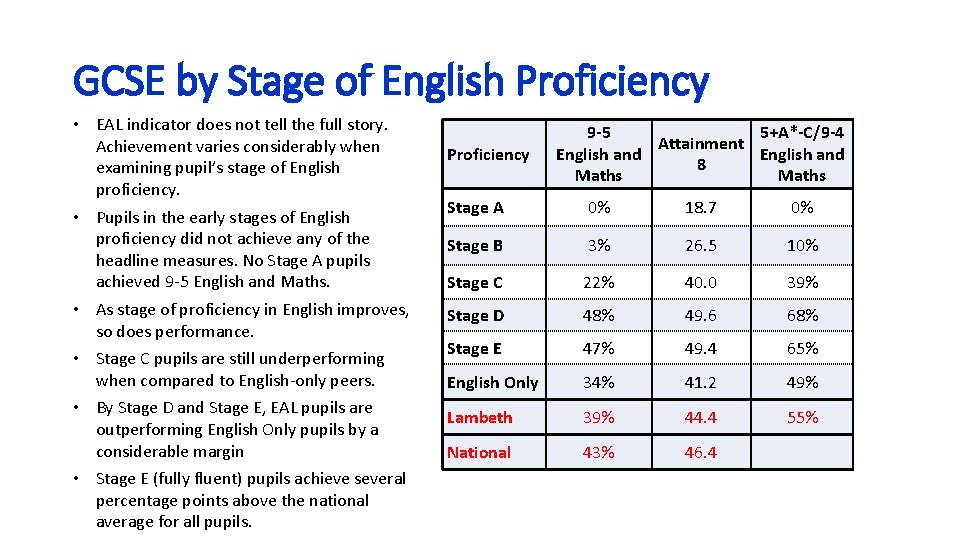
GCSE by Stage of English Proficiency • EAL indicator does not tell the full story. Achievement varies considerably when examining pupil’s stage of English proficiency. • Pupils in the early stages of English proficiency did not achieve any of the headline measures. No Stage A pupils achieved 9 -5 English and Maths. • As stage of proficiency in English improves, so does performance. • Stage C pupils are still underperforming when compared to English-only peers. • By Stage D and Stage E, EAL pupils are outperforming English Only pupils by a considerable margin • Stage E (fully fluent) pupils achieve several percentage points above the national average for all pupils. Proficiency 9 -5 5+A*-C/9 -4 Attainment English and 8 Maths Stage A 0% 18. 7 0% Stage B 3% 26. 5 10% Stage C 22% 40. 0 39% Stage D 48% 49. 6 68% Stage E 47% 49. 4 65% English Only 34% 41. 2 49% Lambeth 39% 44. 4 55% National 43% 46. 4
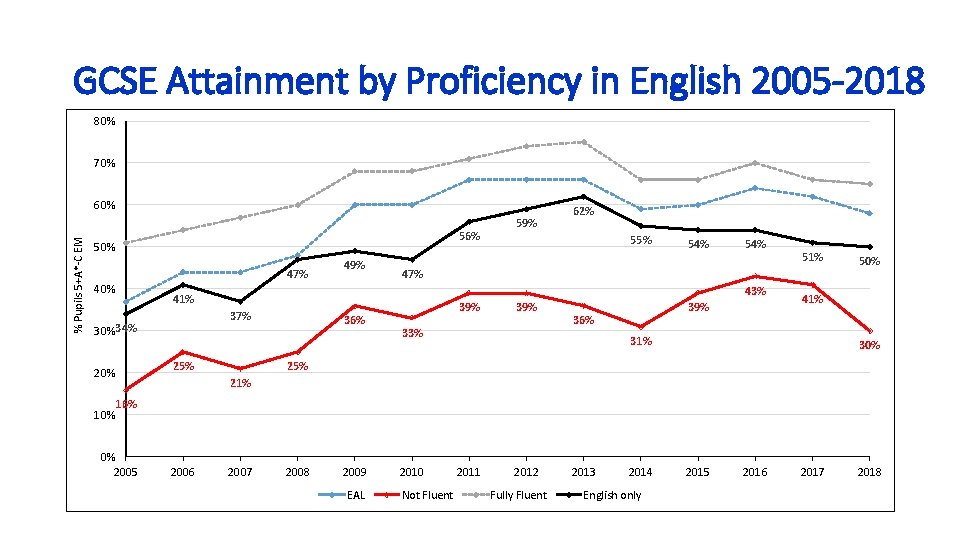
GCSE Attainment by Proficiency in English 2005 -2018 80% 70% % Pupils 5+A*-C EM 60% 56% 50% 47% 40% 55% 54% 43% 37% 25% 20% 62% 36% 51% 47% 41% 30%34% 10% 49% 59% 39% 33% 39% 36% 50% 41% 30% 25% 21% 16% 0% 2005 2006 2007 2008 2009 EAL 2010 Not Fluent 2011 2012 Fully Fluent 2013 2014 English only 2015 2016 2017 2018
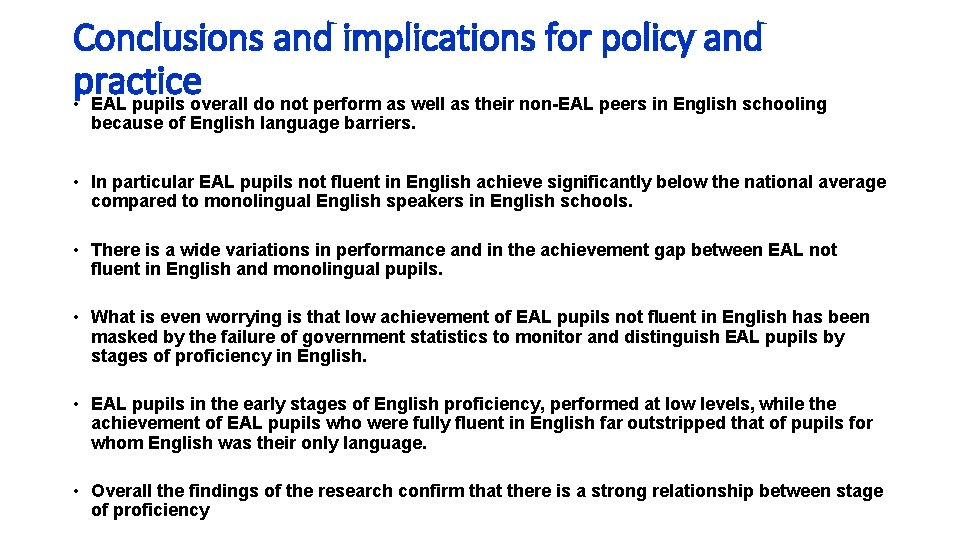
Conclusions and implications for policy and practice • EAL pupils overall do not perform as well as their non-EAL peers in English schooling because of English language barriers. • In particular EAL pupils not fluent in English achieve significantly below the national average compared to monolingual English speakers in English schools. • There is a wide variations in performance and in the achievement gap between EAL not fluent in English and monolingual pupils. • What is even worrying is that low achievement of EAL pupils not fluent in English has been masked by the failure of government statistics to monitor and distinguish EAL pupils by stages of proficiency in English. • EAL pupils in the early stages of English proficiency, performed at low levels, while the achievement of EAL pupils who were fully fluent in English far outstripped that of pupils for whom English was their only language. • Overall the findings of the research confirm that there is a strong relationship between stage of proficiency
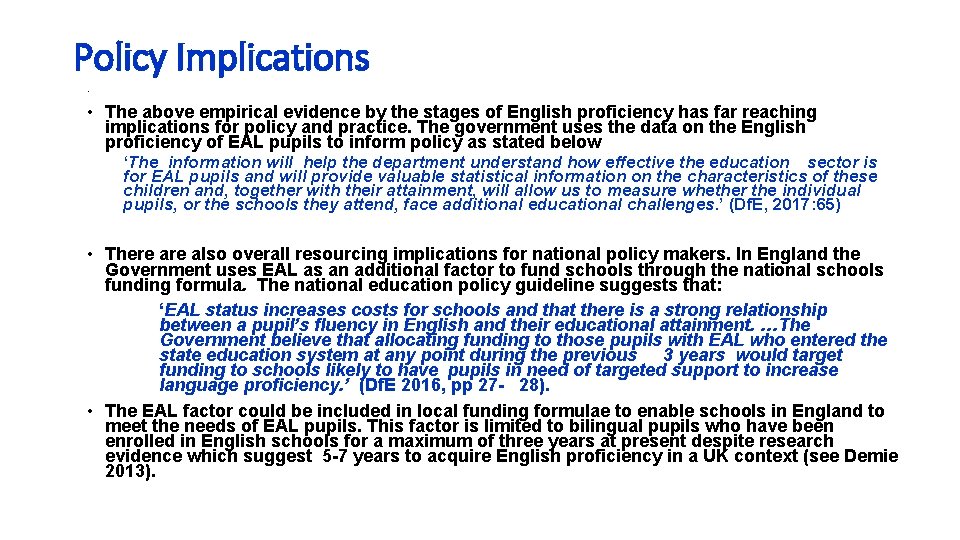
Policy Implications • • The above empirical evidence by the stages of English proficiency has far reaching implications for policy and practice. The government uses the data on the English proficiency of EAL pupils to inform policy as stated below ‘The information will help the department understand how effective the education sector is for EAL pupils and will provide valuable statistical information on the characteristics of these children and, together with their attainment, will allow us to measure whether the individual pupils, or the schools they attend, face additional educational challenges. ’ (Df. E, 2017: 65) • There also overall resourcing implications for national policy makers. In England the Government uses EAL as an additional factor to fund schools through the national schools funding formula. The national education policy guideline suggests that: ‘EAL status increases costs for schools and that there is a strong relationship between a pupil’s fluency in English and their educational attainment. …The Government believe that allocating funding to those pupils with EAL who entered the state education system at any point during the previous 3 years would target funding to schools likely to have pupils in need of targeted support to increase language proficiency. ’ (Df. E 2016, pp 27 - 28). • The EAL factor could be included in local funding formulae to enable schools in England to meet the needs of EAL pupils. This factor is limited to bilingual pupils who have been enrolled in English schools for a maximum of three years at present despite research evidence which suggest 5 -7 years to acquire English proficiency in a UK context (see Demie 2013).