Assessing and Comparing the Accuracy of Various Bootstrap

Assessing and Comparing the Accuracy of Various Bootstrap Methods Angela Zhu Mentor: Dr. John Kolassa

Bootstrapping • A method for estimating the sampling distribution of a statistic. • Often considered a resampling procedure that employs numerical approximations. • Various techniques for computing confidence intervals using only the information contained in data sets.

Project Description • Evaluate performance of various bootstrap methods for constructing confidence intervals for mean and median of common distributions o Coverage Percentage o Average Confidence Interval Length • Bootstrap Hazard Ratio • Accelerated Failure Time Model
 o")
Distributions Considered • Symmetrical Distribution • Non-symmetrical Distribution o Standard Normal N(0, 1) o Standard Uniform U(0, 1) o Standard Cauchy (location 0 and scale 1) o Laplace with location 0 and scale 1 o Gamma Distribution § § Shape=1, scale=2 Shape=4, scale=1

Methods • • • Sample sizes of 10, 20, 50 o Randomly generated using R o o o First order normal approximation Basic bootstrap Studentized bootstrap (using both variance and IQR 2) Bootstrap percentile Adjusted bootstrap percentile (BCA) Generate 5 types of bootstrap confidence intervals t-test method 999 bootstrap replicates of sample mean or median Monte Carlo simulation of 10, 000 bootstrap confidence intervals

Measurements •

Results
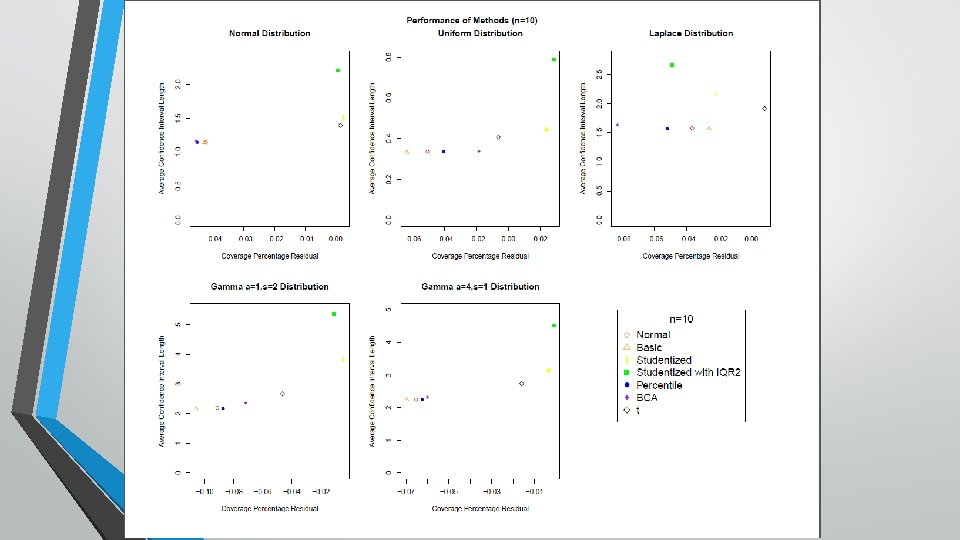
 Coverage for Means (n=10) 0. 0500 0. 0000 Normal Uniform")
Coverage for Mean (n=10) Coverage for Means (n=10) 0. 0500 0. 0000 Normal Uniform Cauchy Laplace Gamma a=1, s=2 Gamma a=4, s=1 Studentized with IQR 2 Percentile n Normal Basic BCA t 10 10 0. 9077 0. 8995 0. 9452 0. 9134 0. 9072 0. 8867 0. 9588 0. 9239 0. 9525 0. 9739 0. 9215 0. 9279 0. 9508 0. 9784 0. 8076 0. 9010 0. 9048 0. 9096 0. 8760 0. 8979 0. 9045 0. 9316 0. 7847 0. 8672 0. 9515 0. 9437 0. 9779 0. 9582 10 0. 8586 0. 8441 0. 9455 0. 9390 0. 8625 0. 8782 0. 9036 10 0. 8847 0. 8804 0. 9465 0. 9491 0. 8876 0. 8900 0. 9340 n Normal Basic BCA t 10 10 -0. 0423 -0. 0505 -0. 0048 -0. 0366 -0. 0428 -0. 0633 0. 0088 -0. 0261 0. 0025 0. 0239 -0. 0285 -0. 0221 0. 0008 0. 0284 -0. 1424 -0. 0490 -0. 0452 -0. 0404 -0. 074 -0. 0521 -0. 0455 -0. 0184 -0. 1653 -0. 0828 0. 0015 -0. 0063 0. 0279 0. 0082 10 -0. 0914 -0. 1059 -0. 0045 -0. 0110 -0. 0875 -0. 0718 -0. 0464 10 -0. 0653 -0. 0696 -0. 0035 -0. 0009 -0. 0624 -0. 0600 -0. 0160 -0. 0500 -0. 1000 Normal Uniform Cauchy Laplace Gamma a=1, s=2 Gamma a=4, s=1 -0. 1500 -0. 2000 Normal Basic Studentized with IQR 2 Percentile BCA t Studentized with IQR 2 Percentile
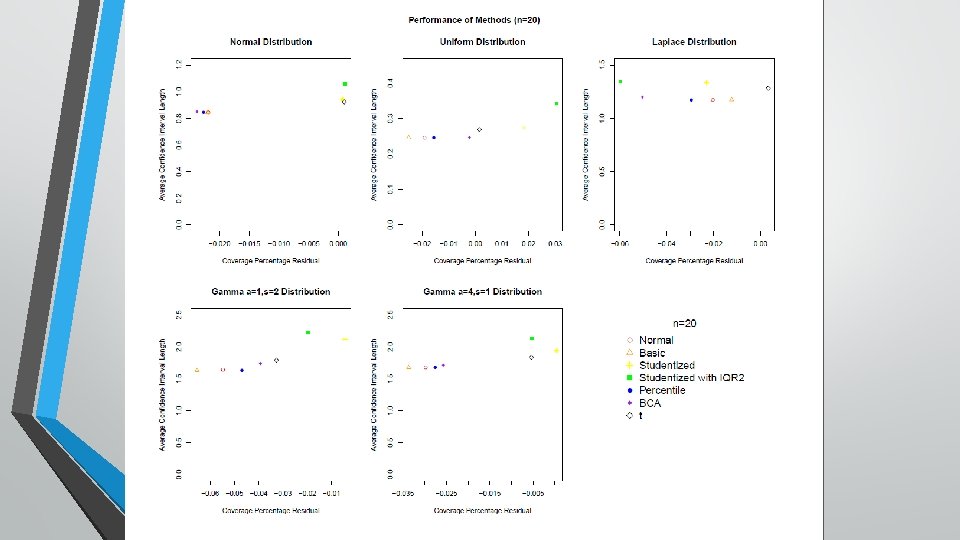
 Coverage for Means (n=20) 0. 0500 0. 0000 Normal Uniform")
Coverage for Mean (n=20) Coverage for Means (n=20) 0. 0500 0. 0000 Normal Uniform Cauchy Laplace Gamma a=1, s=2 Gamma a=4, s=1 -0. 0500 Normal Uniform Cauchy Laplace Gamma a=1, s=2 Gamma a=4, s=1 -0. 1000 Normal Uniform Cauchy Laplace Gamma a=1, s=2 Gamma a=4, s=1 -0. 1500 -0. 2000 Normal Basic Studentized with IQR 2 Percentile BCA t Studentized with IQR 2 Percentile n Normal Basic BCA t 20 20 0. 9281 0. 9309 0. 9634 0. 9297 0. 9280 0. 9250 0. 9760 0. 9377 0. 9507 0. 9683 0. 9016 0. 9270 0. 9511 0. 9805 0. 8548 0. 8903 0. 9273 0. 9344 0. 8975 0. 9205 0. 9262 0. 9478 0. 7858 0. 8997 0. 9510 0. 9515 0. 9788 0. 9533 20 0. 8953 0. 8846 0. 9455 0. 9303 0. 9031 0. 9107 0. 9173 20 0. 9202 0. 9163 0. 9504 0. 9447 0. 9224 0. 9243 0. 9446 n Normal Basic BCA t 20 20 -0. 0219 -0. 0191 0. 0134 -0. 0203 -0. 0220 -0. 0250 0. 0260 -0. 0123 0. 0007 0. 0183 -0. 0484 -0. 0230 0. 0011 0. 0305 -0. 0952 -0. 0597 -0. 0227 -0. 0156 -0. 0525 -0. 0295 -0. 0238 -0. 0022 -0. 1642 -0. 0503 0. 0010 0. 0015 0. 0288 0. 0033 20 -0. 0547 -0. 0654 -0. 0045 -0. 0197 -0. 0469 -0. 0393 -0. 0327 20 -0. 0298 -0. 0337 0. 0004 -0. 0053 -0. 0276 -0. 0257 -0. 0054 Studentized with IQR 2 Percentile
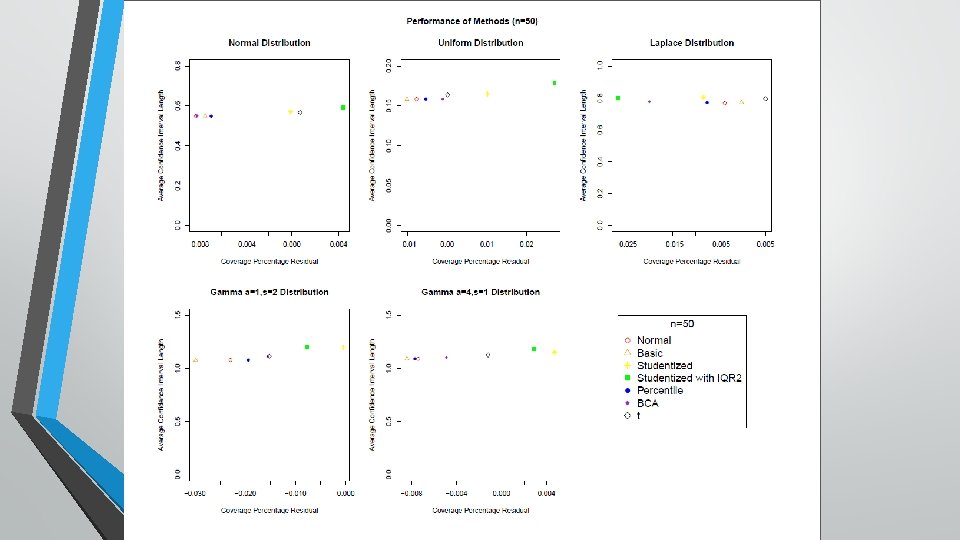
 Coverage for Means (n=50) 0. 0500 0. 0000 Normal Uniform")
Coverage for Mean (n=50) Coverage for Means (n=50) 0. 0500 0. 0000 Normal Uniform Cauchy Laplace Gamma a=1, s=2 Gamma a=4, s=1 Studentized with IQR 2 Percentile n Normal Basic BCA t 50 50 0. 9418 0. 9423 0. 9729 0. 9462 0. 9426 0. 9399 0. 9853 0. 9498 0. 9499 0. 9602 0. 8930 0. 9416 0. 9544 0. 9770 0. 9515 0. 9233 0. 9431 0. 9446 0. 9076 0. 9424 0. 9419 0. 9489 0. 7899 0. 9300 0. 9507 0. 9501 0. 9793 0. 9550 50 0. 9271 0. 9202 0. 9495 0. 9423 0. 9306 0. 9345 0. 9348 50 0. 9426 0. 9416 0. 9547 0. 9529 0. 9423 0. 9451 0. 9488 n Normal Basic BCA t 50 50 -0. 0082 -0. 0077 0. 0229 -0. 0038 -0. 0074 -0. 0101 0. 0353 -0. 0002 -0. 0001 0. 0102 -0. 0570 -0. 0084 0. 0044 0. 0270 0. 0015 -0. 0267 -0. 0069 -0. 0054 -0. 0424 -0. 0076 -0. 0081 -0. 0011 -0. 1601 -0. 0200 0. 0007 0. 0001 0. 0293 0. 0050 50 -0. 0229 -0. 0298 -0. 0005 -0. 0077 -0. 0194 -0. 0155 -0. 0152 50 -0. 0074 -0. 0084 0. 0047 0. 0029 -0. 0077 -0. 0049 -0. 0012 -0. 0500 Normal Uniform Cauchy Laplace Gamma a=1, s=2 Gamma a=4, s=1 -0. 1000 -0. 1500 -0. 2000 Normal Basic Studentized with IQR 2 Percentile BCA t Studentized with IQR 2 Percentile
 6. 000 5. 000 4. 000 3. 000")
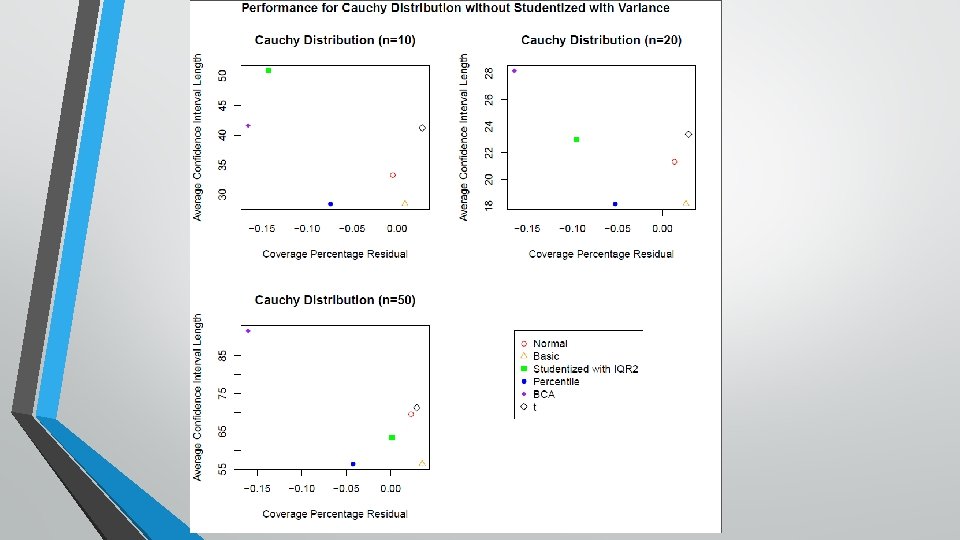
Average CI Length for Mean (n=10) 6. 000 5. 000 4. 000 3. 000 2. 000 1. 000 0. 000 Normal Uniform Normal CI Length Normal Uniform Cauchy Laplace Gamma a=1, s=2 Gamma a=4, s=1 n 10 10 10 Basic CI Length Normal CI Length 1. 145 0. 334 33. 342 1. 573 2. 190 2. 247 Laplace Studentized CI Length Basic CI Length 1. 144 0. 334 28. 431 1. 568 2. 164 2. 239 Studentized with IQR 2 CI Length Studentized CI Length 1. 505 0. 444 180321. 919 2. 155 3. 819 3. 143 Gamma a=1, s=2 Percentile CI Length Gamma a=4, s=1 BCA CI Length Studentized with IQR 2 CI Length Percentile CI Length 2. 205 1. 144 0. 789 0. 334 50. 848 28. 431 2. 665 1. 568 5. 361 2. 164 4. 518 2. 239 t CI Length BCA CI Length 1. 164 0. 337 41. 633 1. 635 2. 358 2. 321 t CI Length 1. 393 0. 407 41. 239 1. 915 2. 666 2. 734
 3. 000 2. 500 2. 000 1. 500")
Average CI Length for Mean (n=20) 3. 000 2. 500 2. 000 1. 500 1. 000 0. 500 0. 000 Normal CI Length Normal Uniform Cauchy Laplace Gamma a=1, s=2 Gamma a=4, s=1 n 20 20 20 Uniform Basic CI Length Normal CI Length 0. 842 0. 245 21. 344 1. 171 1. 635 1. 675 Laplace Studentized CI Length Basic CI Length 0. 844 0. 245 18. 154 1. 174 1. 630 1. 676 Studentized with IQR 2 CI Length Studentized CI Length 0. 941 0. 274 6378. 682 1. 338 2. 123 1. 940 Gamma a=1, s=2 Percentile CI Length Gamma a=4, s=1 BCA CI Length Studentized with IQR 2 CI Length Percentile CI Length 1. 056 0. 844 0. 342 0. 245 23. 007 18. 154 1. 347 1. 174 2. 223 1. 630 2. 131 1. 676 t CI Length BCA CI Length 0. 849 0. 246 28. 177 1. 199 1. 738 1. 714 t CI Length 0. 923 0. 268 23. 393 1. 283 1. 791 1. 836
 1. 400 1. 200 1. 000 0. 800")
Average CI Length for Mean (n=50) 1. 400 1. 200 1. 000 0. 800 0. 600 0. 400 0. 200 0. 000 Normal Uniform Normal CI Length Normal Uniform Cauchy Laplace Gamma a=1, s=2 Gamma a=4, s=1 n 20 20 20 Basic CI Length Normal CI Length 0. 547 0. 158 69. 494 0. 768 1. 076 1. 087 Laplace Studentized CI Length Basic CI Length 0. 549 0. 158 56. 402 0. 771 1. 077 1. 090 Studentized with IQR 2 CI Length Studentized CI Length 0. 570 0. 165 1638797. 518 0. 805 1. 195 1. 152 Gamma a=1, s=2 Percentile CI Length Gamma a=4, s=1 BCA CI Length Studentized with IQR 2 Percentile CI Length 0. 592 0. 549 0. 178 0. 158 63. 445 56. 402 0. 800 0. 771 1. 201 1. 077 1. 183 1. 090 t CI Length BCA CI Length 0. 550 0. 159 91. 588 0. 776 1. 114 1. 101 t CI Length 0. 567 0. 164 71. 262 0. 795 1. 115 1. 126

Acknowledgements • I would like to thank Dr. Kolassa for giving me this amazing opportunity to learn and engage in statistics research and for his guidance throughout the entire process. • I would also like to thank NSF for funding my project.
- Slides: 18