Aspinall Unit Reservoir Operations 2015 Operational Considerations Aspinall


 1600 1500")
 1 600")


- Slides: 14
Aspinall Unit Reservoir Operations 2015
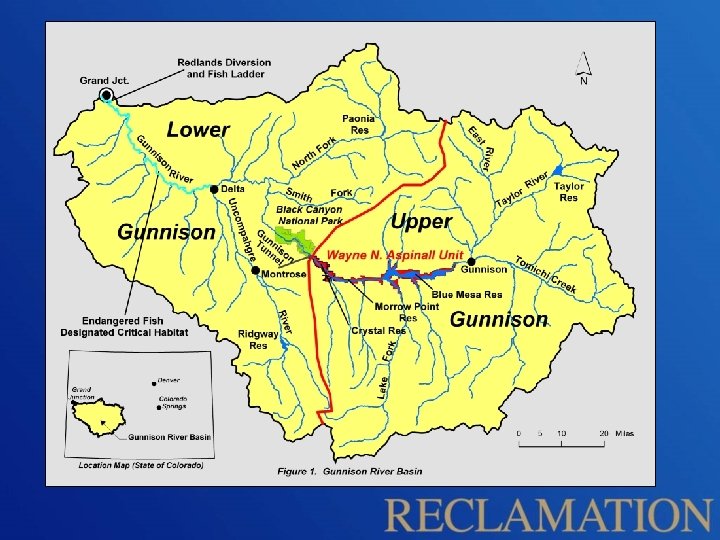
Operational Considerations • Aspinall Unit Purposes – Water storage / Compact Development – Power Production – Flood Control • Downstream Flow Requirements - including Senior Water Rights, timing side-inflows • Target Elevations • Meeting the ROD flow targets at Whitewater • Others - Including Recreation and Safety
Aspinall Unit Forecasted Unregulated Inflow Apr - July Forecasted Inflow (1000 ac-ft) 1600 1500 1400 Bar labels are forecast in 1000 ac-ft Lines indicate 1981 -2010 average 1300 1200 1100 1000 900 800 700 840 690 830 820 755 730 560 600 725 680 620 775 600 590 480 500 595 580 540 515 450 440 Apr 15 th May 1 st 700 710 821 708 650 570 520 400 300 200 100 0 Jan 1 st Feb 15 th Mar 1 st Mar 15 th Apr 1 st May 15 th Jun 1 st Jun 15 th Forecast Date Blue Mesa Inflow Crystal Inflow Jul 1 st Jul 15 th Actual
Blue Mesa Reservoir, Colorado Historic April-July Unregulated Inflow Volume Ranking (1969 -2015) 1 600 000 Wet < 10% 1 400 000 2015 Final Runoff Volume (708, 000 Acre-Feet, 52% exceedance) 1 200 000 Moderately Wet 10 -30% 1 000 Average Wet 30 -50% 800 000 Average Dry 50 -70% 600 000 Moderately Dry 70400 000 Dry >90% 200 0 20 0 19 2 7 20 7 1 19 2 8 20 1 13 19 9 19 0 8 20 8 0 20 4 0 19 3 8 19 9 9 19 2 7 19 6 7 20 2 1 20 0 07 20 0 0 19 1 9 20 4 0 19 6 7 19 4 9 20 8 0 19 5 91 19 9 7 20 1 1 19 5 6 19 9 82 20 0 19 9 73 19 8 19 7 7 19 8 96 20 1 19 4 75 19 8 20 3 1 19 1 7 19 9 70 19 8 19 0 9 20 3 0 19 8 8 19 6 8 19 5 9 19 7 9 19 5 84 Volume (Arce-Feet) 2015 May 1 st Forecasted Runoff Volume (440, 000 Acre-Feet, 83% exceedance) Runoff Year
73% of seasonal peak
Upper Gunnison Peak Snowpack vs. Blue Mesa Reservoir Inflow 1400 1300 April-July Inflow (1000 AF) 1200 1100 1000 900 800 2015 700 600 500 400 300 200 100 0 50% R 2 = 0, 8629 60% 70% 80% 90% 100% 110% 120% Peak Snow Accumulation - % of Average 130% 140% 150%
May 1 Forecast 440 KAF 2054 cfs May 9 - 24 Hr Peak 2120 cfs June 23 - 24 Hr Peak 7180 cfs
Peak Flow and Duration Day Targets at Whitewater 16000 14000 WET MOD WET 12000 10600 cfs June 20 Peak Q (cfs) 10000 AVG WET AVG DRY 8000 6000 5, 300 cfs May 7 4991 cfs 4000 Apr-July Forecast Half bank Duration Peak Flow Duration (1000 AF) (days @ 8, 070 cfs) (days @ up to 14, 350 cfs) <381 0 0 381 -516 0 0 516 -709 10 0 709 -831 20 2 MOD DRY 2000 DRY 0 200 300 400 500 600 700 800 900 1000 Forecast BM Apr-Jul Inflow (thousand af) 1100 1200 1300 1400 1500
2015 Baseflow Targets
2015 Spring Operational Goals • Black Canyon Water Right • One Day Peak Target 2, 054 cfs • ROD Peak Flow at Whitewater • 4991 cfs (Instantaneous) • <14, 000 cfs at Delta, CO • Safe Ramping Rates • Fill Blue Mesa
Gunnison River 2015 Flows 11000 BC peak = 7180 WW peak = 10600 Days > 14350 = 0 Days > 8070 = 10 10000 9000 Whitewater flow was meet starting on May 7 th 8000 Black Canyon Water Right was meet starting on May 9 th Flow (cfs) 7000 6000 5000 4000 3000 2000 1000 0 5. 1 5. 6 5. 11 5. 16 5. 21 5. 26 Black Canyon 5. 31 Delta 6. 5 6. 10 Whitewater 6. 15 6. 20 6. 25 North Fork 6. 30 7. 5 7. 10 7. 15
Blue Mesa Reservoir 10 000 7520, 00 Forecasted Inflow 9 500 9 000 7512, 00 Comparative Year Inflow 8 500 7508, 00 Ave Unreg Inflow 8 000 Projected Crystal Release 7504, 00 7 500 Actual Crystal Release 7500, 00 7 000 Projected Elevation 7496, 00 Actual Elevation 6 500 7492, 00 Average Elevation 7488, 00 Elevation (Feet) 6 000 7464, 00 2 500 7460, 00 2 000 7456, 00 1 500 7452, 00 1 000 7448, 00 500 7444, 00 0 7440, 00 Date дек-2015 3 000 ноя-2015 7468, 00 окт-2015 3 500 сен-2015 7472, 00 авг-2015 4 000 июл-2015 7476, 00 июн-2015 4 500 май-2015 7480, 00 апр-2015 5 000 мар-2015 7484, 00 фев-2015 5 500 янв-2015 Inflow (cfs) 7516, 00 Actual Inflow Chart is valid as of 8 -Dec-2015
Blue Mesa Water Surface Elevations Historical October 2014 through November 18, 2015 (Projections to Aug 2016) 7520 June 30, 2016 - 88% of Capacity June 20, 2015 - 100% of Capacity 7500 7490 7480 7470 7460 7450 Month-Year Historic Elevation Most Probable Projected Minimum Probable Projected Maximum Probable Projected авг-16 июн-16 апр-16 фев-16 дек-15 окт-15 авг-15 июн-15 апр-15 фев-15 дек-14 7440 окт-14 Elevation (feet above sea level) 7510