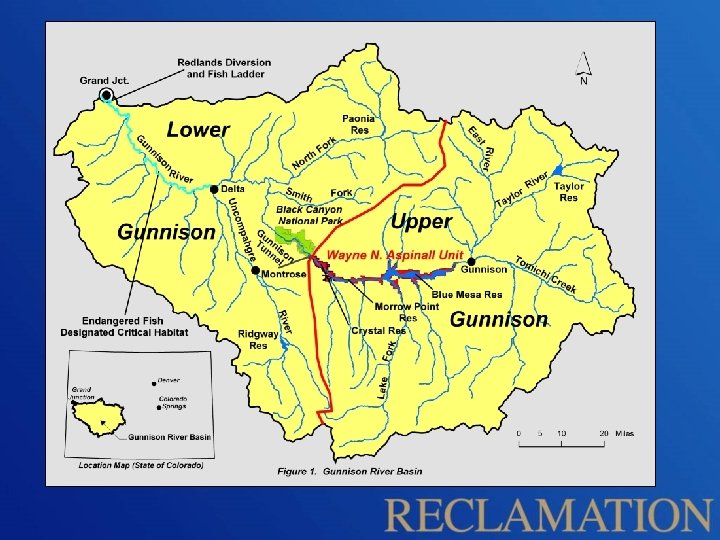
Aspinall Unit Reservoir Operations 2014 Operational Considerations Aspinall


 1, 600,")


- Slides: 12
Aspinall Unit Reservoir Operations 2014
Operational Considerations • Aspinall Unit Purposes – Water storage / Compact Development – Power Production – Flood Control • Downstream Flow Requirements - including Senior Water Rights, timing side-inflows • Target Elevations • Meeting the ROD flow targets at Whitewater • Others - Including Recreation and Safety
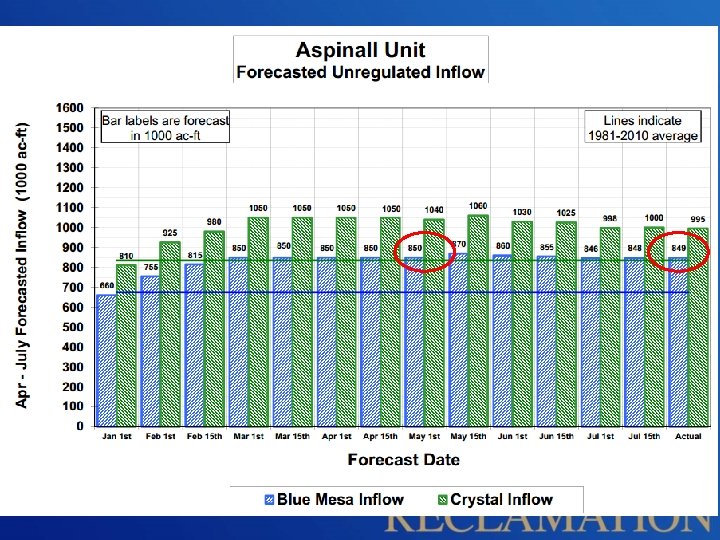
Blue Mesa Reservoir, Colorado Historic April-July Unregulated Inflow Volume Ranking (1969 -2014) 1, 600, 000 Wet < 10% 1, 400, 000 2014 Final Runoff Volume (849, 000 Acre-Feet, 28% exceedance) 1, 200, 000 Moderately Wet 10 -30% Average Wet 30 -50% 800, 000 Average Dry 50 -70% 600, 000 Moderately Dry 70 -90% 400, 000 Dry >90% 200, 000 0 20 0 19 2 7 20 7 1 19 2 8 20 1 1 19 3 9 19 0 8 20 8 04 20 0 19 3 8 19 9 9 19 2 7 19 6 7 20 2 10 20 7 0 20 0 0 19 1 9 20 4 0 19 6 7 19 4 9 20 8 0 19 5 9 19 1 9 19 9 7 19 1 69 19 8 20 2 0 19 9 7 19 3 8 19 7 7 19 8 9 19 6 0 19 5 7 19 5 8 20 3 1 19 1 7 19 9 7 19 0 8 19 0 9 20 3 0 19 8 8 19 6 8 19 5 9 19 7 95 19 84 Volume (Arce-Feet) 1, 000
*Drought Recovery Provision 1. Ave Dry/Mod Dry/Dry year following a Dry Year 2. Blue Mesa content < 550 kaf on Dec 31
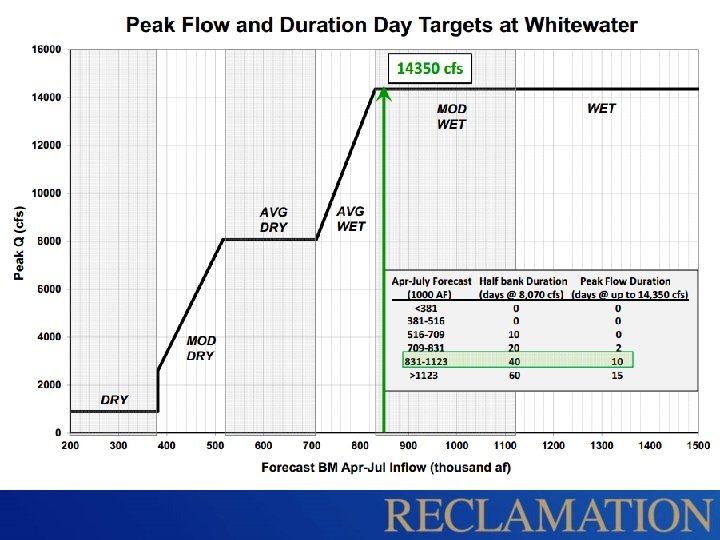
Whitewater Baseflow Targets Drought Rules Ø During Dry and Moderately Dry years, if Blue Mesa Reservoir content drops below 600, 000 af, the Whitewater baseflow target is reduced from 1050 cfs to 900 cfs until Blue Mesa Reservoir content exceeds 600, 000 af
2013 Spring Operational Goals • Black Canyon Water Right • One Day Peak Target 685 cfs • ROD Peak Flow at Whitewater • 900 cfs (1 days) • <14, 000 cfs at Delta, CO • Safe Ramping Rates • Fill Blue Mesa
Black Canyon Water Right was meet starting on June 3 rd
Blue Mesa Reservoir Projections based on 850000 Acre-Feet of April-July runoff, using analog year 1997 12, 000 11, 500 11, 000 10, 500 10, 000 9, 500 9, 000 8, 500 8, 000 7, 500 7, 000 6, 500 6, 000 5, 500 5, 000 4, 500 4, 000 3, 500 3, 000 2, 500 2, 000 1, 500 1, 000 500 0 7520. 00 Forecasted Inflow 7516. 00 Actual Inflow 7512. 00 Comparative Year Inflow 7508. 00 Ave Unreg Inflow Projected Crystal Release 7504. 00 Actual Crystal Release 7500. 00 Projected Elevation 7496. 00 Actual Elevation 7492. 00 Average Elevation Inflow (cfs) Elevation (Feet) 7488. 00 7484. 00 7480. 00 7476. 00 7472. 00 7468. 00 7464. 00 7460. 00 7456. 00 7452. 00 7448. 00 7444. 00 Date Dec-2014 Nov-2014 Oct-2014 Sep-2014 Aug-2014 Jul-2014 Jun-2014 May-2014 Apr-2014 Mar-2014 Feb-2014 Jan-2014 7440. 00 Chart is valid as of 19 -Nov-2014
Blue Mesa Water Surface Elevations Historical October 2012 through Aug 1, 2014 (Projections to Aug 2014) 7520 July 31, 2014 - 91% of Capacity 7500 7490 June 20, 2013 - 54% of Capacity 7480 7470 7460 7450 Month-Year Historic Elevation Most Probable Projected Minimum Probable Projected Maximum Probable Projected Aug-14 Jun-14 Apr-14 Feb-14 Dec-13 Oct-13 Aug-13 Jun-13 Apr-13 Feb-13 Dec-12 7440 Oct-12 Elevation (feet above sea level) 7510