
ASPERGILLUS BREAKPOINTS CLSI VORICONAZOLE David Andes MD University
ASPERGILLUS BREAKPOINTS: CLSI - VORICONAZOLE David Andes, MD University of Wisconsin
Outline – Factors Considered Preclinical infection model PK/PD Clinical TDM outcomes vs MIC distribution MIC and clinical failures Clinical PK/PD
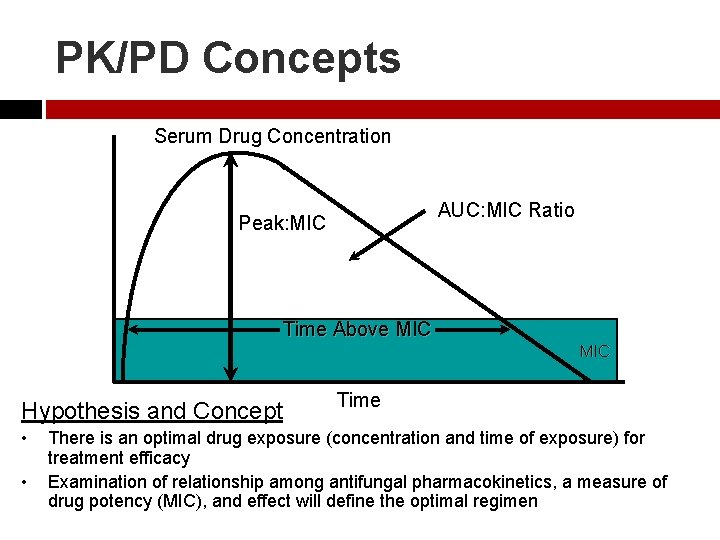
PK/PD Concepts Serum Drug Concentration AUC: MIC Ratio Peak: MIC Time Above MIC Hypothesis and Concept • • Time There is an optimal drug exposure (concentration and time of exposure) for treatment efficacy Examination of relationship among antifungal pharmacokinetics, a measure of drug potency (MIC), and effect will define the optimal regimen
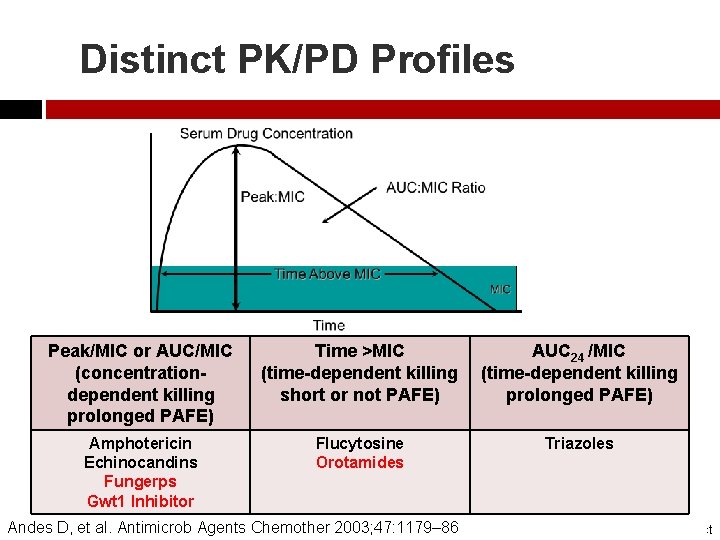
Distinct PK/PD Profiles Peak/MIC or AUC/MIC (concentrationdependent killing prolonged PAFE) Time >MIC (time-dependent killing short or not PAFE) AUC 24 /MIC (time-dependent killing prolonged PAFE) Amphotericin Echinocandins Fungerps Gwt 1 Inhibitor Flucytosine Orotamides Triazoles Andes D, et al. Antimicrob Agents Chemother 2003; 47: 1179– 86 PAFE – post antifungal effect
Preclinical PK/PD Data
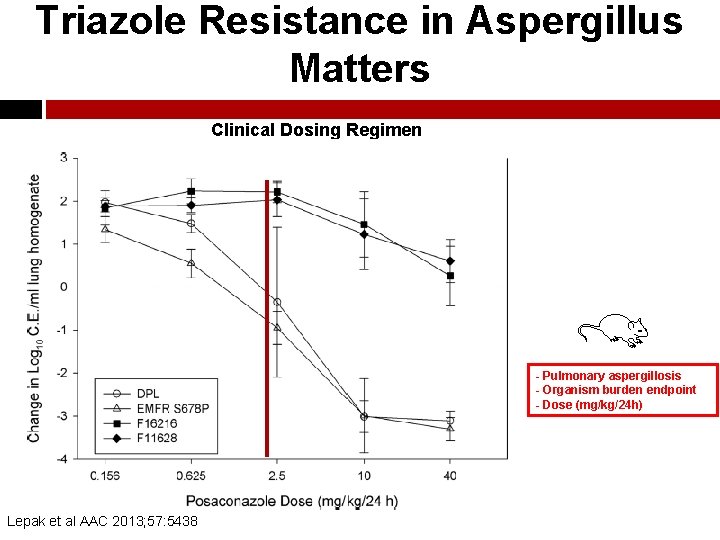
Triazole Resistance in Aspergillus Matters Clinical Dosing Regimen - Pulmonary aspergillosis - Organism burden endpoint - Dose (mg/kg/24 h) Lepak et al AAC 2013; 57: 5438
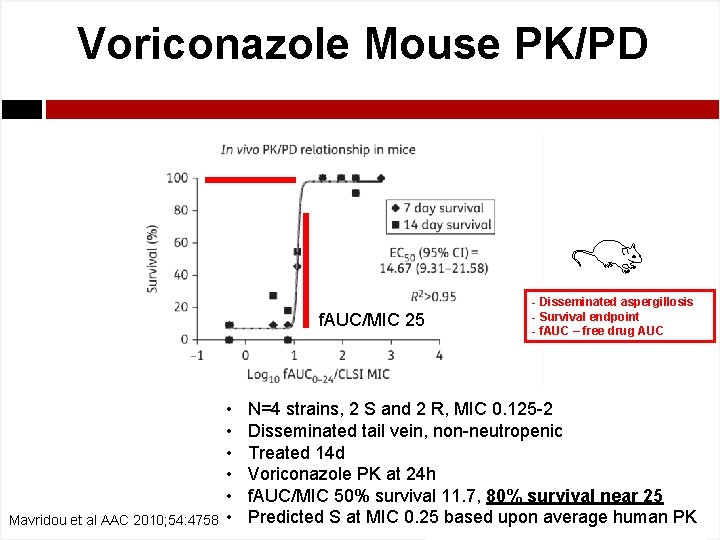
Voriconazole Mouse PK/PD f. AUC/MIC 25 Mavridou et al AAC 2010; 54: 4758 • • • - Disseminated aspergillosis - Survival endpoint - f. AUC – free drug AUC N=4 strains, 2 S and 2 R, MIC 0. 125 -2 Disseminated tail vein, non-neutropenic Treated 14 d Voriconazole PK at 24 h f. AUC/MIC 50% survival 11. 7, 80% survival near 25 Predicted S at MIC 0. 25 based upon average human PK

Voriconazole In vitro PK/PD MIC distribution Fraction MICs Fraction Patients Trough/MIC 1. 68 Target attainment • In vitro model (square MIC distribution/circle Monte. Carlo simulation) • N=4 strains, 2 S and 2 R, MIC 0. 125 -2 • Galactomannan suppression endpoint (< 1) • AUC/MIC 55 or Trough/MIC 1. 68 • Human PK and Monte Carlo simulation • S = 0. 5, R = 1. 0 Jeans et al JID 2012; 206: 442
Clinical TDM and MIC Distribution
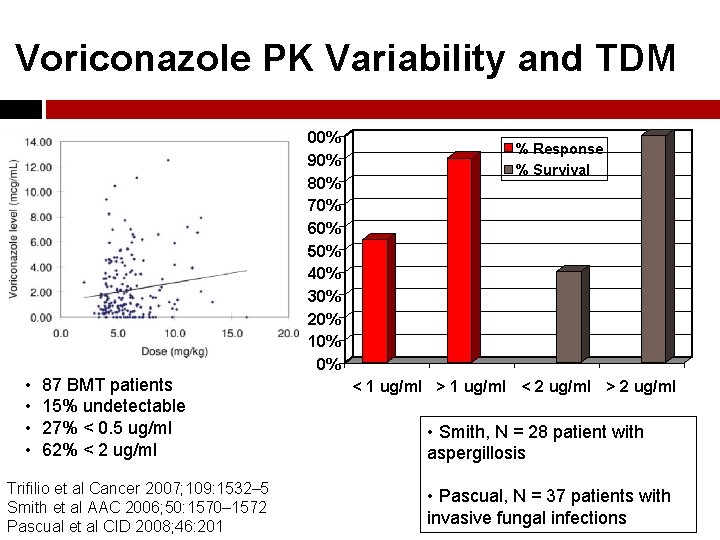
Voriconazole PK Variability and TDM 100% 90% 80% 70% 60% 50% 40% 30% 20% 10% 0% • • 87 BMT patients 15% undetectable 27% < 0. 5 ug/ml 62% < 2 ug/ml Trifilio et al Cancer 2007; 109: 1532– 5 Smith et al AAC 2006; 50: 1570– 1572 Pascual et al CID 2008; 46: 201 % Response % Survival < 1 ug/ml > 1 ug/ml < 2 ug/ml > 2 ug/ml • Smith, N = 28 patient with aspergillosis • Pascual, N = 37 patients with invasive fungal infections
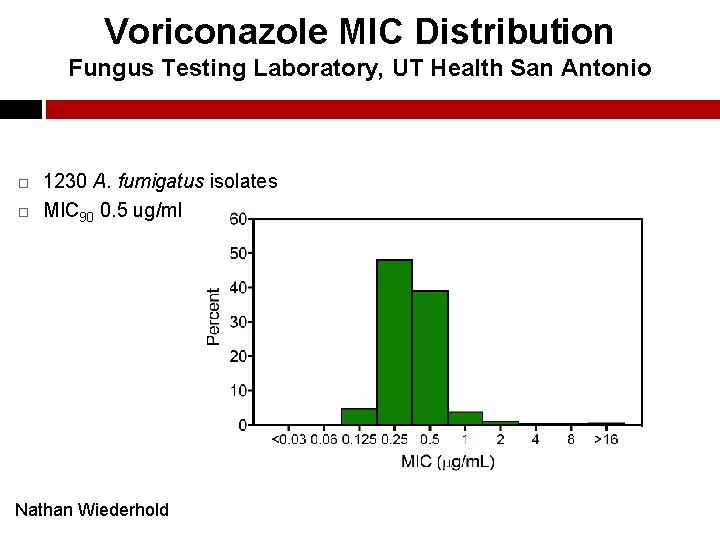
Voriconazole MIC Distribution Fungus Testing Laboratory, UT Health San Antonio 1230 A. fumigatus isolates MIC 90 0. 5 ug/ml Nathan Wiederhold
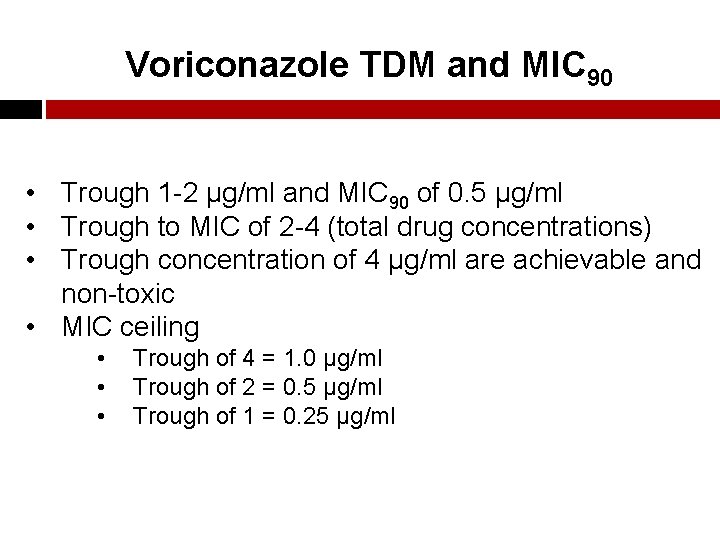
Voriconazole TDM and MIC 90 • Trough 1 -2 µg/ml and MIC 90 of 0. 5 µg/ml • Trough to MIC of 2 -4 (total drug concentrations) • Trough concentration of 4 µg/ml are achievable and non-toxic • MIC ceiling • • • Trough of 4 = 1. 0 µg/ml Trough of 2 = 0. 5 µg/ml Trough of 1 = 0. 25 µg/ml
MIC and Clinical Failures
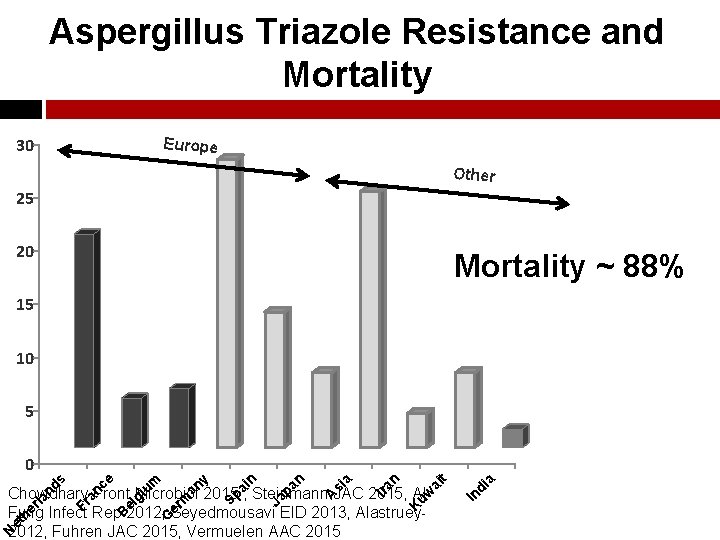
Aspergillus Triazole Resistance and Mortality 30 Europe Other 25 20 Mortality ~ 88% 15 10 5 a ai t Ira n a an ai n y um ce s 0 N di In uw K si A Ja p Sp an er m gi el Fr an B G et he rla nd Chowdhary Front Microbiol 2015 , Steinmann JAC 2015, Ahmad Envir Res 2014, Stendsvold Curr Fung Infect Rep 2012, Seyedmousavi EID 2013, Alastruey-Izquierdo AAC 2013, Tashiro AAC 2012, Fuhren JAC 2015, Vermuelen AAC 2015
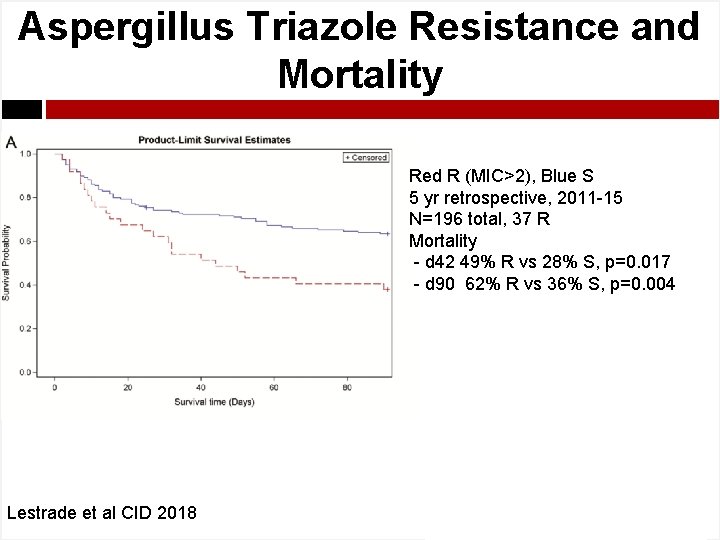
Aspergillus Triazole Resistance and Mortality Red R (MIC>2), Blue S 5 yr retrospective, 2011 -15 N=196 total, 37 R Mortality - d 42 49% R vs 28% S, p=0. 017 - d 90 62% R vs 36% S, p=0. 004 Lestrade et al CID 2018
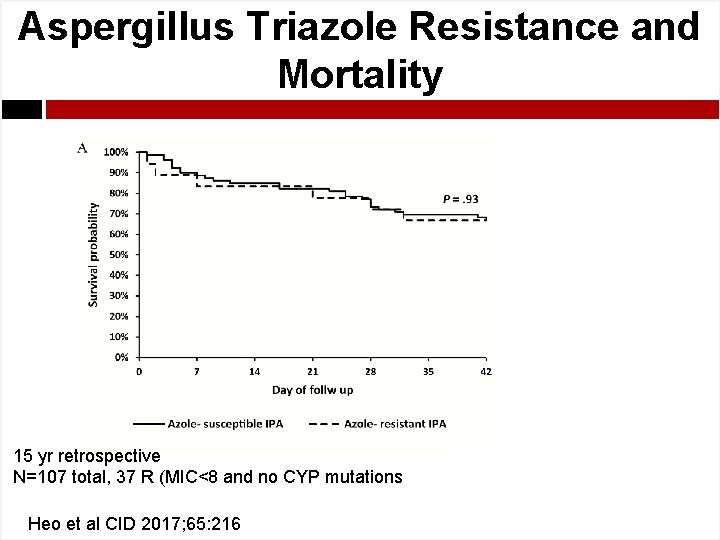
Aspergillus Triazole Resistance and Mortality 15 yr retrospective N=107 total, 37 R (MIC<8 and no CYP mutations Heo et al CID 2017; 65: 216
Clinical PK/PD Data
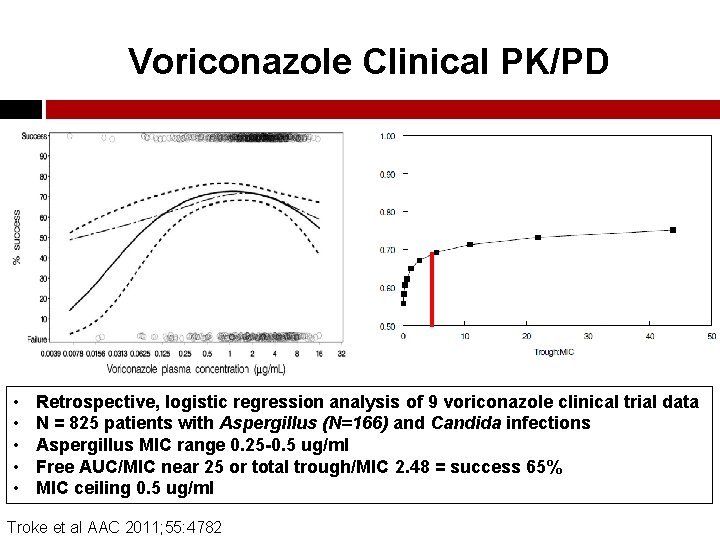
Voriconazole Clinical PK/PD • • • Retrospective, logistic regression analysis of 9 voriconazole clinical trial data N = 825 patients with Aspergillus (N=166) and Candida infections Aspergillus MIC range 0. 25 -0. 5 ug/ml Free AUC/MIC near 25 or total trough/MIC 2. 48 = success 65% MIC ceiling 0. 5 ug/ml Troke et al AAC 2011; 55: 4782
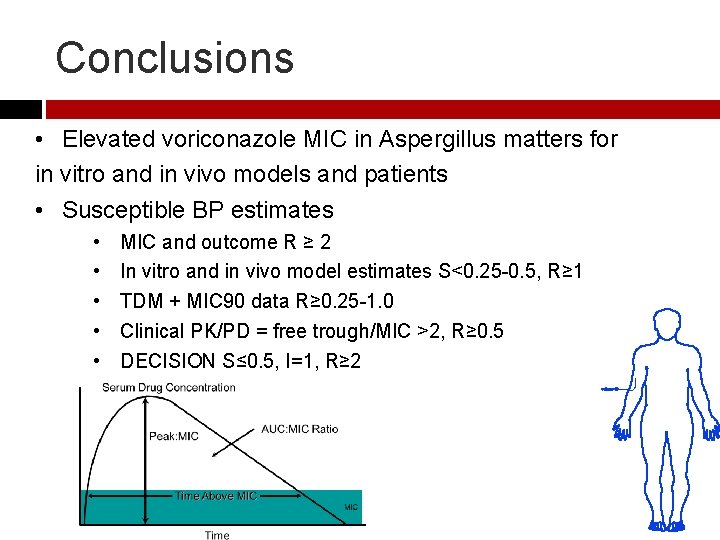
Conclusions • Elevated voriconazole MIC in Aspergillus matters for in vitro and in vivo models and patients • Susceptible BP estimates • • • MIC and outcome R ≥ 2 In vitro and in vivo model estimates S<0. 25 -0. 5, R≥ 1 TDM + MIC 90 data R≥ 0. 25 -1. 0 Clinical PK/PD = free trough/MIC >2, R≥ 0. 5 DECISION S≤ 0. 5, I=1, R≥ 2
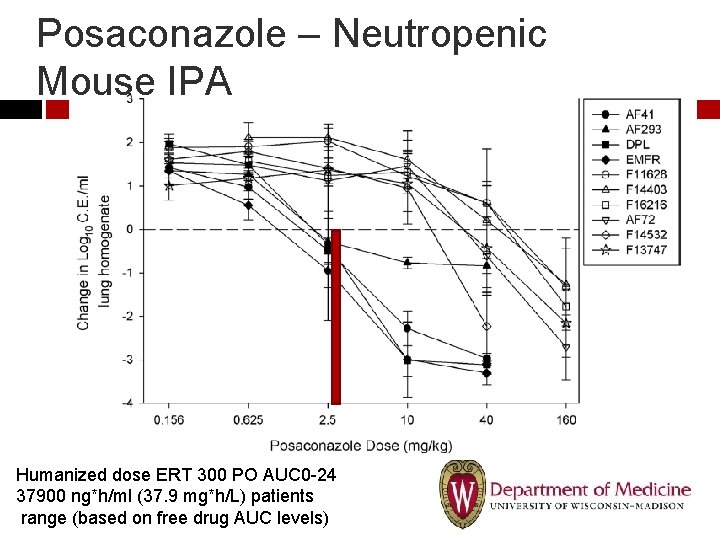
Posaconazole – Neutropenic Mouse IPA Humanized dose ERT 300 PO AUC 0 -24 37900 ng*h/ml (37. 9 mg*h/L) patients range (based on free drug AUC levels)
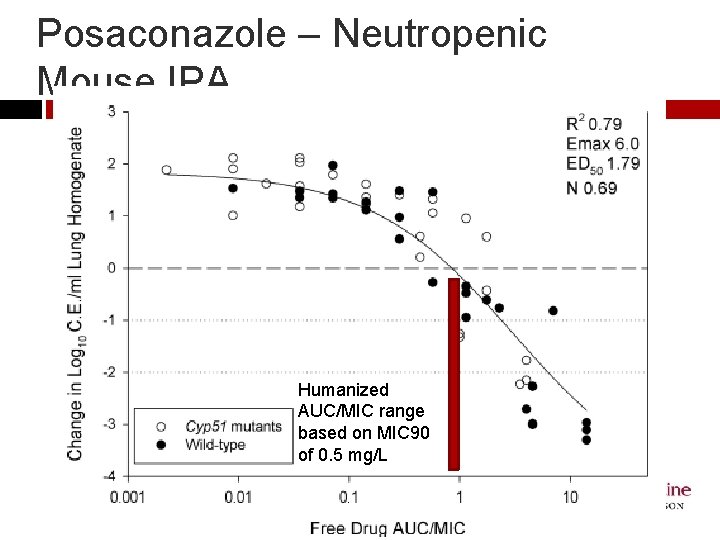
Posaconazole – Neutropenic Mouse IPA Humanized AUC/MIC range based on MIC 90 of 0. 5 mg/L
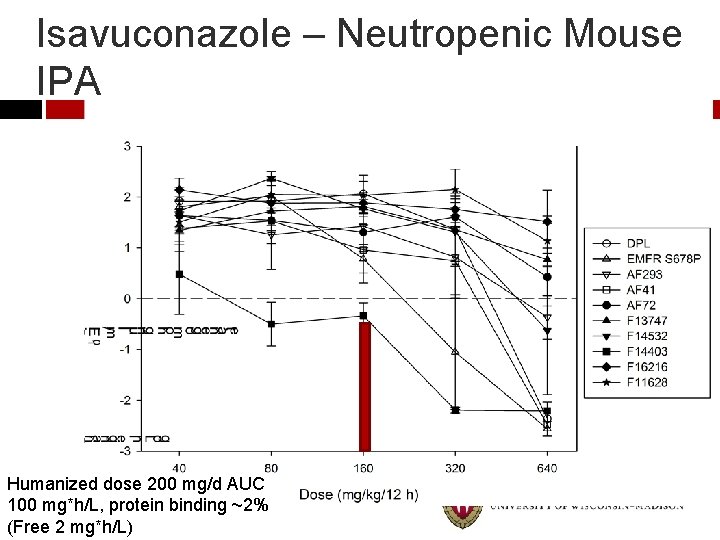
Isavuconazole – Neutropenic Mouse IPA Humanized dose 200 mg/d AUC 100 mg*h/L, protein binding ~2% (Free 2 mg*h/L)
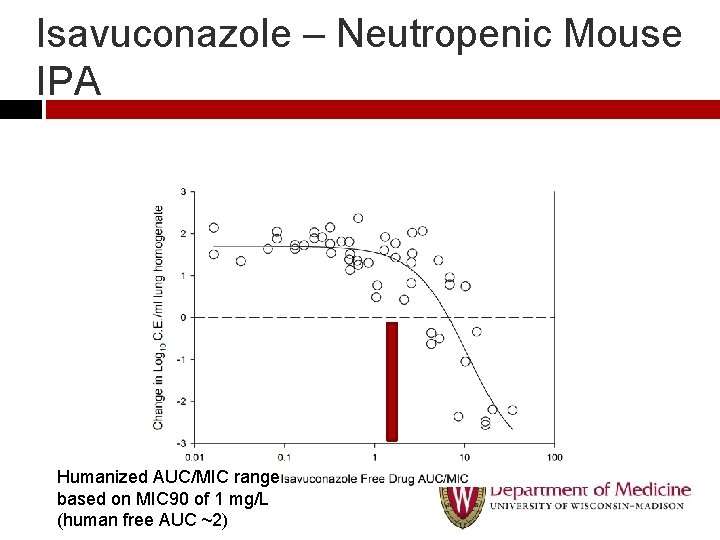
Isavuconazole – Neutropenic Mouse IPA Humanized AUC/MIC range based on MIC 90 of 1 mg/L (human free AUC ~2)
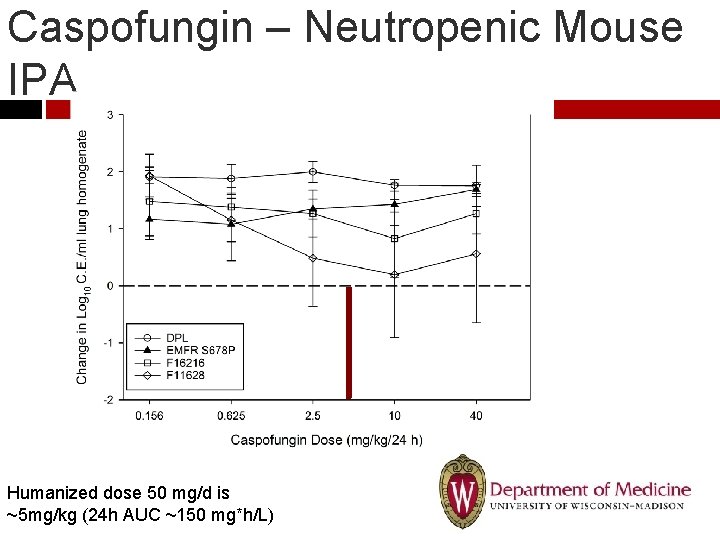
Caspofungin – Neutropenic Mouse IPA Humanized dose 50 mg/d is ~5 mg/kg (24 h AUC ~150 mg*h/L)
- Slides: 24