Artificial Intelligence AI Machine Learning vs algorithm support
 劉益宏")
 vs 演算法 (algorithm) 支持向量機 (support vector machine, SVM)、etc.")


 and salmon (鮭魚) classification")


 • 散佈圖 (Scatter plot)")
")


: 1.")
 petal length (PL) sepal width (SW)")


 74 劉益宏 人 智慧 Part")


- Slides: 81
人 智慧簡介 Artificial Intelligence (AI) 劉益宏
人 智慧簡介 • Machine Learning (機器學習) vs 演算法 (algorithm) 支持向量機 (support vector machine, SVM)、etc. • 神經網路 (neural network) 是人 智慧 ? • 深度學習 (deep learning) 是神經網路 ? 深度神經網路Deep Neural Network (DNN)、 卷積神經網路 (convolutional neural network, CNN),etc. • 人 智慧是一種概念。
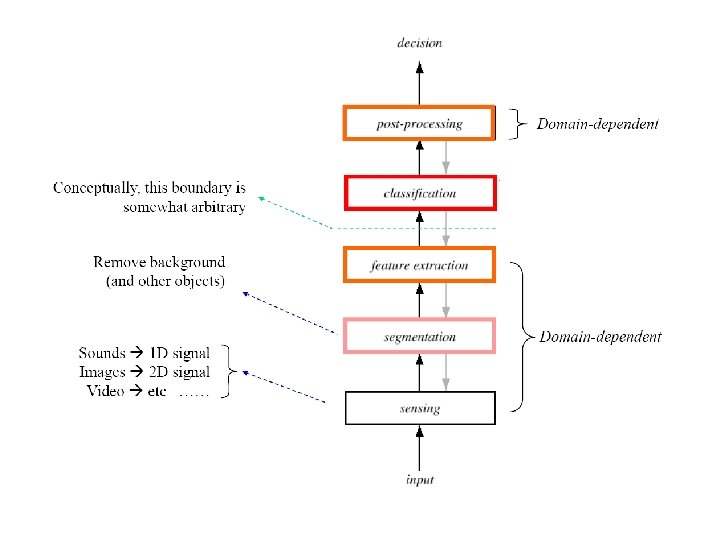
Flow Chart of Data and Information Processing Plant data processing Pattern recognition Real-time Diagnosis & Maintenance Process Feature Extraction Equipment Products Diagnosis Raw data Fault detection and Classification Maintenance
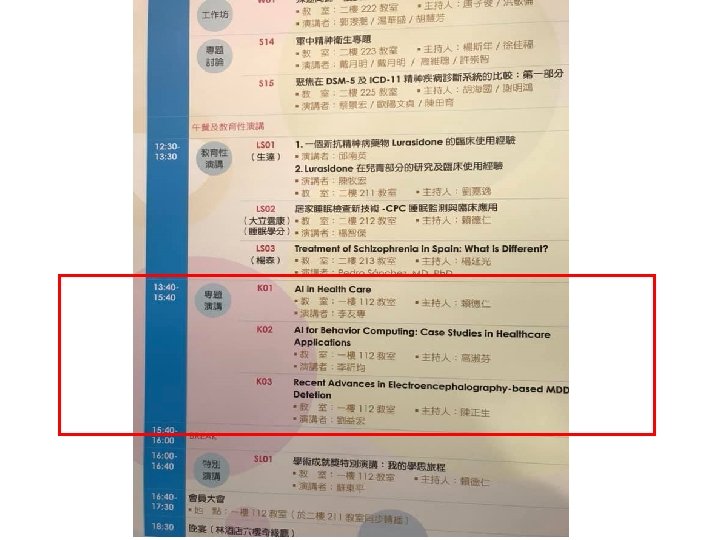
SC 18, Dallas, TX, USA.
With Lenovo CEO, 楊元慶
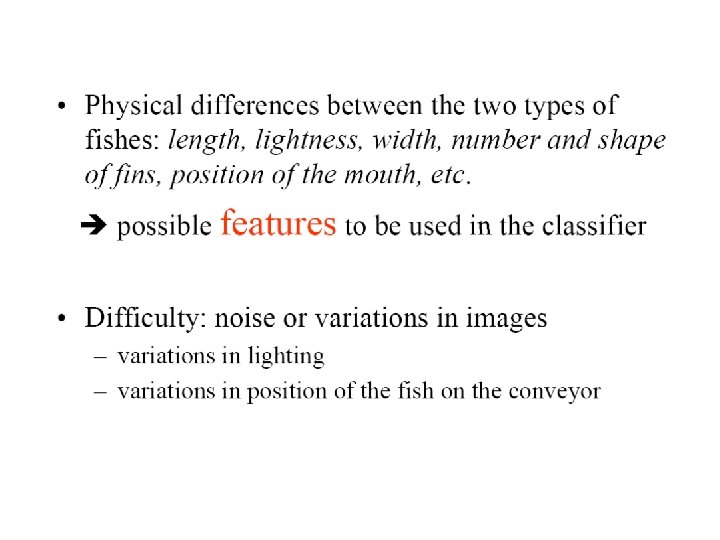
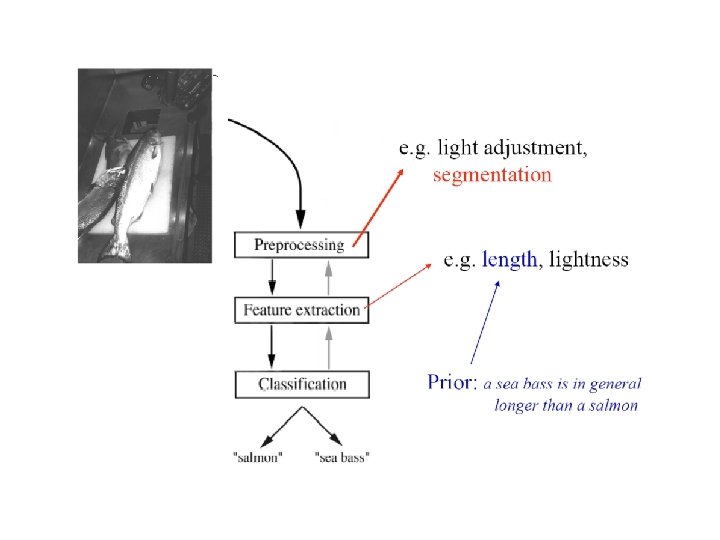
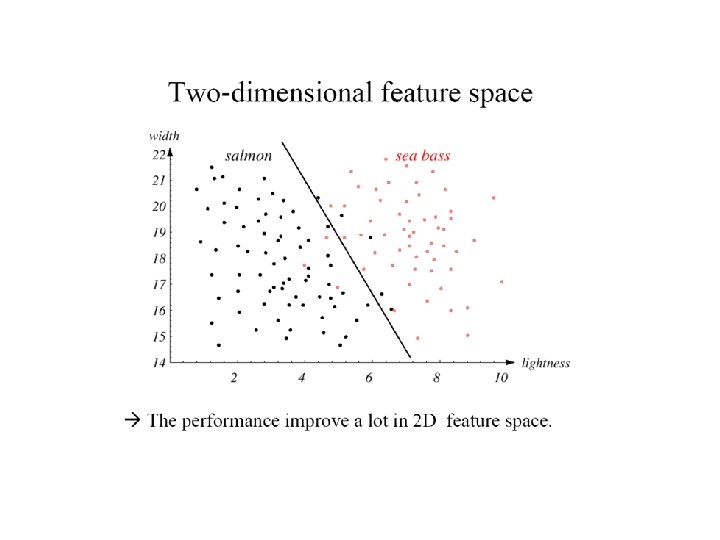
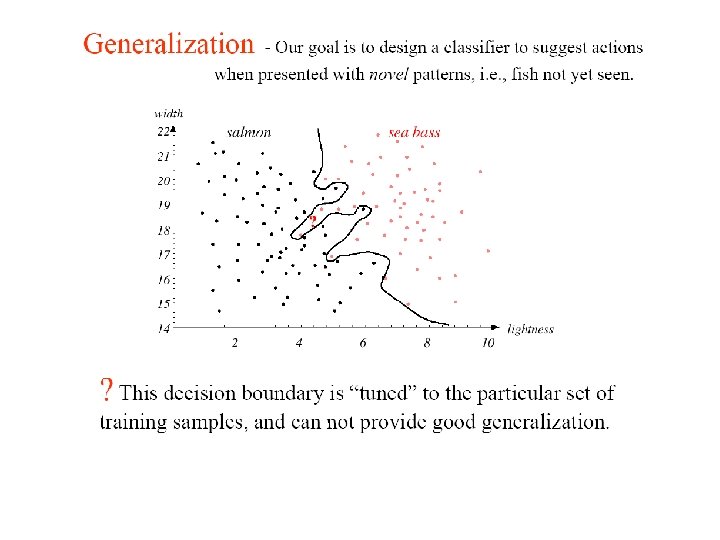
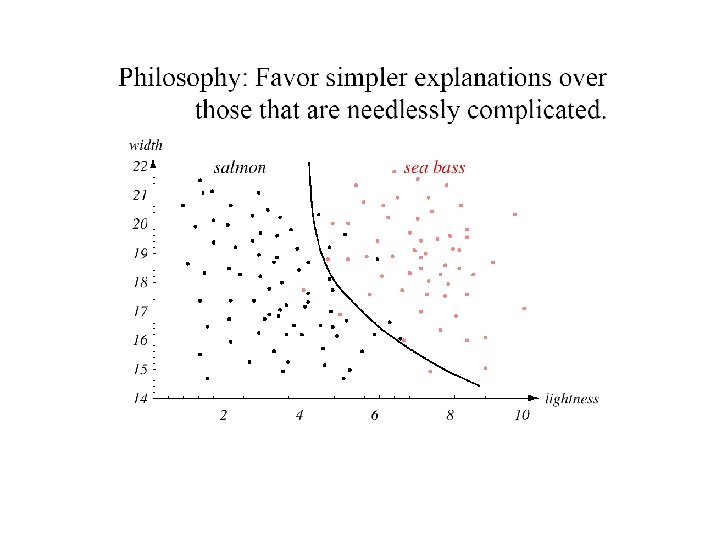
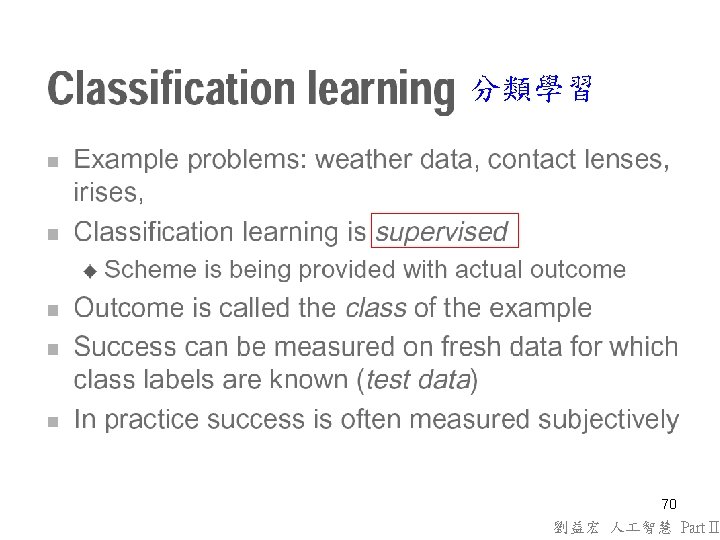
A two-classification problem: sea bass (鱸魚) and salmon (鮭魚) classification
Salmon Sea bass
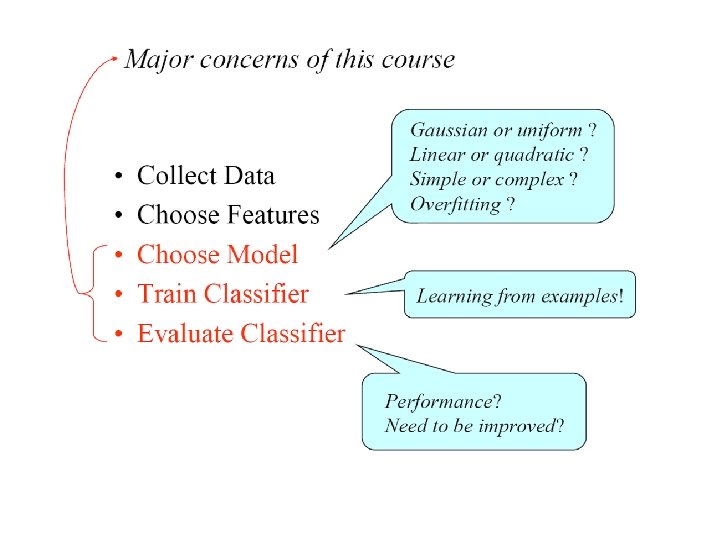
The Design Cycle
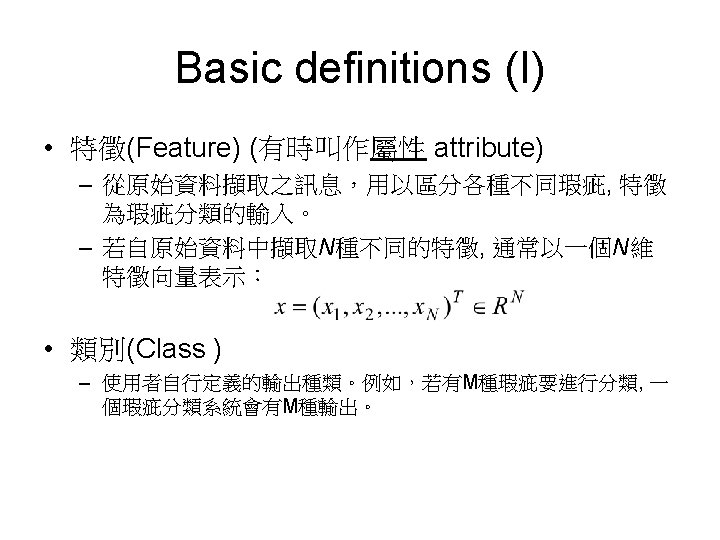
Some basic definitions (III) • 散佈圖 (Scatter plot)
Some basic definitions (III)
Why scatter plot? • It can achieve the goal of data visualization • By observation, we can select some salient features and exclude some redundant features from a large number of feature candidates before the design of the defect classification system. • If there exist N feature candidates, we need to observe N(N-1)/2 scatter plots. • If N is too large, this method is time-consuming! Accordingly, an automatic feature selection method is necessary!
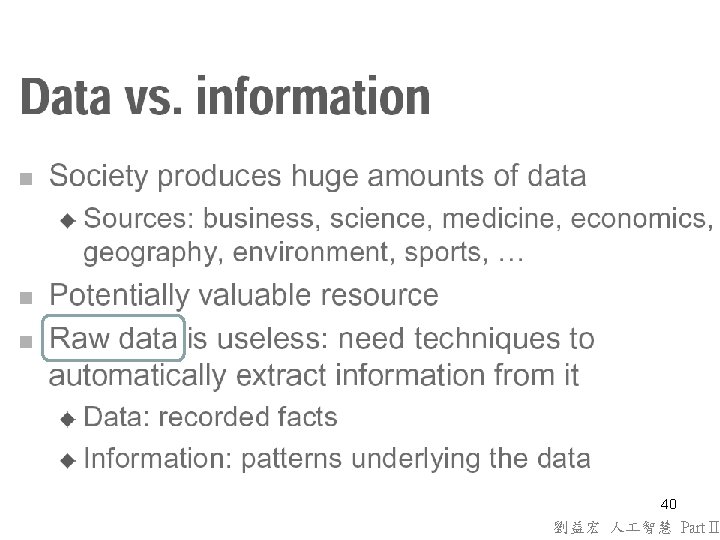
AI Part 2: Basics of Data, Information, and Machine Learning 39 劉益宏 人 智慧 Part II
An instance, or simply called a data Outcome, or class 類別 The first attribute, or feature Cool, , A set of rules learned from the information – not necessarily a very good one! 44 劉益宏 人 智慧 Part II
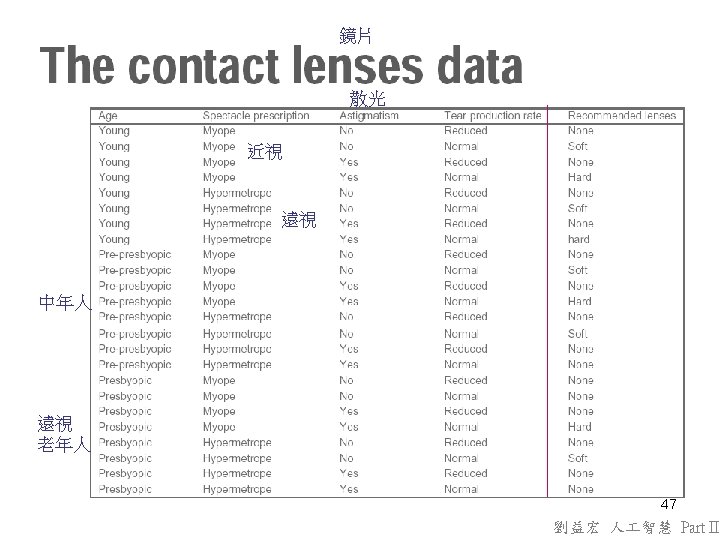
Mixed-attribute problem 46 劉益宏 人 智慧 Part II
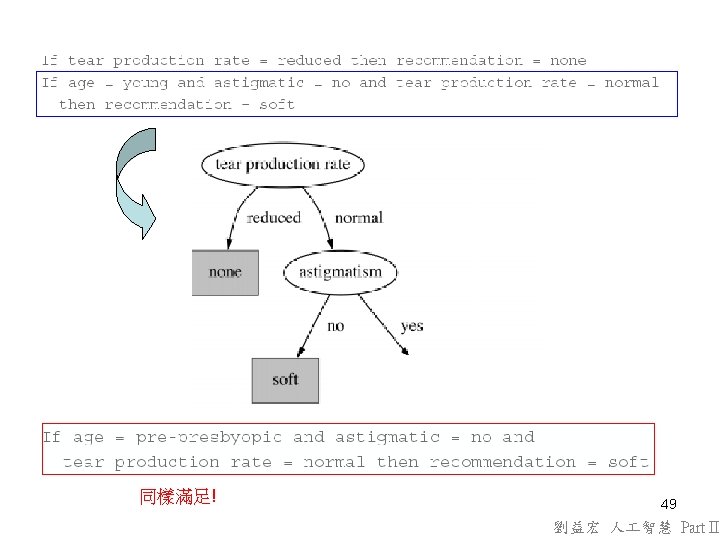
Splitting rule Branch! leaf According to the lens data, the rule is correct! We can use the rule to build the decision tree! 48 劉益宏 人 智慧 Part II
Result! 50 劉益宏 人 智慧 Part II
This figure shows a structural description for the contact lens data in the form of a decision tree Visualization ! 51 劉益宏 人 智慧 Part II
Check this rule: Is this rule real? The recommendation maybe soft. Why? It maybe soft! 52 劉益宏 人 智慧 Part II
Check this: The rule is correct! The result is correct! 53 劉益宏 人 智慧 Part II
Check this rule: According to the data, this rule is correct! However, it is not completely correct in the decision tree! The information about the spectacle prescription is not enough! ? ? 54 劉益宏 人 智慧 Part II
Check this rule: This rule is correct! The output of this decision tree is also correct! Correct! 55 劉益宏 人 智慧 Part II
Check the final rule: ? ? Correct! The rule is correct! Also… The output of the decision tree is correct! Correct! 56 劉益宏 人 智慧 Part II
A set of rules learned from the information of the data! 57 劉益宏 人 智慧 Part II
Iris data: a classic numeric dataset 1. Iris data contains three classes (categories): 1. Iris setosa (class 1), 2. Iris versicolor (class 2) 3. Iris virginica (class 3). 2. Each class has 50 samples (50 row data, 50 instances). 3. Each sample has four features (attributes): 1. 2. 3. 4. sepal length (SL), sepal width (SW), petal length (PL), petal width (PW). 58 劉益宏 人 智慧 Part II
Many many Iris flowers…. . sepal length (SL) petal length (PL) sepal width (SW) petal width (PW). Classification machine Iris setosa (class 1) Iris virginica (class 3) Iris versicolor (class 2) 59 劉益宏 人 智慧 Part II
Class 60 劉益宏 人 智慧 Part II
Observing the Iris data in feature space with scatter plots • 2 -D feature space – (SL-SW) scatter plot – (SL-PL) scatter plot – (SL-PW) scatter plot Observable! – …. – (PL-PW) scatter plot • 3 -D feature space • 4 -D feature space – (SL-SW-PL-PW) scatter plot Unobservable! 61 劉益宏 人 智慧 Part II
An example: Scatter plot of SL-SW The symbols “. ”, “+”, and “*” represent the classes Iris setosa (class 1), Iris versicolor (class 2), and Iris virginica (class 3), respectively 62 劉益宏 人 智慧 Part II
An example: Scatter plot of SL-PL The symbols “. ”, “+”, and “*” represent the classes Iris setosa (class 1), Iris versicolor (class 2), and Iris virginica (class 3), respectively 63 劉益宏 人 智慧 Part II
An example: Scatter plot of SW-PW The symbols “. ”, “+”, and “*” represent the classes Iris setosa (class 1), Iris versicolor (class 2), and Iris virginica (class 3), respectively 64 劉益宏 人 智慧 Part II
An example: Scatter plot of PL-PW The symbols “. ”, “+”, and “*” represent the classes Iris setosa (class 1), Iris versicolor (class 2), and Iris virginica (class 3), respectively 65 劉益宏 人 智慧 Part II
關聯學習 They will be illustrated in this course… 71 劉益宏 人 智慧 Part II
How many clusters in this scatter plot? An outlier might form one cluster 73 劉益宏 人 智慧 Part II
How many clusters in this scatter plot? (Cont. ) 74 劉益宏 人 智慧 Part II
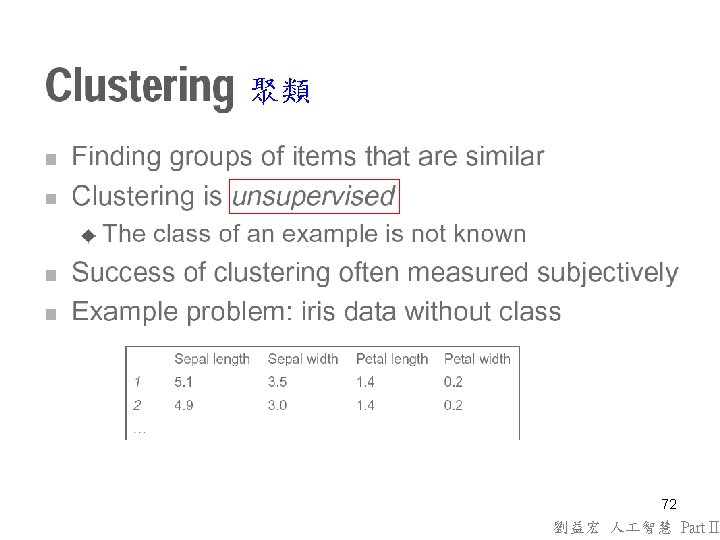
There are “three” classes in the feature space for the Iris data, while there’re only “two” clusters. 75 劉益宏 人 智慧 Part II
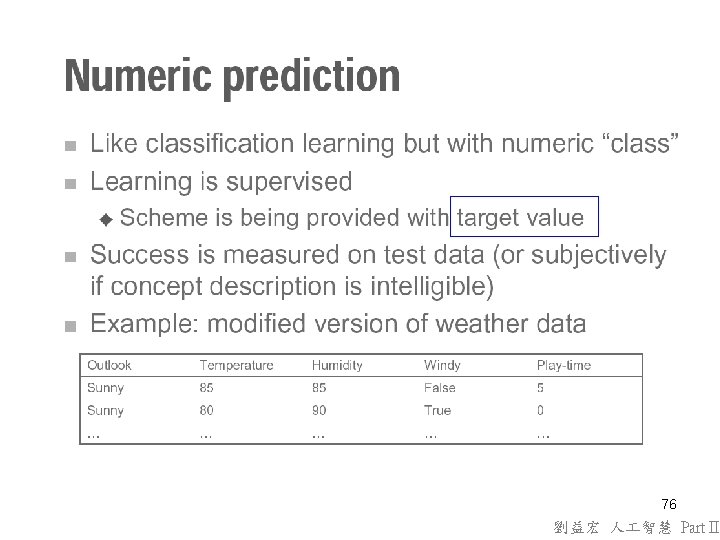
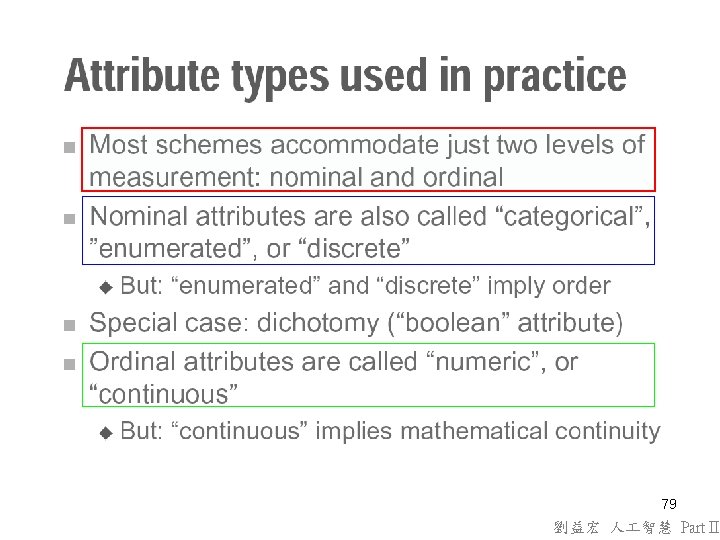
Categorical Numeric 78 劉益宏 人 智慧 Part II