
Arpana Iyengar Professor Department of Pediatric Nephrology St


- Slides: 25
Arpana Iyengar Professor Department of Pediatric Nephrology St John’s Medical College Hospital Bangalore IFKF Meet 2018, Chennai
§ 1. Nutrition-A neglected player § 2. Nutritional- Links in children § 3. Nutrition-Exciting tools
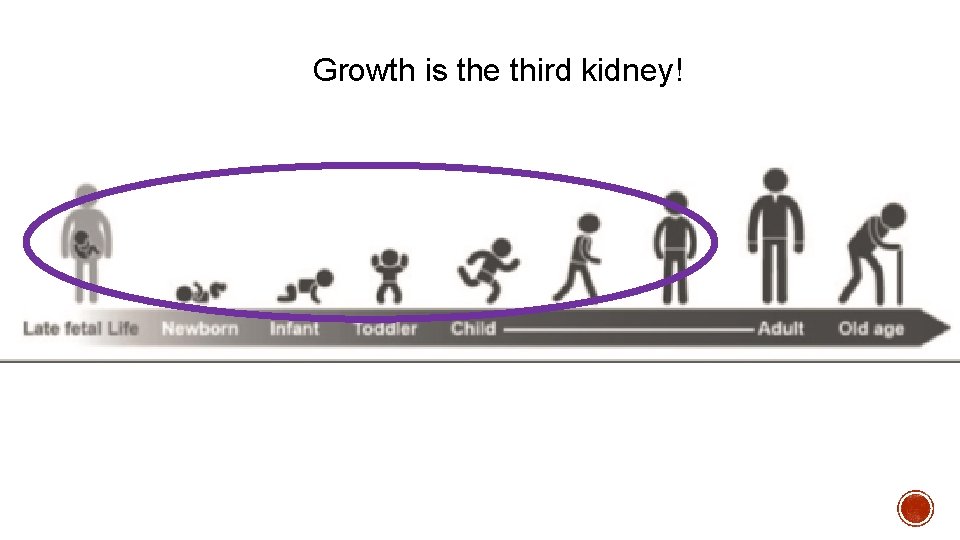
Growth is the third kidney!
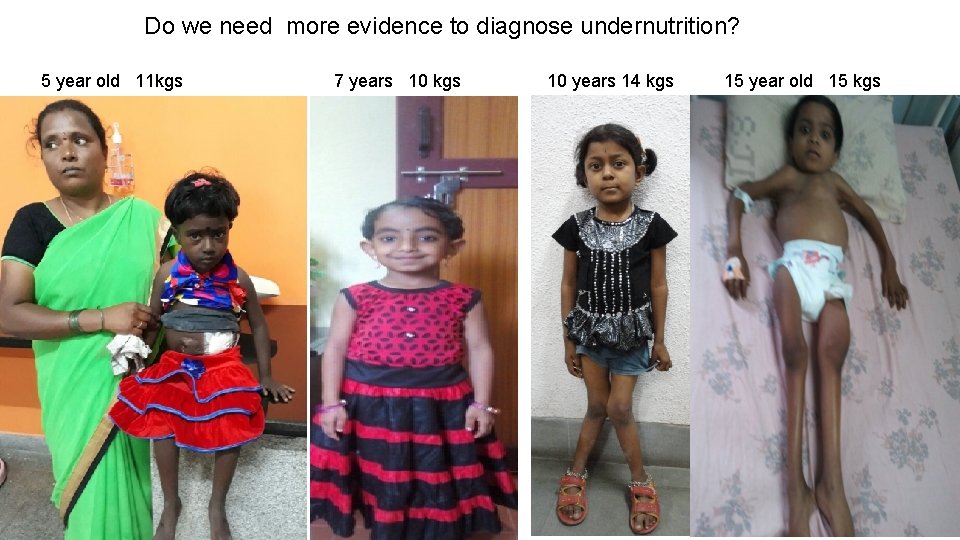
Do we need more evidence to diagnose undernutrition? 5 year old 11 kgs 7 years 10 kgs 10 years 14 kgs 15 year old 15 kgs
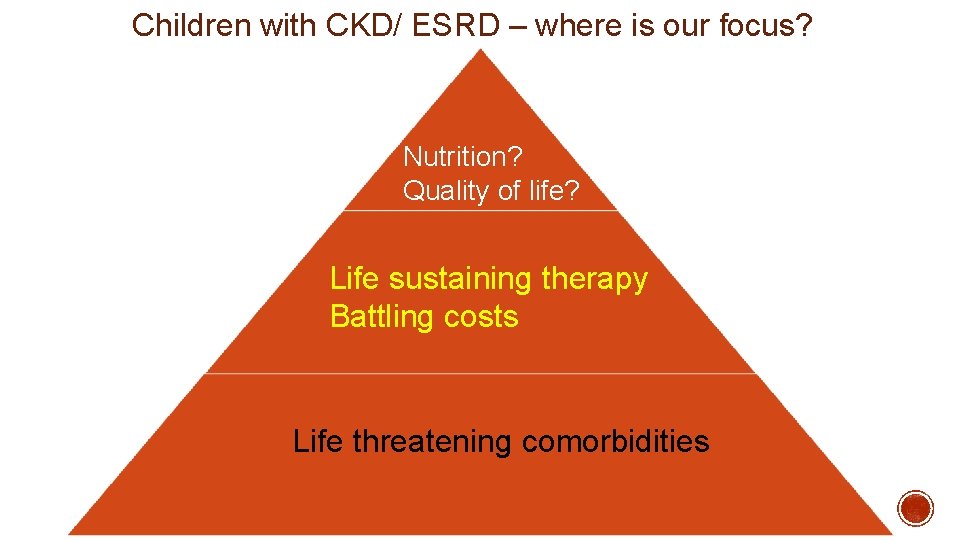
Children with CKD/ ESRD – where is our focus? Nutrition? Quality of life? Life sustaining therapy Battling costs Life threatening comorbidities
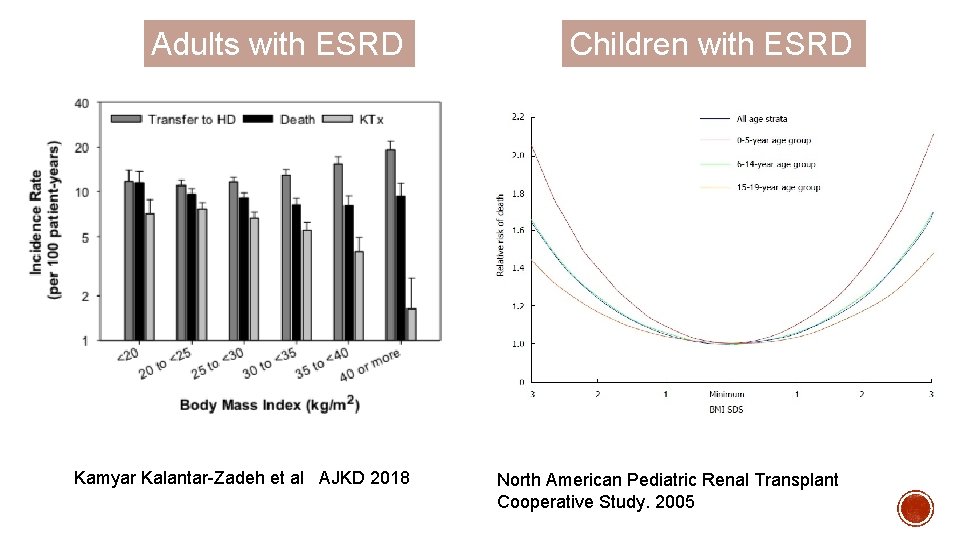
Adults with ESRD Kamyar Kalantar-Zadeh et al AJKD 2018 Children with ESRD North American Pediatric Renal Transplant Cooperative Study. 2005
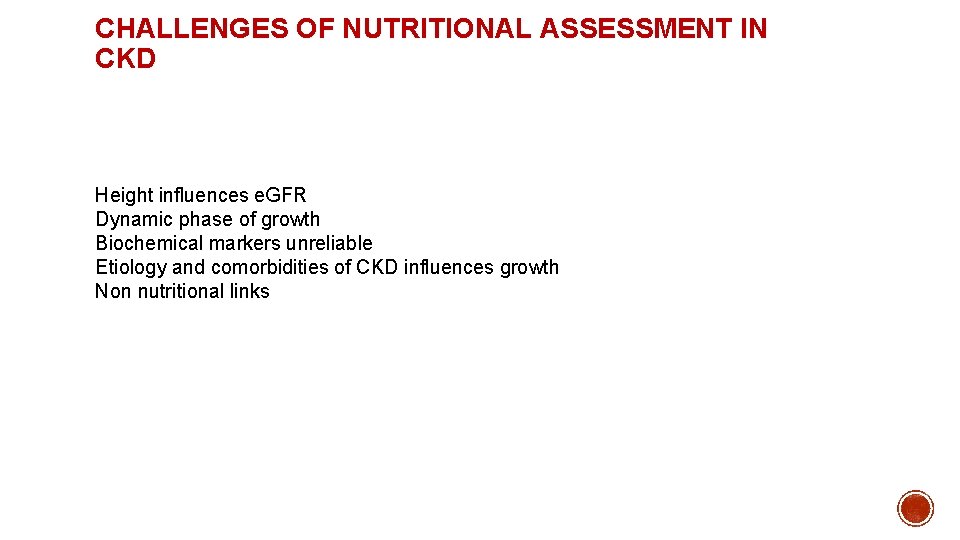
CHALLENGES OF NUTRITIONAL ASSESSMENT IN CKD Height influences e. GFR Dynamic phase of growth Biochemical markers unreliable Etiology and comorbidities of CKD influences growth Non nutritional links
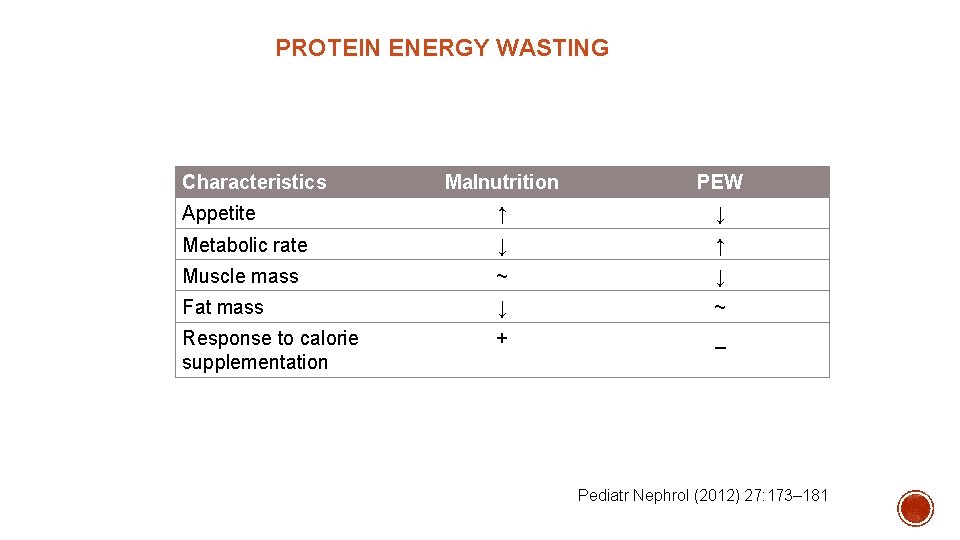
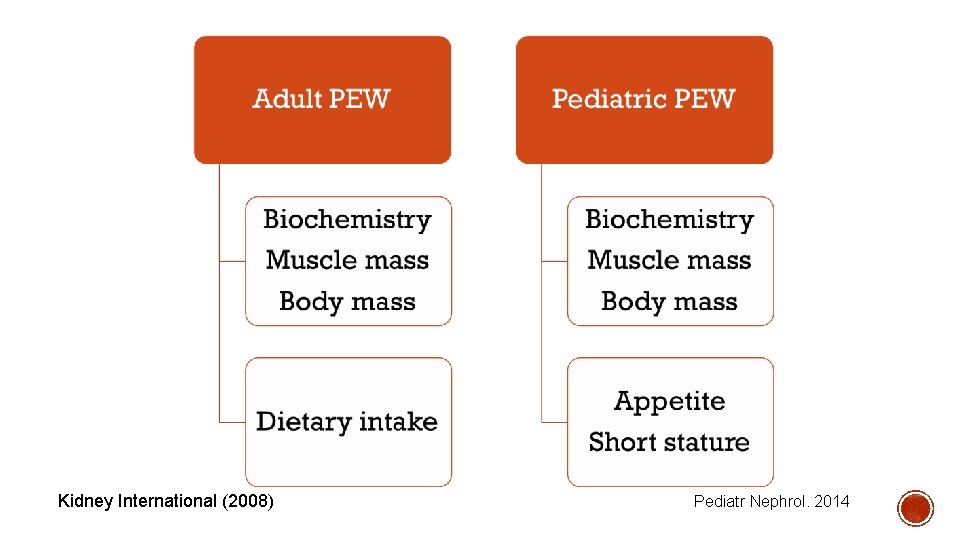
PROTEIN ENERGY WASTING Characteristics Malnutrition PEW Appetite ↑ ↓ Metabolic rate ↓ ↑ Muscle mass ~ ↓ Fat mass ↓ ~ Response to calorie supplementation + _ Pediatr Nephrol (2012) 27: 173– 181
Kidney International (2008) Pediatr Nephrol. 2014
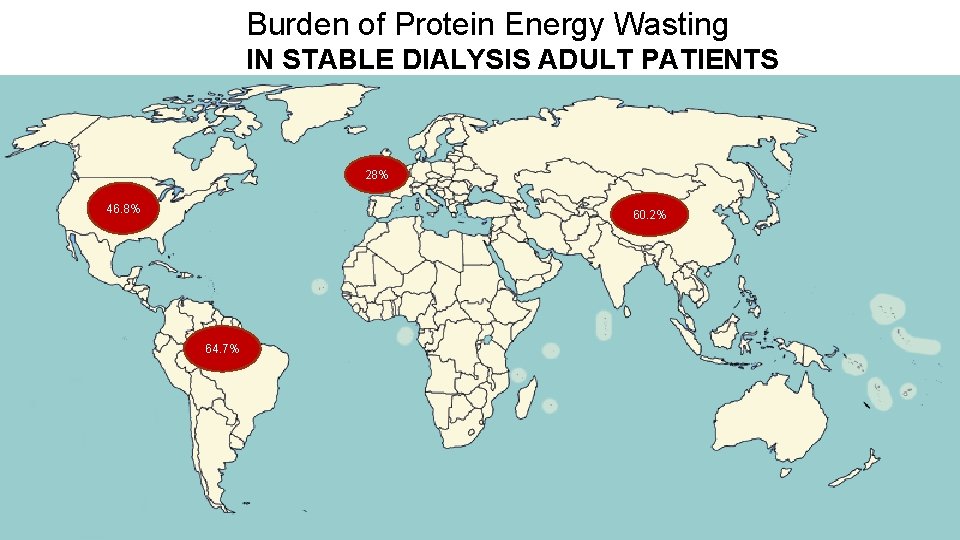
Burden of Protein Energy Wasting IN STABLE DIALYSIS ADULT PATIENTS 28% 46. 8% 60. 2% 64. 7%
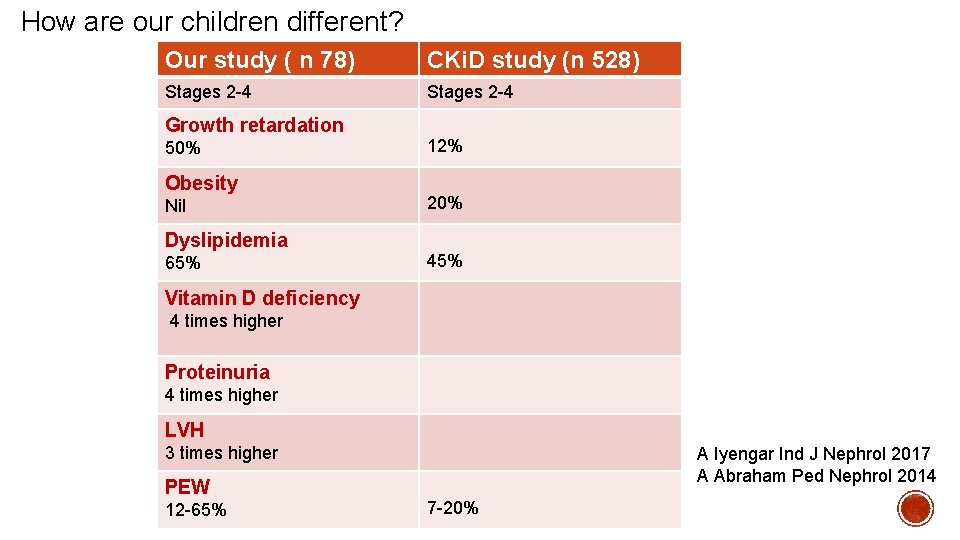
How are our children different? Our study ( n 78) CKi. D study (n 528) Stages 2 -4 Growth retardation 50% Obesity Nil Dyslipidemia 65% 12% 20% 45% Vitamin D deficiency 4 times higher Proteinuria 4 times higher LVH 3 times higher PEW 12 -65% A Iyengar Ind J Nephrol 2017 A Abraham Ped Nephrol 2014 7 -20%
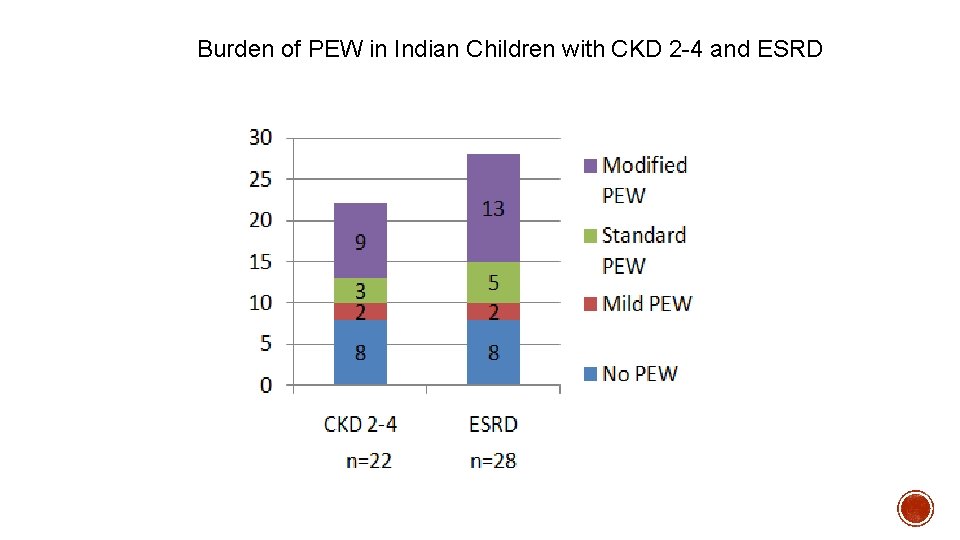
Burden of PEW in Indian Children with CKD 2 -4 and ESRD
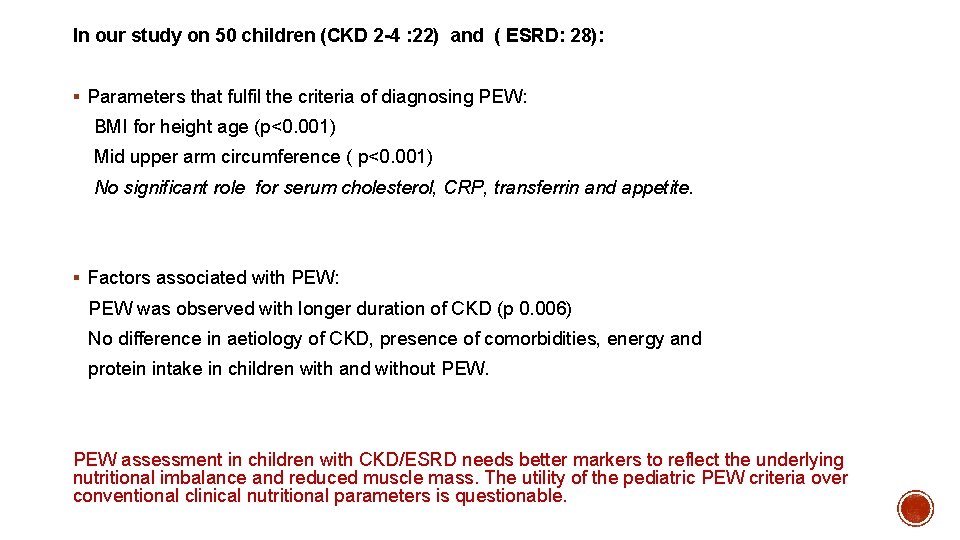
In our study on 50 children (CKD 2 -4 : 22) and ( ESRD: 28): § Parameters that fulfil the criteria of diagnosing PEW: BMI for height age (p<0. 001) Mid upper arm circumference ( p<0. 001) No significant role for serum cholesterol, CRP, transferrin and appetite. § Factors associated with PEW: PEW was observed with longer duration of CKD (p 0. 006) No difference in aetiology of CKD, presence of comorbidities, energy and protein intake in children with and without PEW assessment in children with CKD/ESRD needs better markers to reflect the underlying nutritional imbalance and reduced muscle mass. The utility of the pediatric PEW criteria over conventional clinical nutritional parameters is questionable.
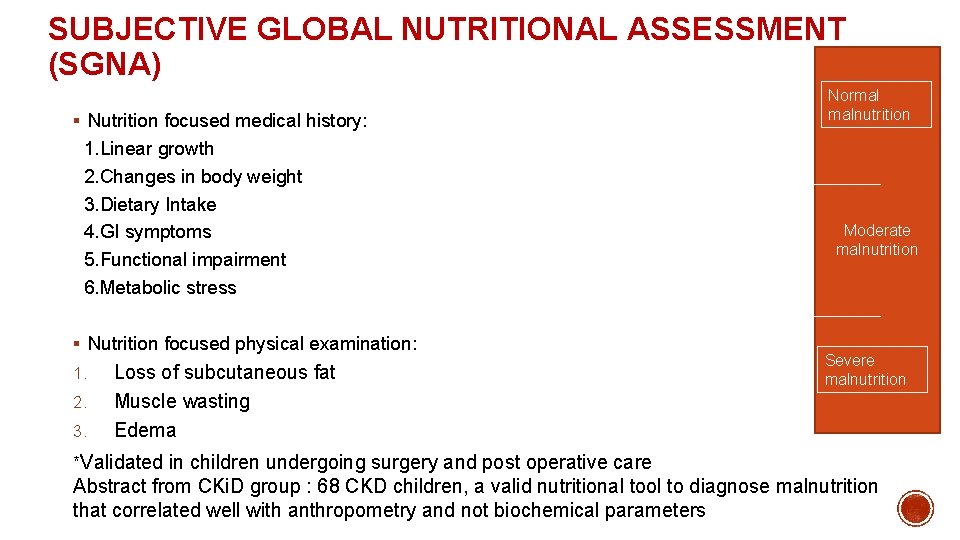
SUBJECTIVE GLOBAL NUTRITIONAL ASSESSMENT (SGNA) § Nutrition focused medical history: 1. Linear growth 2. Changes in body weight 3. Dietary Intake 4. GI symptoms 5. Functional impairment 6. Metabolic stress § Nutrition focused physical examination: 1. 2. 3. Loss of subcutaneous fat Muscle wasting Edema Normal malnutrition Moderate malnutrition Severe malnutrition *Validated in children undergoing surgery and post operative care Abstract from CKi. D group : 68 CKD children, a valid nutritional tool to diagnose malnutrition that correlated well with anthropometry and not biochemical parameters
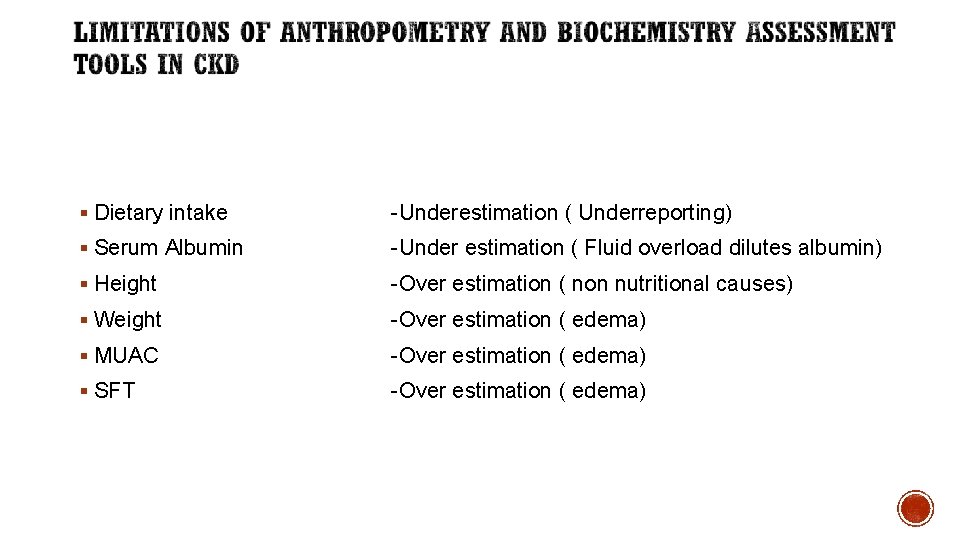
§ Dietary intake -Underestimation ( Underreporting) § Serum Albumin -Under estimation ( Fluid overload dilutes albumin) § Height -Over estimation ( non nutritional causes) § Weight -Over estimation ( edema) § MUAC -Over estimation ( edema) § SFT -Over estimation ( edema)
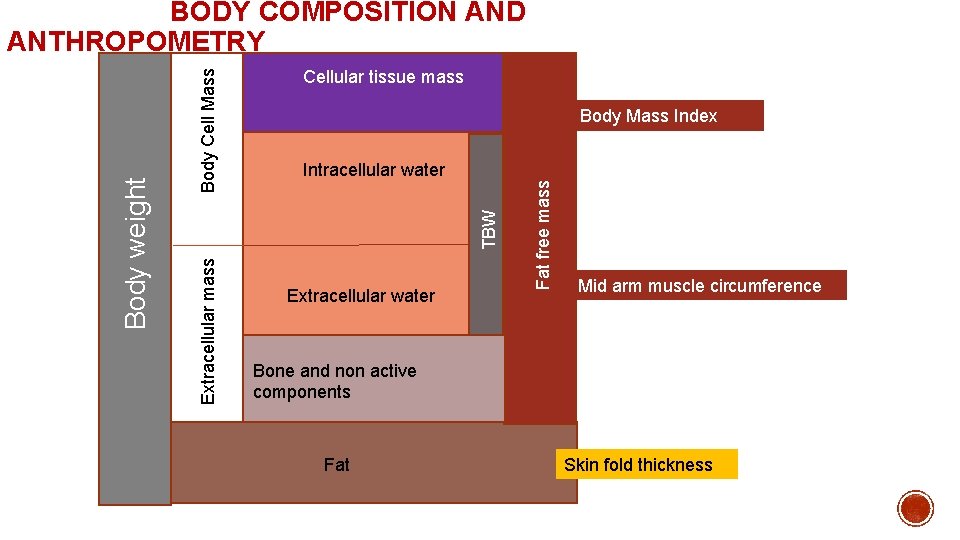
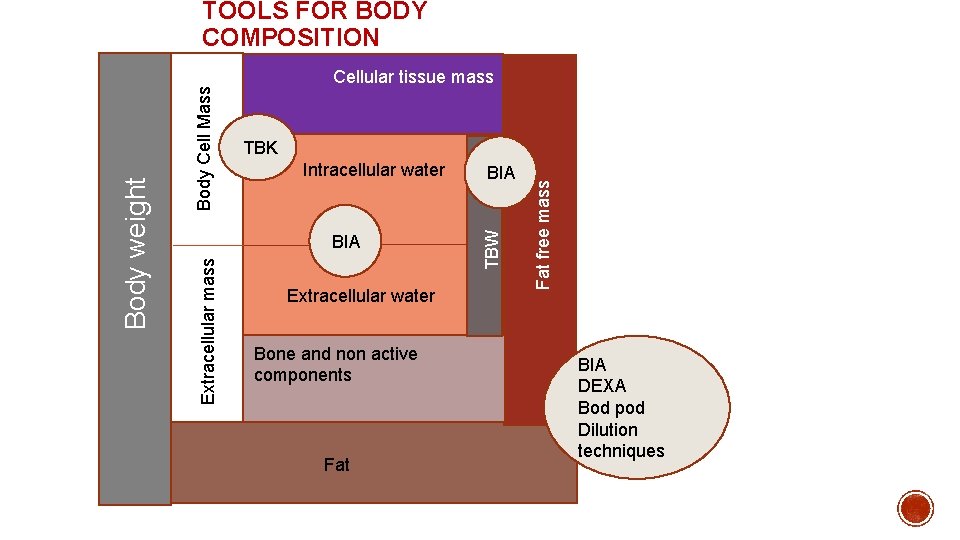
Cellular tissue mass Body Mass Index Extracellular water Fat free mass Intracellular water TBW Body Cell Mass Extracellular mass Body weight BODY COMPOSITION AND ANTHROPOMETRY Mid arm muscle circumference Bone and non active components Fat Skin fold thickness
Intracellular water Extracellular water Bone and non active components Fat BIA Fat free mass TBK TBW Body Cell Mass Cellular tissue mass BIA Extracellular mass Body weight TOOLS FOR BODY COMPOSITION BIA DEXA Bod pod Dilution techniques
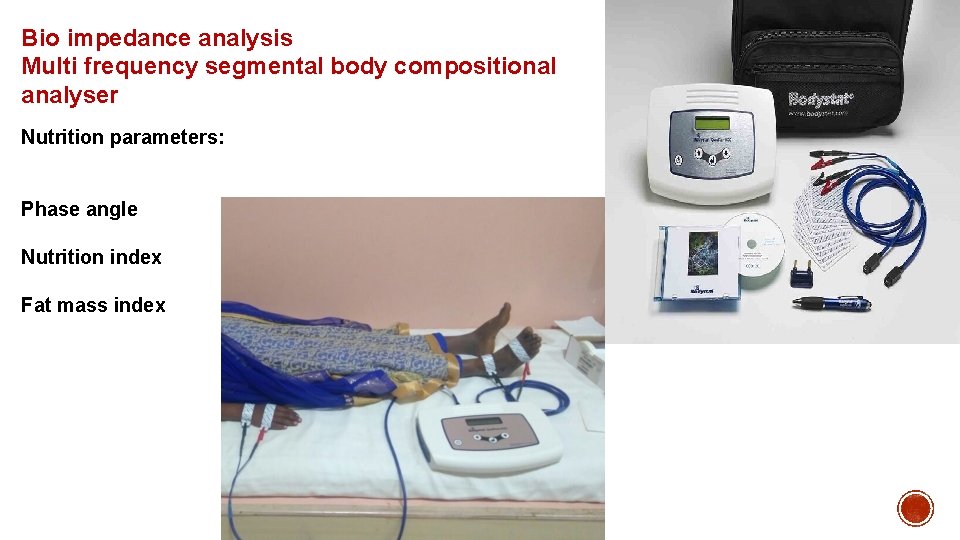
Bio impedance analysis Multi frequency segmental body compositional analyser Nutrition parameters: Phase angle Nutrition index Fat mass index
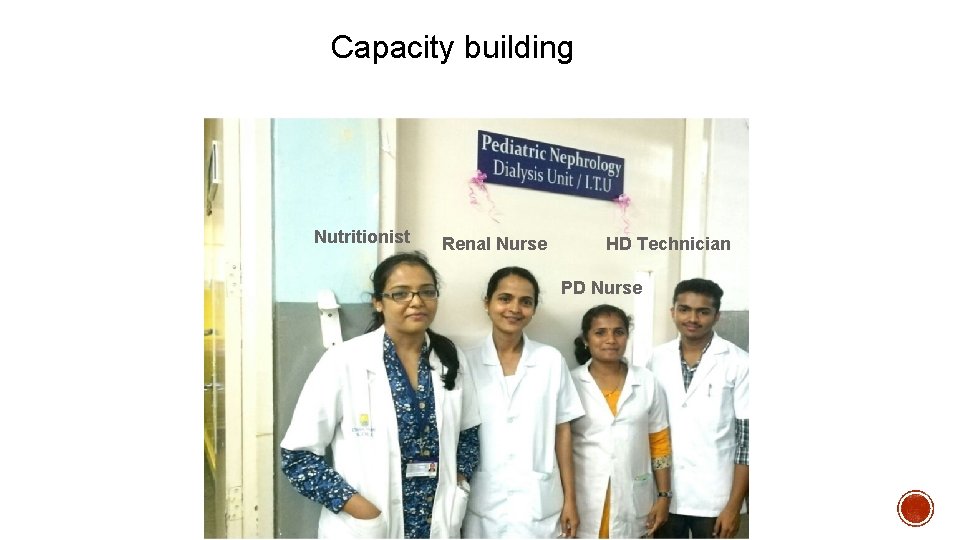
Capacity building Nutritionist Renal Nurse HD Technician PD Nurse
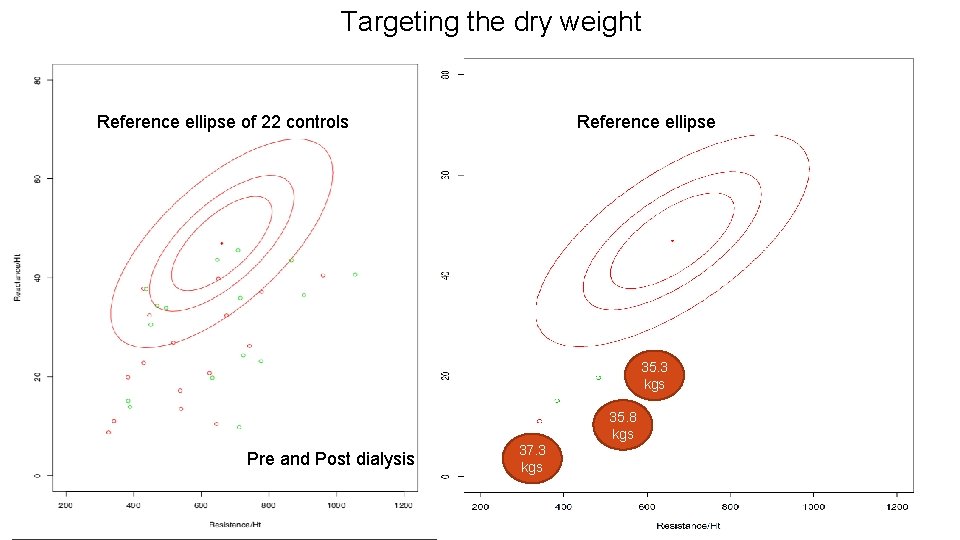
Targeting the dry weight Reference ellipse of 22 controls Reference ellipse 35. 3 kgs 35. 8 kgs Pre and Post dialysis 37. 3 kgs
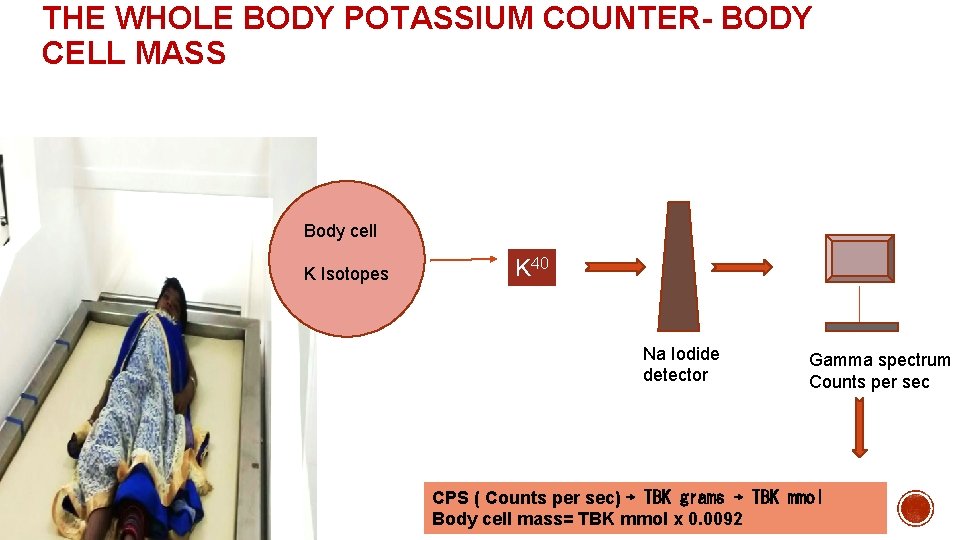
BODY CELL MASS BCM is the metabolically active component of the FFM Contains the energy-metabolising and work-performing tissue. BCM is an ideal indicator of nutritional status, as it is the part of the body which is vital for function, with malnutrition being defined as a loss of functional cell mass. BCM estimation by total body K (TBK) counting can be used in health and disease, because the K concentrations in the BCM are extremely constant and kept within strict limits by homeostatic mechanisms Enteral 1972 J Parenter
THE WHOLE BODY POTASSIUM COUNTER- BODY CELL MASS Body cell K Isotopes K 40 Na Iodide detector Gamma spectrum Counts per sec CPS ( Counts per sec) ⇢ TBK grams ⇢ TBK mmol Body cell mass= TBK mmol x 0. 0092
1. Nutrition needs special focus in our children with CKD 2. Malnutrition- Inflammation link needs further study in children 3. Estimating body cell mass could be meaningful in CKD Thank you!