
Arne Gieseck Adviser DG Economics European Central Bank
Arne Gieseck Adviser DG Economics European Central Bank Measuring uncertainty – including survey measures Presentation at EU workshop on recent developments in business and consumer surveys Brussels, 14 November 2014 The view expressed in this presentation do not necessarily reflect those of the European Central Bank.
Rubric Outline of presentation 1 Why do we want to measure uncertainty? 2 How to measure uncertainty 3 Measuring uncertainty at the ECB 4 How to use EC surveys as measure of uncertainty? 5 Conclusions and future work EU workshop on recent developments in business and consumer surveys 2 www. ecb. europa. eu ©
Rubric Why do we want to measure uncertainty? • A high level of uncertainty has been a defining feature of the macroeconomic situation since the start of the crisis in 2008. • According to economic theory, a high level of economic uncertainty can dampen economic activity, notably via its impact on investment, consumption and employment. • When decisions are costly to revert (e. g. as they entail sunk costs or adjustment costs), high uncertainty may lead households or businesses to take a wait-and-see approach, i. e. to postpone action until uncertainty is resolved. • Uncertainty can also dampen activity via impact of higher risk premia on cost of finance, and via managerial risk aversion. EU workshop on recent developments in business and consumer surveys 3 www. ecb. europa. eu ©
Rubric How to measure uncertainty? • Uncertainty is an unobserved variable, and there is no agreed, objective measure of uncertainty available yet • Measures proposed in literature include: Ø Financial market volatility measures Ø Dispersion in forecasts by professional forecasters Ø Prevalence of terms such as uncertainty in the media Ø Dispersion of expectations in business and consumer surveys • Combination of measures appears to be good practice EU workshop on recent developments in business and consumer surveys 4 www. ecb. europa. eu ©
Rubric Measuring uncertainty at the ECB • Encompassing approach Ø Financial market volatility measures: Ø CDS, FX-, Bond- and equity market volatility; ECB systemic stress indicators Ø Dispersion in forecasts by professional forecasters: Ø Consensus economics dispersion for real GDP growth, HICP inflation and long-term interest rates, current and next year; Ø SPF: variance of aggregate probability distribution for GDP, HICP and unemployment projections, current year, 1 y, 2 y and 5 y ahead Ø Prevalence of terms such as uncertainty in the media: Ø Political uncertainty index published by Baker et al. Ø Dispersion of expectations in business and consumer surveys: Ø EC surveys for manufacturing (Q 5), consumer (Q 2+4), retail (Q 4) and services (Q 3) Ø Yet to come: variance of results from large number of bridge equations EU workshop on recent developments in business and consumer surveys 5 www. ecb. europa. eu ©
Rubric Measuring uncertainty at the ECB (ii) • Highest possible frequency – convert then to monthly and quarterly frequencies • Earliest possible starting dates • Euro area, individual Member States (Germany, France, Italy, Spain, Netherlands), UK, Sweden, Norway, Switzerland, US, Japan, Canada • Run seasonal adjustment where needed • Normalise all series to pre-crisis period January 1999 - December 2007 • Sort individual measures into groups and compile principal component for each group • Sort measures by country • Plot average of principal components and ranges EU workshop on recent developments in business and consumer surveys 6 www. ecb. europa. eu ©
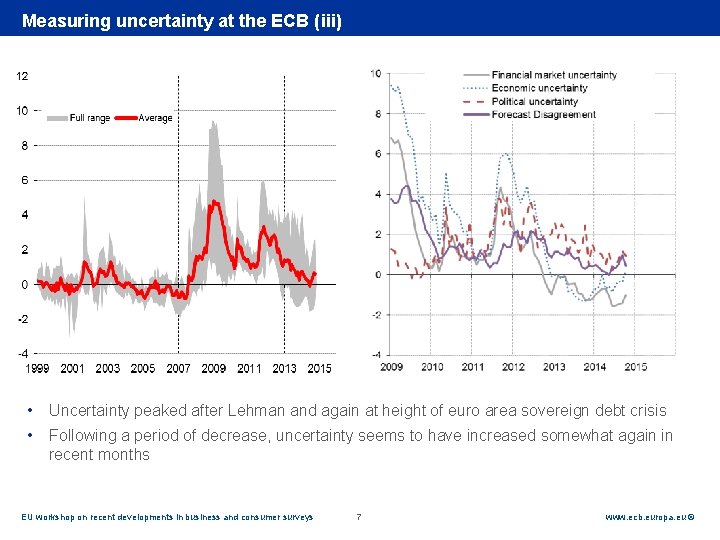
Rubric Measuring uncertainty at the ECB (iii) • Uncertainty peaked after Lehman and again at height of euro area sovereign debt crisis • Following a period of decrease, uncertainty seems to have increased somewhat again in recent months EU workshop on recent developments in business and consumer surveys 7 www. ecb. europa. eu ©
Rubric How to use EC surveys as measure of uncertainty? “Clearly, an indicator of uncertainty that would correct for the influence of the share of ‘unchanged’ replies to the survey would be easier to interpret. Future work should therefore be devoted to disentangling the opposing forces driving the uncertainty measure presented here. ” European Business Cycle Indicator, 3 rd quarter 2013, p. 13. • Will demonstrate by how much the impact of changes in “unchanged” replies matters or even dominates in EC measure of uncertainty • Will propose a different way of calculating uncertainty, which corrects for the influence of “unchanged” replies • Will argue that such a measure needs to be interpreted in fundamentally different way EU workshop on recent developments in business and consumer surveys 8 www. ecb. europa. eu ©
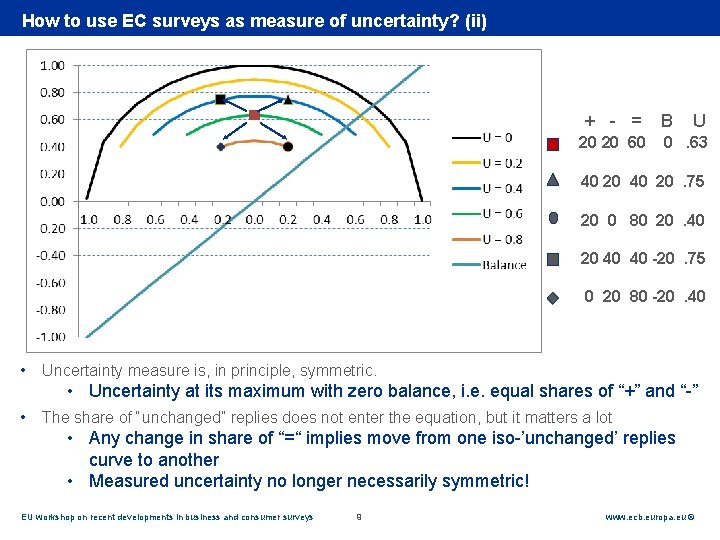
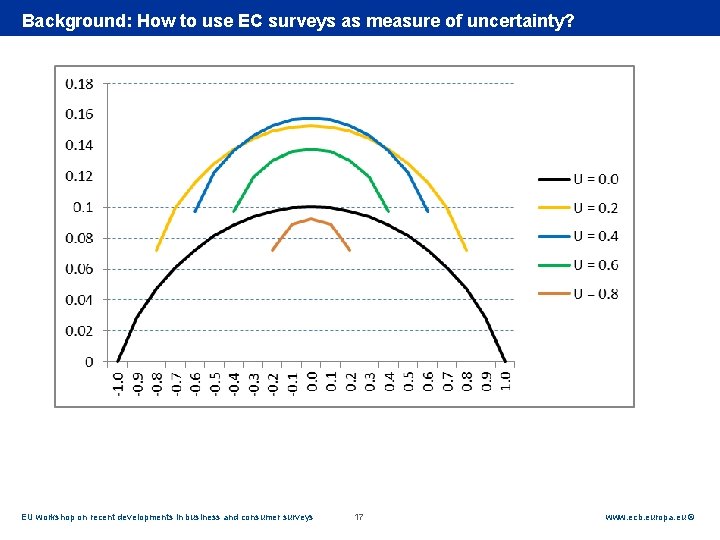
Rubric How to use EC surveys as measure of uncertainty? (ii) + - = 20 20 60 B U 0. 63 40 20. 75 20 0 80 20. 40 20 40 40 -20. 75 0 20 80 -20. 40 • Uncertainty measure is, in principle, symmetric. • Uncertainty at its maximum with zero balance, i. e. equal shares of “+” and “-” • The share of “unchanged” replies does not enter the equation, but it matters a lot • Any change in share of “=“ implies move from one iso-’unchanged’ replies curve to another • Measured uncertainty no longer necessarily symmetric! EU workshop on recent developments in business and consumer surveys 9 www. ecb. europa. eu ©
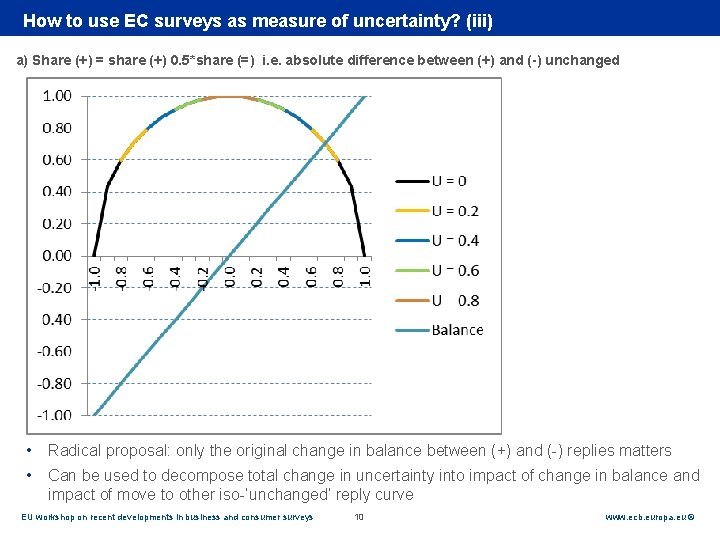
Rubric How to use EC surveys as measure of uncertainty? (iii) a) Share (+) = share (+) 0. 5*share (=) i. e. absolute difference between (+) and (-) unchanged • Radical proposal: only the original change in balance between (+) and (-) replies matters • Can be used to decompose total change in uncertainty into impact of change in balance and impact of move to other iso-‘unchanged’ reply curve EU workshop on recent developments in business and consumer surveys 10 www. ecb. europa. eu ©
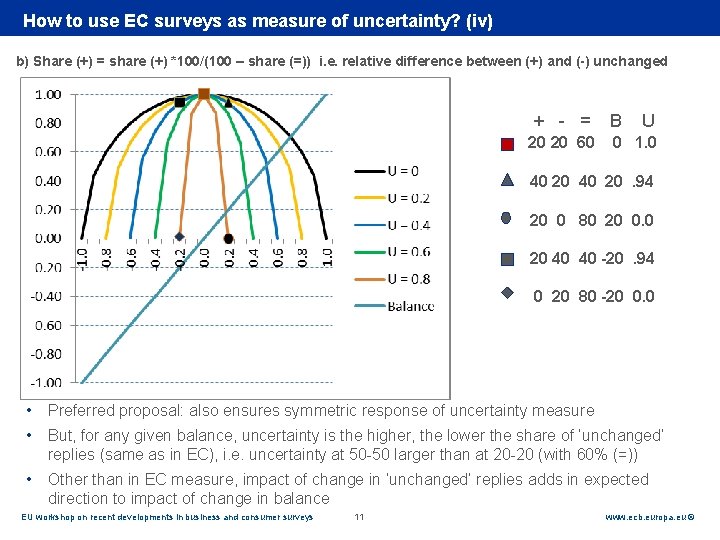
Rubric How to use EC surveys as measure of uncertainty? (iv) b) Share (+) = share (+) *100/(100 – share (=)) i. e. relative difference between (+) and (-) unchanged + - = 20 20 60 B U 0 1. 0 40 20. 94 20 0 80 20 0. 0 20 40 40 -20. 94 0 20 80 -20 0. 0 • Preferred proposal: also ensures symmetric response of uncertainty measure • But, for any given balance, uncertainty is the higher, the lower the share of ‘unchanged’ replies (same as in EC), i. e. uncertainty at 50 -50 larger than at 20 -20 (with 60% (=)) • Other than in EC measure, impact of change in ‘unchanged’ replies adds in expected direction to impact of change in balance EU workshop on recent developments in business and consumer surveys 11 www. ecb. europa. eu ©
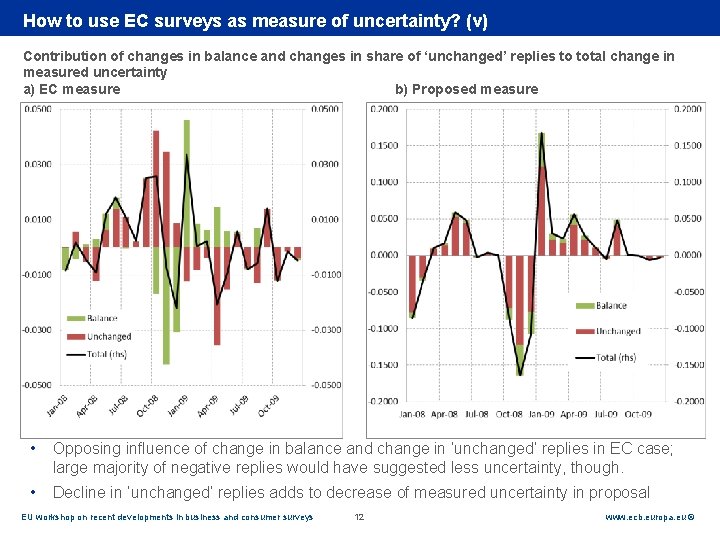
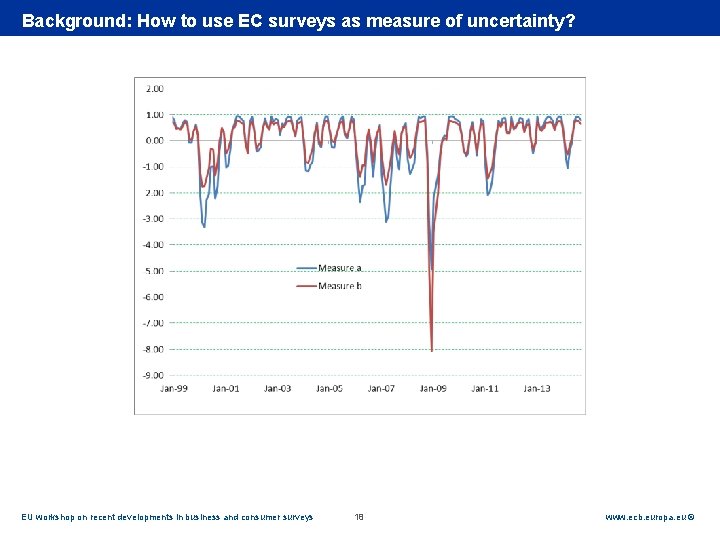
Rubric How to use EC surveys as measure of uncertainty? (v) Contribution of changes in balance and changes in share of ‘unchanged’ replies to total change in measured uncertainty a) EC measure b) Proposed measure • Opposing influence of change in balance and change in ‘unchanged’ replies in EC case; large majority of negative replies would have suggested less uncertainty, though. • Decline in ‘unchanged’ replies adds to decrease of measured uncertainty in proposal EU workshop on recent developments in business and consumer surveys 12 www. ecb. europa. eu ©
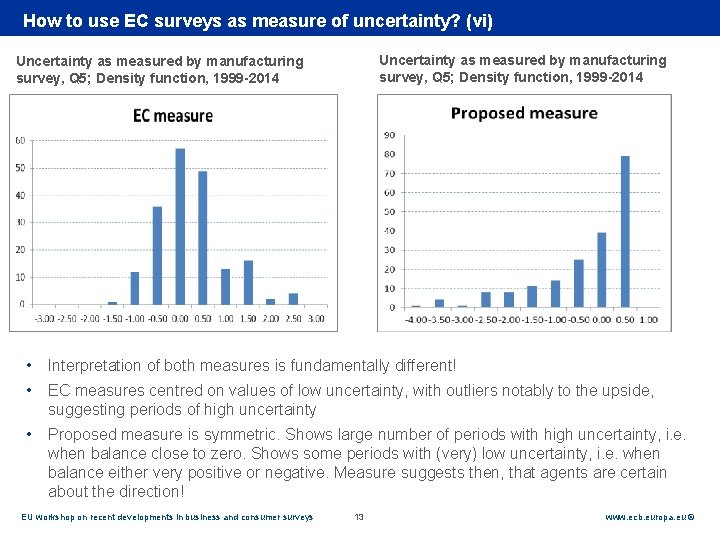
Rubric How to use EC surveys as measure of uncertainty? (vi) Uncertainty as measured by manufacturing survey, Q 5; Density function, 1999 -2014 • Interpretation of both measures is fundamentally different! • EC measures centred on values of low uncertainty, with outliers notably to the upside, suggesting periods of high uncertainty • Proposed measure is symmetric. Shows large number of periods with high uncertainty, i. e. when balance close to zero. Shows some periods with (very) low uncertainty, i. e. when balance either very positive or negative. Measure suggests then, that agents are certain about the direction! EU workshop on recent developments in business and consumer surveys 13 www. ecb. europa. eu ©
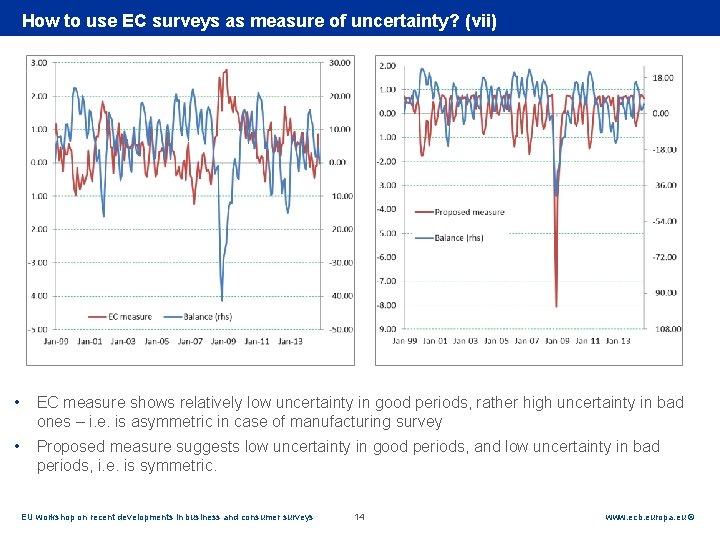
Rubric How to use EC surveys as measure of uncertainty? (vii) • EC measure shows relatively low uncertainty in good periods, rather high uncertainty in bad ones – i. e. is asymmetric in case of manufacturing survey • Proposed measure suggests low uncertainty in good periods, and low uncertainty in bad periods, i. e. is symmetric. EU workshop on recent developments in business and consumer surveys 14 www. ecb. europa. eu ©
Rubric Conclusions and future work • It is important (but difficult) to have broad-based information on prevailing uncertainty • Proposed measure improves on existing one: – is symmetric by construction – offers intuitive interpretation – Captures envisaged role of ‘unchanged’ replies • Proposed measures requires different interpretation! • Future work – Proposed measure for uncertainty requires different econometric approach to capture its impact, but might be more complementary than existing measure – Develop other measures to capture uncertainty EU workshop on recent developments in business and consumer surveys 15 www. ecb. europa. eu ©
Rubric Thank you very much for your attention! EU workshop on recent developments in business and consumer surveys 16 www. ecb. europa. eu ©
Rubric Background: How to use EC surveys as measure of uncertainty? EU workshop on recent developments in business and consumer surveys 17 www. ecb. europa. eu ©
Rubric Background: How to use EC surveys as measure of uncertainty? EU workshop on recent developments in business and consumer surveys 18 www. ecb. europa. eu ©
- Slides: 18