Are You Minding The Gap The Gender Gap


 Track metrics Set gender targets")


- Slides: 66
Are You Minding The Gap? The Gender Gap November 2, 2016 Fatma Abdel-Raouf Pat Buhler
The Gaps • The pay gap • The leadership ghttp: //www. pbs. org/wnet/need-to-know/economy/bridging-the-gender-wage-gap/835/ap
The State of the Gap • The problem isn’t going away. . 118 years to close the gap! http: //www. intelligentinsurer. com/article/closing-the-gaps
The Breadth of the Gap • This is everyone’s problem! • Global Annual GDP http: //businesstech. co. za/news/general/31803/minimum-wages-around-the-world/
Causes of The Gap • Distinction between explainable and unexplainable factors. . . Confidence http: //www. huffingtonpost. ca/2016/03/08/canada-gender-pay-gap_n_9393924. html
The Impact on the Gap • Willingness and ability to negotiate salary http: //pathirst. com/workshops-training/effective-negotiation-skills/
A Picture of the Gap • AAUW report http: //history. aauw. org/aauw-research/1991 -shortchanging-girls
The Progress of the Gap • The times they are a changin’. . - NOT! http: //chordstabslyrics. com/album/bob-dylan/the-times-they-are-a-changin
The Research “Men are more likely than women students to rate their academic abilities highly…. ” - Sander and Sanders STEM confidence levels - Litzler, Samuelson, and Loral http: //www. gettyimages. com/detail/video/college-students-in-class-stock-footage/483766707
The Bottom Line • Women underestimate their abilities • A self-perpetuating cycle http: //kristiholl. net/writers-blog/2013/08/new-twist-on-the-thought-feeling-behavior-writing-cycle/
The Story is in the Numbers. . . https: //gencodegenes. wordpress. com/index/colourful-preschool-numbers/
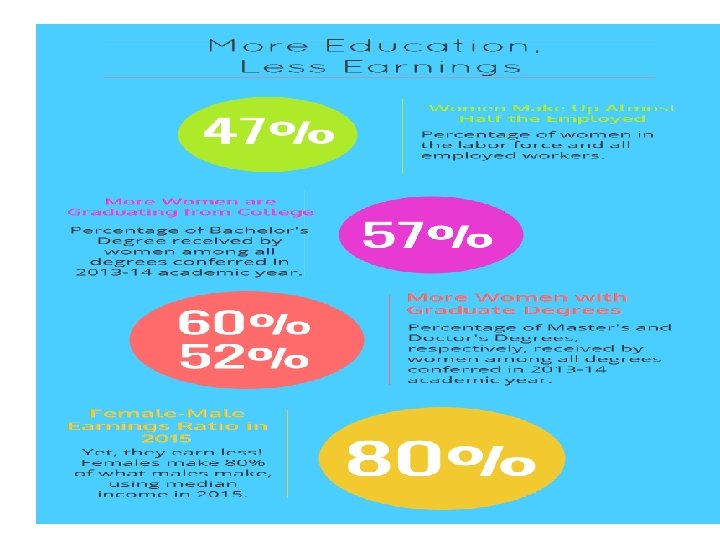
The Gender Pay Gap: Why So Many Numbers?
The Gender Pay Gap: Why So Many Numbers?
How wide-spread is the gender pay gap is?
Gender Pay Gap by Race: F/M Earnings Ratio in 2014 by Race 82% White 90% 89% 78% Black or African American Hispanic or Latino Asian
Gender Pay Gap by Race: % of White Males WF BM BF HM HF Asian M Asian F 81% 74% 67% 69% 62% 123% 95%
Gender Pay Gap by Age Group: F/M Earnings Ratio F/M EARNINGS RATIO IN 2014 BY AGE GROUP 92 90 81 77 76 79 16 -24 25 - 34 35 - 44 45 - 54 55 - 64 65 years years and older
Gender Pay Gap by Marital Status: F/M Earnings Ratio in 2014 by Marital Status 94 79 Naver Married, Spouse Present 83 82 Divorced Separated 77 Widowed
Gender Pay Gap by Educational Attainment: F/M Earnings Ratio in 2014 by Educational Background 79% 77% 76% 73% Less than High school Some Bachelor's Advanced high school graduates, college or degree and degree diploma no college associate only higher degree
The Gender Pay Gap in Management Jobs: F/M Earnings and Employment Ratios, CEOs 2015 82% 37% F/M Earnings Ratio, CEOs F/M Employment Ratio, CEOs
General and Operations Managers: F/M Earnings and Employment Ratios, 2015 74% 33% F/M Earnings Ratio F/M Employment Ratio
Marketing and Sales Managers: F/M Earnings and Employment Ratios, 2015 78% 66% F/M Earnings F/M Ratio Employment Ratio
F/M EARNINGS AND EMPLOYMENT RATIOS, 2015 85% 65% 274% F/M EARNINGS AND EMPLOYMENT RATIOS, 2015 Financial Managers 104% Human Resources Managers F/M Earnings F/M Ratio Employment Ratio
The Female/Male Earnings Ratio in Professional Jobs: F/M Earnings Ratio, 2015 86% 87% 83% 81% Computer systems analysts Computer programmers Software developers Web developers
The Female/Male Employment Ratio in Professional Jobs: F/M Employment Ratio, 2015 54% 53% 26% Computer systems analysts Computer programmers 22% Software developers Web developers
F/M Earnings Ratio, 2015 90% 89% 88% 81% Lawyers Postsecondary Elementary and Secondary teachers middle school teachers
F/M Employment Ratio, 2015 417% 60% Lawyers 78% 139% Postsecondary Elementary and Secondary teachers middle school teachers
F/M Earnings Ratio, 2015 90% 86% 80% Pharmacists Physicians Physical and surgeons therapists Registered nurses
F/M Employment Ratio, 2015 757% 110% 62% Pharmacists Physicians and surgeons 220% Physical therapists Registered nurses
Women are Underrepresented in the Corporate Pipeline: % of Employees in the Corporate Pipeline by Gender, 2016 Position Entry Level Manager Sr. Manager/ Director VP SVP C-Suite M F 54% 46% 63% 37% 67% 71% 76% 81% 33% 29% 24% 19%
It is Even Worse for Women of Color: % of Employees in the Corporate Pipeline, 2016 Position Male Femal WM of WF es of Color Entry Level 35% 16% 32% 17% Manager 45% 15% 29% 12% Sr. Manager 52% 13% 27% / Director 8% VP 60% 11% 23% 6% SVP 66% 10% 20% 4% C-Suite 71% 10% 17% 3%
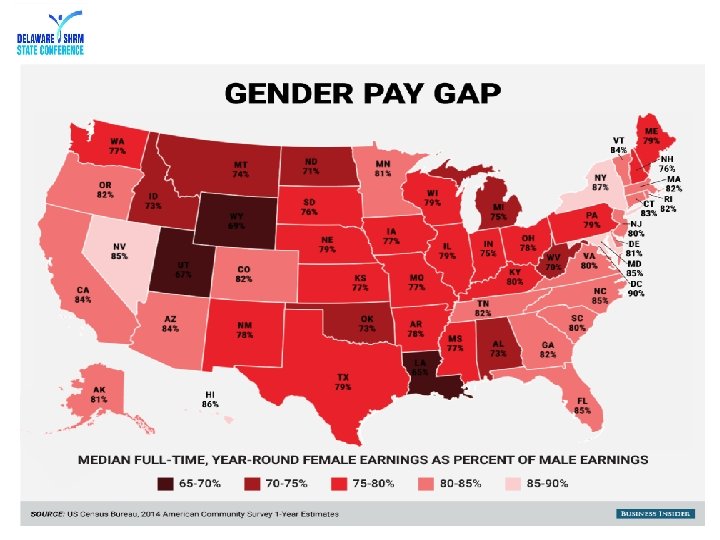
Gender Pay Gap by States: 2014 Top and Bottom 10 States, F/M Earnings Ratio 68 78 77 77 76 75 74 73 83 96 93 90 89 89 88 87 87 86 86 Wyoming Utah Montana Alabama Kentucky New Jersey West Virginia North Dakota Louisiana New Mexico U. S. Overall North Carolina Illinois Arkansas Maryland Delaware Vermont California Tennessee Hawaii D. C.
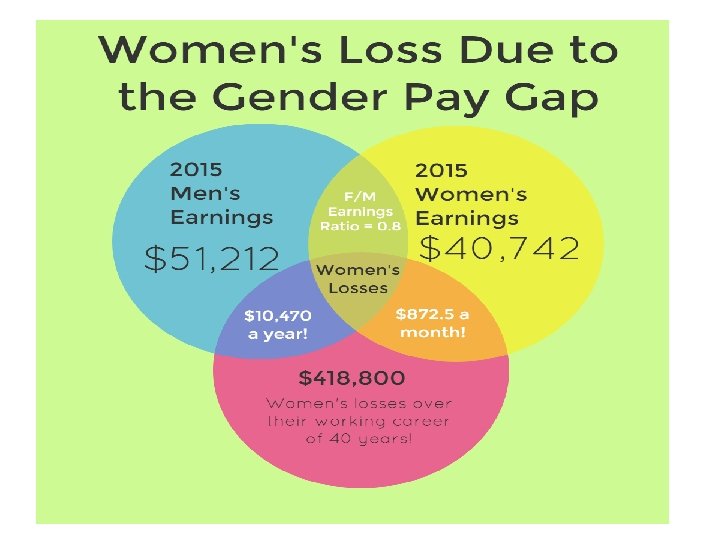
How Much Money are Women Losing Over their Working Life Due to Gender Pay Inequality? 2014, $10, 762 x 40 years of work = a whopping $430, 480 of losses!
255 040 264 960 271 960 North Carloina Hawaii New York 650 960 663 440 671 840 Utah Louisiana 581 480 542 600 Wyoming North Dakota New Hampshire 430 480 252 040 Nevada United States 248 120 Florida Top and Bottom 5 States for Women’s Losses Over Their Working Life, 2014:
Women's Losses Over their Working Life, 2014 477 080 344 160 387 920 420 280 MD (15) DE (24) PA (30) NJ (42)
F/M Earnings Ratio By Education in Wilmington, DE in 2014 84% Overall 81% 88% 70% Less than high High school Some College school graduates or associate's (includes degree equivalency) 74% 60% Bachelor's degree graduate or professional degree
Women's Losses Over Their Working Life By Education in Wilmington, DE in 2014 1 307 240 636 880 490 440 227 960 Overall 141 360 High school graduates Some College or associate's degree Bachelor's degree graduate or professional degree
2015 Poverty Rates and Gender Gap: 2015 Poverty Rate 14, 2% 11% 10, 3% 7% 18 to 64 years old Women 65 and older Men The gender gap exists in poverty rates as well.
Gender Pay Gap and Poverty: U. S. DE Current poverty rate PA MD Poverty Rate with Equal Pay 4, 4% 2, 1% 2, 0% 4, 6% 3, 8% 7, 4% 3, 4% 4, 0% 7, 5% 8, 2% POVERTY RATE AMONG ALL WORKING WOMEN IN 2014 NJ
Gender Pay Gap and Poverty: U. S. DE PA MD Current poverty rate 8% 18% 7% 15% 12% 29% 13% 16% 28% 29% Poverty Rate Among Single Working Mothers In 2014 NJ
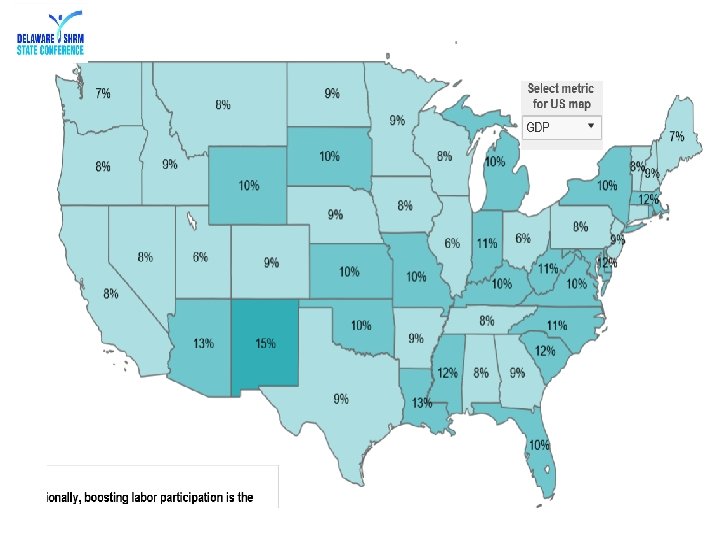
3, 4% 3, 0% DE 3, 1% U. S. 2, 3% 2, 8% Gender Pay Gap and Economic Growth: PA MD NJ Percent of State's GDP The loss to the U. S. economy is about $482 billion (2. 8% of the U. S. GDP in 2014) which could have been added if the gender pay gap is closed! States and the U. S. can increase their growth rate by 2 to 3% by simply closing the gender pay gap!
Gender Pay Gap and Economic Growth: It adds up! A report by the Mc. Kinsey Global Institute (MGI) • Closing the gender gap can grow the U. S. Economy by $2. 1 trillion in GDP by 2025. • Every state and city in the U. S. can add at least 5% to their GDP. • 1/2 of the U. S. states can add > 10% to their GDP and the 50 largest cities can add 6 – 13%.
Gender Gap and Company’s Profits: Companies with more women on the board of directors perform better financially: 1. Return on Equity (ROE): Companies with the highest % of women board of directors (WBD) outperformed those with the least WBD by 53%. 2. Return on Sales (ROS): Companies with the highest percentages WBD outperformed those with the least WBD by 42%. 3. Return on Invested Capital (ROIC): Companies with the highest percentages of WBD outperformed those with the least by 66%. Source: Catalyst’s Report “The Bottom Line: Corporate Performance and Women’s Representation on Boards. ” 2007.
Is Three a Charm? Catalyst’s report, companies with three or more WBD have : 1. ROE: 16. 7% vs. average of 11. 5% 2. ROS: 16. 8% vs. average of 11. 5% 3. ROIC: 10% vs. average of 6. 2%
Women and the C-Suite Jobs: Mc. Kinsey & Company and Lean. In. org examined responses from 30, 000 employees at 118 companies and found that women are underrepresented in the top management and C-suite jobs. At the current rate, it will take: 25 years to achieve gender parity in SVP jobs More than 100 years to achieve gender parity in the C -suite jobs!
“Stunning lack of women in corporate leadership roles worldwide” CNNMoney. com, February 8, 2016 Peterson Institute for International Economics examined 22, 000 publicly traded companies in 91 countries and found: • About 1/3 of the companies had NO WOMEN on their boards or in any C-suite jobs. • 60% of the companies had NO FEMALE board members. • 50% of the companies had NO FEMALE top executives. • More than 95% of the companies did not have a FEMALE CEO! Companies with at least 30% of their executives as females had HIGHER PROFITS than those with less females.
IWPR State Rankings: Employment and Earnings Rank 1 State DC Grade A Rank 47 State Arkansas Grade F 2 3 4 MD MA NJ B+ B+ B 48 49 50 Mississippi Louisiana Idaho F F F 5 6 CT NY B B 51 West Virginia F 12 23 DE PA B C+
IWPR State Rankings: Poverty and Opportunity Rank 1 2 3 4 5 State Grade DC AMD B+ MA B+ CT B Hawaii B 11 19 NJ DE BC 21 PA C Rank 47 48 49 50 51 State Grade Louisiana DKentucky DWest Virginia DArkansas F Mississippi F
IWPR State Rankings: Health and Well-Being Rank State Grade 1 Minnesota A 47 Arkansas D 2 Hawaii B+ 48 DC F North Dakota 3 B+ 49 Louisiana F 4 Utah B 50 Alabama F 5 Nebraska B 51 Mississippi F 13 26 31 34 NJ MD PA DE C+ C CD+
IWPR State Rankings: Work and Family Rank State Grade 1 VY B 47 Wyoming D 2 CA B 48 Mississippi D 3 DC B 49 Montana F 4 NJ B 50 Utah F 5 Rhode Island B 51 Indiana F 22 25 33 MD DE PA C CD+
Adjusted Gender Pay Gap: According to Glassdoor. com, the F/M earnings ratio is 76%. After controlling for • • • Education Years of experience Job title Employer and location Age The F/M earnings ratio increases to 95%, reducing the gap from 24% to 5%. Other studies found the adjusted pay gap is between 2 to 9%.
Adjusted Gender Pay Gap by Industry, Glassdoor 2016 Aerospace & Defense Agriculture & Forestry Biotech & Pharmaceuticals Travel & Tourism Restaurants, Bars & Food Services Education Manufacturing Accounting & Legal Consumer services Telecommunications Government Business services Oil, Gas, Energy & Utilities Non-profit Real estate Information technology Construction, Repair & Maintenance Retail Finance Arts, Entertainment & Recreation Media Transportation & Logistics Mining & Metals Insurance Healthcare 91, 8 97, 5 97 97 96, 8 96, 7 96 95, 5 95, 4 95, 3 94, 5 94, 4 94, 3 94, 2 94, 1 93, 6 93, 4 93, 3 93, 2 92, 8 93, 8 94, 8 95, 8 96, 8 97, 8
Gendered Phrases in Job Posts and Gender Hire: The Use of Gendered Phrases in Job Posts Predicts Gender Hire 4, 6 5, 2 2, 8 2, 7 Average number of gender-biased phrases in job listings that resulted in a male hire in a female hire Feminine Phrases Masculine Phrases
Gender Bias: • Women get interrupted more often than men. • Women are asked more challenging questions than men. • Women’s statements are questioned more often than men’s.
The Call to Action • Raise awareness • Promote transparency • Offer coaching http: //blog. bluefrogdm. com/Blog/bid/311729/7 -Techniques-for-an-Effective-Call-to-Action
Raise Awareness • • 70 vs. 12 (Mc. Kinsey) Track metrics Set gender targets Assess organizational attitudes http: //www. intelligentinsurer. com/article/closing-the-gaps
Promote Transparency • Permission and confidence • “Salary negotiable” in ads • Process for pay determination • https: //www. linkedin. com/pulse/whats-usually-negotiable-job-offer-freeman-bs-che-ms-chem-mba
Offer Coaching • Mentors • Provide male sponsorships • Negotiation workshops http: //www. intelligentinsurer. com/article/closing-the-gaps
A Caution • The iron law of responsibility. . . https: //leaderful. wordpress. com/2013/07/15/the-iron-law-of-responsibility/ http: //www. ohsinc. com/info/state-drug-testing-laws/
No Joking Matter • $1. 7 million https: //wfmu. org/playlists/shows/34912
The State of the Gap and You • What will you do to mind the gap? http: //www. huffingtonpost. ca/2016/03/08/canada-gender-pay-gap_n_9393924. html
Thank you! • raouff@gbc. edu • buhlerp@gbc. edu