Are the 6 Physical Functioning Items in the


 • 58% female • 57% high school")
 (1/3) (1/5) (1/7) (1/9) (1/10) (1/16)")
 0. 71 Chairs (0, 1, 2) 0. 80")

 • Coefficient alpha = 0. 92 (MSbms – MSems)/MSbms")
 Dressing Eating Bathing *Estimated correlation between two underlying normally")


 / Info Reliability = 0. 90")
 IRT graded response model estimates relationship between a person’s response")


 2004 www. nihpromis. org 23")

 Men Women Location DIF White Slope DIF AA I cry")


 Physical Functioning 1 st Threshold Unable to do 2")


- Slides: 31
Are the 6 Physical Functioning Items in the CAHPS Medicare Survey Informative? Ron D. Hays, Ph. D. UCLA Department of Medicine March 17, 2016 12 noon – 1 pm Live Streaming Webinar With Audio: Uclahealth. webex. com Meeting Number: 802702422 Meeting Password: uclagim 1
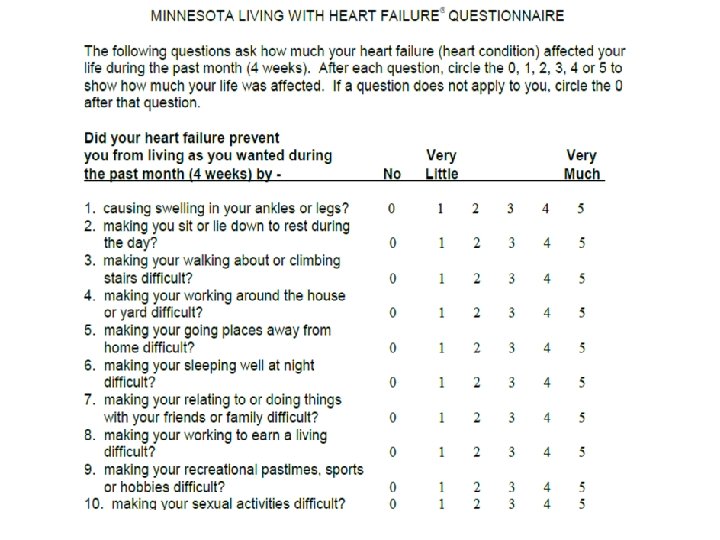
Physical Functioning • Able to do a range of activities from basic (e. g. , self-care) to advanced (e. g. , running) • Six physical functioning items included in the 2010 Consumer Assessment of Healthcare Providers and Systems (CAHPS®) Medicare Survey
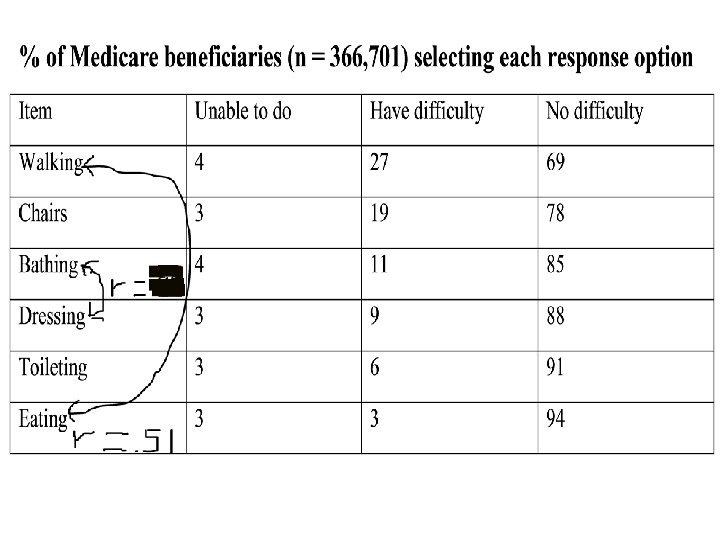
Because of a health or physical problem are you unable to do or have any difficulty doing the following activities? • • • Walking? Getting in or out of chairs? Bathing? Dressing? Using the toilet? Eating? – I am unable to do this activity (0) – Yes, I have difficulty (1) – No, I do not have difficulty (2)
Medicare beneficiary sample (n = 366, 701) • 58% female • 57% high school education or less • 14% 18 -64; 48% 65 -74, 29% 75 -84, 9% 85+
(Some difficulty) (1/3) (1/5) (1/7) (1/9) (1/10) (1/16)
Item-Scale Correlations Walking (0, 1, 2) 0. 71 Chairs (0, 1, 2) 0. 80 Bathing (0, 1, 2) 0. 83 Dressing (0, 1, 2) 0. 86 Toileting (0, 1, 2) 0. 84 Eating 0. 75 (0, 1, 2)
Reliability Formulas Model Reliability Intraclass Correlation Two-way random Twoway mixed Oneway BMS = Between Ratee Mean Square N = n of ratees WMS = Within Mean Square k = n of items or raters JMS = Item or Rater Mean Square EMS = Ratee x Item (Rater) Mean Square 8
Internal Consistency Reliability (Coefficient Alpha) • Coefficient alpha = 0. 92 (MSbms – MSems)/MSbms • Ordinal alpha = 0. 98 – http: //support. sas. com/resources/papers/proceeding s 14/2042 -2014. pdf – http: //gim. med. ucla. edu/Faculty. Pages/Hays/utils/
Confirmatory Factor Analysis (Polychoric* Correlations) Dressing Eating Bathing *Estimated correlation between two underlying normally distributed continuous variables Walking Chairs Toileting Residual correlations <= 0. 04
11
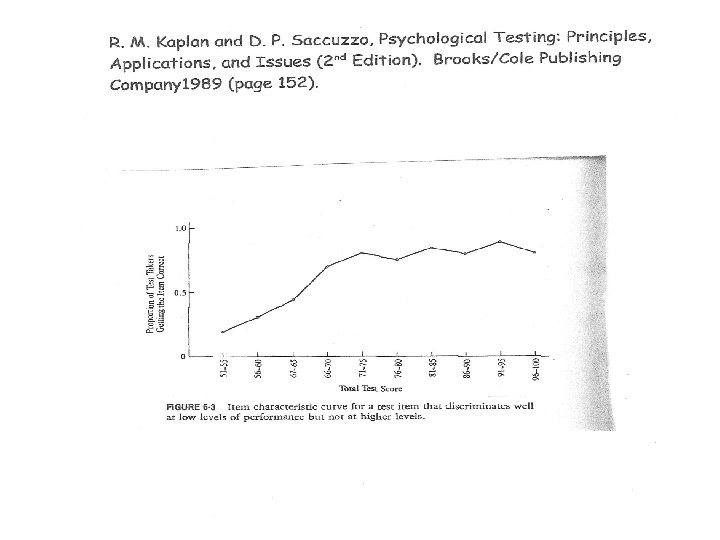
Item Characteristic Curves Unable to do Have difficulty Unable to do I do not have difficulty Unable to do Have difficulty I do not have difficulty Have difficulty
Item Characteristic Curve for Emotional Health Scale Very little No Very much Very little No Very much
Simple-summated Scoring of Physical Functioning Scale • I am unable to do this activity (0) • Yes, I have difficulty (1) • No, I do not have difficulty (2) • Possible 6 -item scale range: 0 -12 – Mean = 11 (2% floor, 65% ceiling) 16
Unable to do Have difficulty
Reliability = (Info – 1) / Info Reliability = 0. 90
Item Response Theory (IRT) IRT graded response model estimates relationship between a person’s response Yi to the question (i) and his or her level on the latent construct ( ): bik estimates how difficult it is to have a score of k or more on item (i). ai estimates item discrimination.
People and Items on Same z-score metric Person 1 -3 Item 1 Person 2 Person 3 0 Item 2 3 Item 3
-3 -3 00 3
is mainstreaming • BIGSTEPS and WINSTEPS • PARSCALE and MULTILOG • IRTPRO and FLEXMIRT • SAS and STATA
Computer Adaptive Testing (CAT) 2004 www. nihpromis. org 23
Reliability Target for Use of Measures with Individuals § z-score (mean = 0, SD = 1) § Reliability ranges from 0 -1 § 0. 90 or above is goal § SE = SD (1 - reliability)1/2 § Reliability = 1 – SE 2 § Reliability = 0. 90 when SE = 0. 32 § 95% CI = true score +/- 1. 96 x SE (CI = -0. 63 z-score when reliability = 0. 90) 24
DIF (2 -parameter model) Men Women Location DIF White Slope DIF AA I cry when upset I get sad for no reason Higher Score = More Depressive Symptoms 25
Person Fit • Large negative ZL values indicate misfit. • One person in PROMIS project had ZL = -3. 13 • This person reported that they could do 13 physical functioning activities (including running 5 miles) without any difficulty, but – This person reported a little difficulty being out of bed for most of the day. 26
IRT Distortions • “Parameter values are identical in separate subgroups or across different measurement conditions. ” – It is the often misunderstood feature of parameter invariance that is frequently cited in introductory or advanced texts” (Rupp & Zumbo, 2006).
Item Parameters (Graded Response Model) Physical Functioning 1 st Threshold Unable to do 2 nd Threshold Have difficulty Slope (Discrimination) Walking -1. 86 -0. 55 4. 63 Chairs -1. 91 -0. 81 5. 65 Bathing -1. 72 -1. 02 6. 34 Dressing -1. 78 -1. 10 8. 23 Toileting -1. 87 -1. 27 7. 23 Eating -1. 98 -1. 53 4. 87
Interval-Level? • “Modern day psychometric analyses such as Rasch analysis convert ordinal data to an interval scale so that response scores meet the criteria for measurement” • Correlation (product-moment and ICC) between simple-summated scoring and IRT estimated score for physical functioning = 0. 91
Ben Wright or Been Wrong? • “Application of the Rasch model to the data set estimates a measure that can be considered valid. ” • The “Rasch model is the only valid approach to measurement” – Bergan, 2013, Rasch versus Birnbaum: New arguments in an old debate (p. 3)
Questions? http: //gim. med. ucla. edu/Faculty. Pages/Hays/ Hays, R. D. , Mallett, J. S. , Gaillot, S. , & Elliott, M. N. (2015 ). Performance of the Medicare Consumer Assessment of Healthcare Providers and Systems (CAHPS®) Physical Functioning Items. Medical Care, 54, 205 -209