Arctic RIMS WALE Regional Integrated Hydrological Monitoring System
")
")
")


 C sink (-)")
")

 C sink (-)")

 on May 25, 2003 Land surface")


 depicted by")

- Slides: 17
Arctic RIMS & WALE (Regional, Integrated Hydrological Monitoring System & Western Arctic Linkage Experiment) John Kimball Faith. Ann Heinsch Steve Running http: //wale. unh. edu/ NTSG Univ. of Montana March 28, 2006 http: //rims. unh. edu/data. shtml
Arctic RIMS & WALE (Regional, Integrated Hydrological Monitoring System & Western Arctic Linkage Experiment) Biome-BGC v. 4. 1. 2 Inputs (25 -km resolution): • Meteorology – NCEP, 1980 -2002 http: //wale. unh. edu/ • Elevation – GTOPO • Soils – FAO Soil Texture – Rooting Depth http: //rims. unh. edu/data. shtml
Arctic RIMS & WALE (Regional, Integrated Hydrological Monitoring System & Western Arctic Linkage Experiment) Biome-BGC Land Covers: • • C 3 Grass Deciduous Broadleaf Forest Deciduous Needleleaf Forest Boreal Evergreen Needleleaf Forest • Sedge (moist) Tundra • Tussock (dry) Tundra)
Biome-BGC Tundra Ecophysiology Parameter C 3 Grass Tussock Tundra Sedge Tundra Whole Plant Mortality Fraction 0. 05 0. 01 Fire Mortality Fraction 0. 01 0. 002 New fine root C : New leaf C 2. 0 2. 5 1. 5 C: N of leaves 28. 1 30. 0 25. 0 C: N of leaf litter, after translocation 45. 8 91. 7 33. 5 C: N of fine roots 50. 0 37. 0 Leaf litter labile /cellulose/lignin proportion 0. 39 / 0. 44 / 0. 17 0. 51 / 0. 44 / 0. 05 Fine root labile /cellulose/lignin proportion 0. 68 / 0. 23 / 0. 09 0. 30 / 0. 45 / 0. 25 0. 80 / 0. 12 / 0. 08 Canopy water interception coeff. 0. 01 0. 021 Canopy light extinction coeff. 0. 48 0. 6 Specific leaf area 65. 0 45 Fraction of leaf N in Rubisco 0. 32 0. 20 Maximum stomatal conductance 0. 006 0. 005 Cuticular conductance 0. 00006 0. 00001 Leaf water potential: start of / complete conductance reduction -0. 73 / -2. 70 -0. 7 / -3. 5 VPD: start of / complete conductance reduction 1000 / 5000 930 / 4100
Wetland-BGC • Has a 2 -layer soil model: – Unsaturated & saturated layers – Dynamic changes (3 cases) • No saturation of rooting depth • Partial saturation of rooting depth • Total saturation of rooting depth • Provides water from saturated layer using capillary rise function from latest version of RHESSys (based on principles of hydraulic conductivity & depth to saturation) • At present, only affects carbon pools
NEE: Biome-BGC vs. Tower, Barrow, AK 2000 2001 C source (+) C sink (-)
Wet Sedge Tundra: Barrow, AK, 1995 Varying Groundwater Depth (gwd)
NPP and Soil Carbon, Barrow Tower
Biome-BGC Results Barrow Atqasuk C source (+) C sink (-)
Conclusions • Spatial and temporal patterns of tundra NEE and component photosynthetic and respiration processes are strongly regulated by soil moisture. • Interannual variability in vegetation productivity and net C exchange is on the order of 99% ( 15. 9 g. C m-2 y-1) and 19% ( 37. 3 g. C m-2 y-1), respectively. • Soil heterotrophic respiration is a large component of pan-Arctic NEE. • Moderate decreases in groundwater depth promote soil decomposition and respiration during the growing season, but increased respiration is partially offset by increased vegetation productivity. • The tundra carbon cycle response to climate change appears to be non-linear and strongly coupled to surface hydrology and nitrogen availability.
AMSRE 6. 9 GHz Land Surface Temperature (LUT) on May 25, 2003 Land surface temperature derived using AMSR-E 6. 9 GHz H and V Polarization. We also have compared the differences among different approaches and channels and MODIS Aqua LST, The atmospheric effect, in emissivity vary differently depending on the channels. In the arctic environment, the upper layers of soil are frozen, and thermal inertia of below-ground (permafrost) effect develops low soil temperature. Our model produces reliable soil temperature using microwave data. AMSR-E 6. 9 and 36. 6 GHz channels are sensitive to temperature change.
Soil temperature comparison at Barrow for 2003 (Fily approach, AMSRE 6. 9 GHz, 8 -day average)
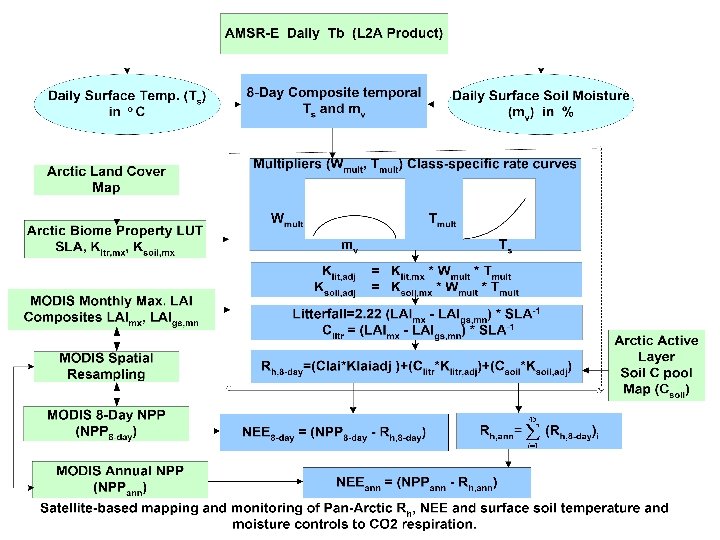
AMSR-E Maximum Soil Moisture during 2002 -04 Daily surface moisture and surface temperature derived from satellite microwave remote sensing are used as the primary controls to Rh. The map shows maximum surface moisture during 2002– 04 for the pan-Arctic domain, as derived from AMSR-E L 3 daily C- and X-band data.
Comparative carbon source/sink among the model estimated using MODIS and AMSR-E data, Northern Black Spruce Ameriflux tower site-observed data and BIOME-BGC model calculated using local meteorology data for 2003.
SSM/I-derived timing of spring thaw and annual C cycle anomalies (1988– 2001) depicted by the regional ecosystem process model (Biome-BGC) simulations of NEE for Alaska.
Biome-BGC Model Derived Daily NEE June 26, 2003 The microwave derived surface temperature and soil moisture used to estimate NEE at the boreal-Arctic region and validated using flux tower sites and RIIMS 25 km meteorology. The map shows pan-Arctic daily NEE on June 26, 2003.