Architecture System Performance Performance NOT always critical to
- Slides: 16

Architecture & System Performance

Performance • NOT always critical to a project – At least 80% of the slow code in the world is NOT WORTH SPEEDING UP • But for the other 20%, performance is – Hard to manage – Really hard to fix after the fact! • The architect is the first person to impact performance!

If you remember only one thing You cannot control what you cannot measure. You cannot manage what you cannot quantify.

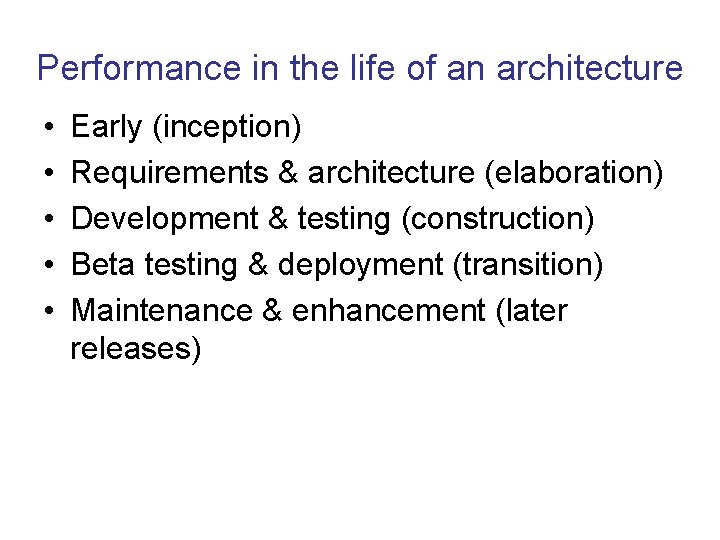
Performance in the life of an architecture • • • Early (inception) Requirements & architecture (elaboration) Development & testing (construction) Beta testing & deployment (transition) Maintenance & enhancement (later releases)

Inception Focus: get the basic parameters • Size • Speed • Cost • System boundary

Elaboration Focus: validate the architecture with respect to performance, capacity, and hardware cost • Define performance & capacity related quality attribute scenarios • Establish engineering parameters, including – Safety margins – Utilization limits • Begin analytical modeling – Spreadsheet models work best at this stage • Establish resource budgets • Measure early and often – Hardware characteristics – Performance of prototypes for major risk items

Resource budgets • Architecture team translates system-wide numbers into targets that make sense to developers and testers working on modules or sub-systems • Critically dependent on scenario frequencies • Good example of an allocation view • Resources that can be budgeted include: – – – CPU time Elapsed time Disk accesses Network traffic Memory utilization

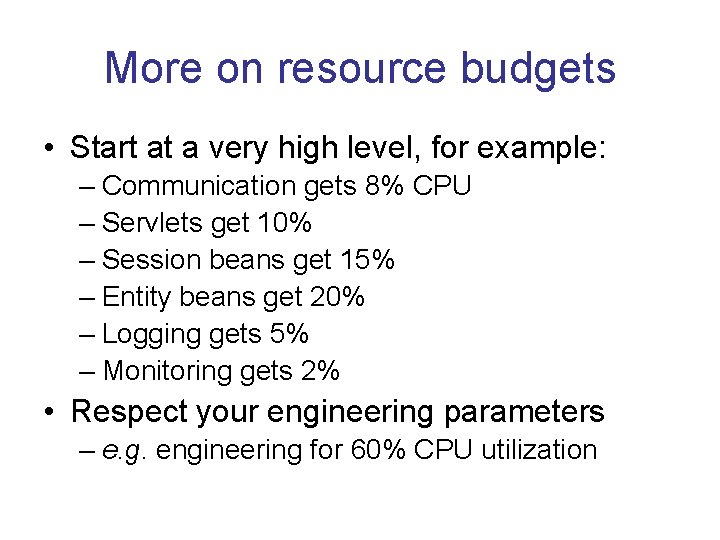
More on resource budgets • Start at a very high level, for example: – Communication gets 8% CPU – Servlets get 10% – Session beans get 15% – Entity beans get 20% – Logging gets 5% – Monitoring gets 2% • Respect your engineering parameters – e. g. engineering for 60% CPU utilization

Resource budgets - 3 • Refine the budget as you learn more – About expected resource consumption by subsystem by scenario – About scenario frequencies – About platform capacity • Hardware • Database • Middleware • The goal: answer the developers’ and testers’ question: how fast is fast enough?

Construction Focus: monitor as-built performance & capacity vs as-designed • Measure, measure, and measure some more – Replace assumed parameters with measurements as they become available • Refine models – As system matures, queuing models improve in accuracy and usefulness • Adjust budgets as needed

Transition Focus: improvement of models • Keep on measuring • Stress test • Identify and deal with problems

Maintenance and Enhancement Focus: predict impact of potential changes • Spreadsheet models forecasting effects on throughput • Queuing models forecasting effects on response time

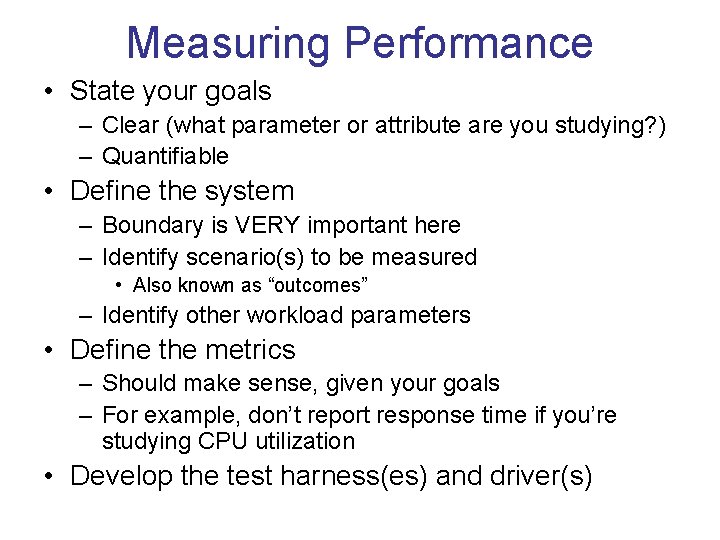
Measuring Performance • State your goals – Clear (what parameter or attribute are you studying? ) – Quantifiable • Define the system – Boundary is VERY important here – Identify scenario(s) to be measured • Also known as “outcomes” – Identify other workload parameters • Define the metrics – Should make sense, given your goals – For example, don’t report response time if you’re studying CPU utilization • Develop the test harness(es) and driver(s)

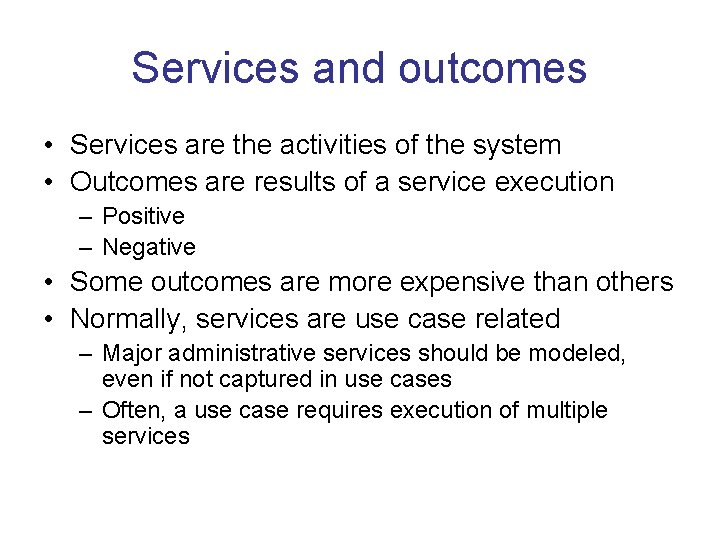
Services and outcomes • Services are the activities of the system • Outcomes are results of a service execution – Positive – Negative • Some outcomes are more expensive than others • Normally, services are use case related – Major administrative services should be modeled, even if not captured in use cases – Often, a use case requires execution of multiple services

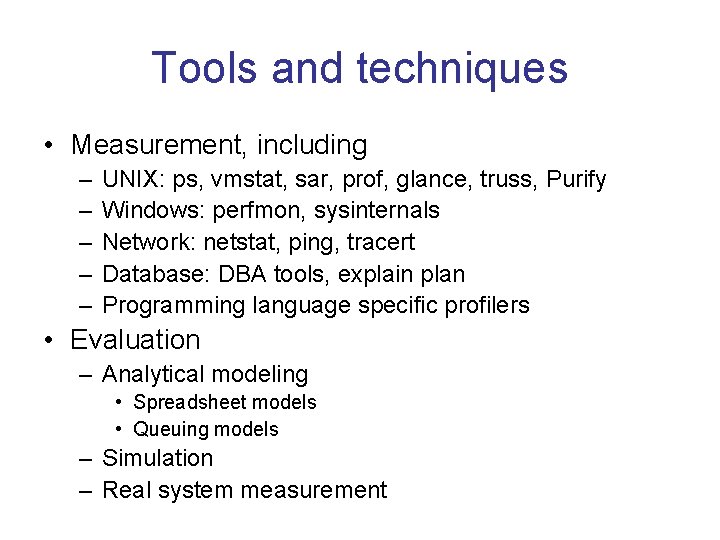
Tools and techniques • Measurement, including – – – UNIX: ps, vmstat, sar, prof, glance, truss, Purify Windows: perfmon, sysinternals Network: netstat, ping, tracert Database: DBA tools, explain plan Programming language specific profilers • Evaluation – Analytical modeling • Spreadsheet models • Queuing models – Simulation – Real system measurement

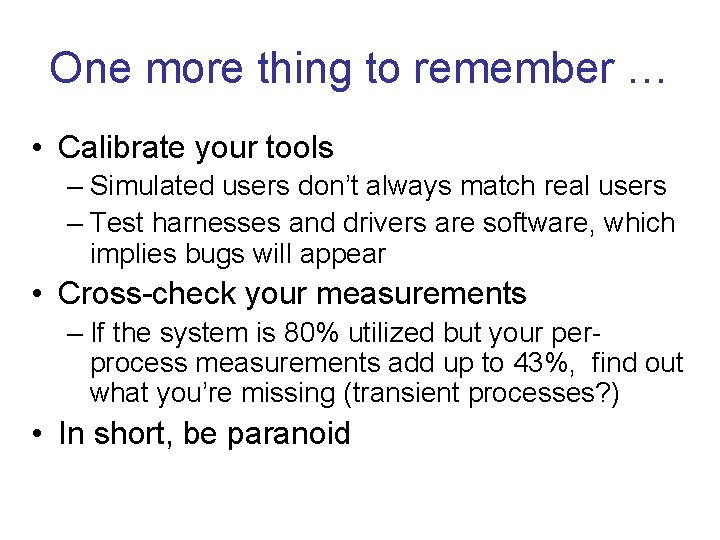
One more thing to remember … • Calibrate your tools – Simulated users don’t always match real users – Test harnesses and drivers are software, which implies bugs will appear • Cross-check your measurements – If the system is 80% utilized but your perprocess measurements add up to 43%, find out what you’re missing (transient processes? ) • In short, be paranoid