Architecting For Performance Matt Henderson Principal Solutions Architect




- Slides: 21

Architecting For Performance Matt Henderson: Principal Solutions Architect 1

Agenda § How SQL Server uses data & CPUs § Architectural best practices § What to look for § Monitoring tools & techniques § What could be… 2

Architecture 101: Balance § Architect for balance § Bottleneck should be most expensive piece § Imbalance wastes resources and $$$ § Software costs > hardware costs § Software licensed by CPUs 3

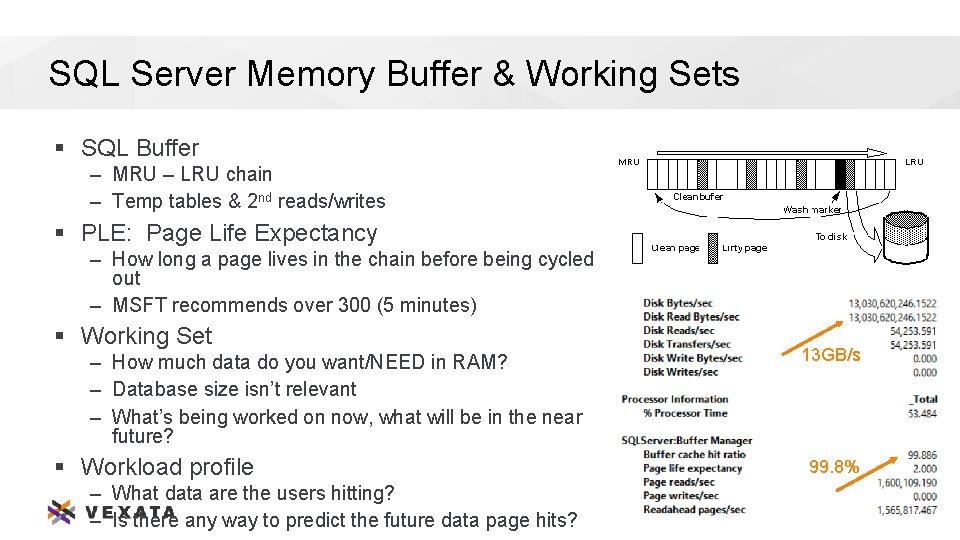
SQL Server Memory Buffer & Working Sets § SQL Buffer – MRU – LRU chain – Temp tables & 2 nd reads/writes § PLE: Page Life Expectancy – How long a page lives in the chain before being cycled out – MSFT recommends over 300 (5 minutes) § Working Set – How much data do you want/NEED in RAM? – Database size isn’t relevant – What’s being worked on now, what will be in the near future? § Workload profile – What data are the users hitting? – Is there any way to predict the future data page hits? 13 GB/s 99. 8% 4

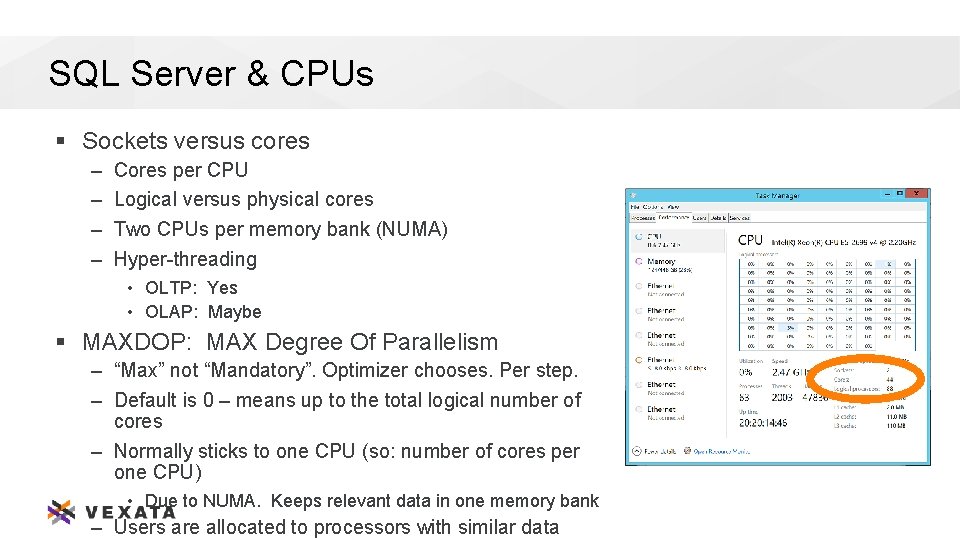
SQL Server & CPUs § Sockets versus cores – – Cores per CPU Logical versus physical cores Two CPUs per memory bank (NUMA) Hyper-threading • OLTP: Yes • OLAP: Maybe § MAXDOP: MAX Degree Of Parallelism – “Max” not “Mandatory”. Optimizer chooses. Per step. – Default is 0 – means up to the total logical number of cores – Normally sticks to one CPU (so: number of cores per one CPU) • Due to NUMA. Keeps relevant data in one memory bank – Users are allocated to processors with similar data 5

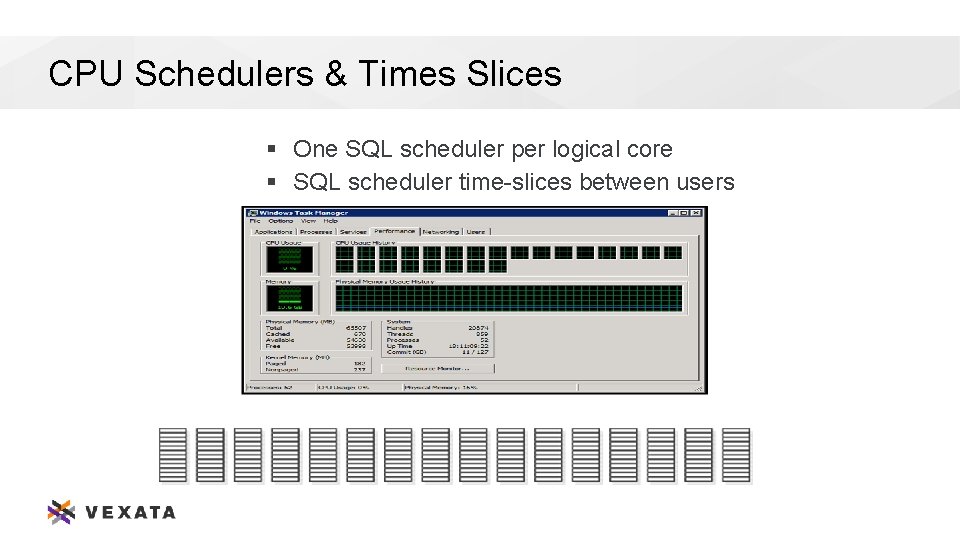
CPU Schedulers & Times Slices § One SQL scheduler per logical core § SQL scheduler time-slices between users 6

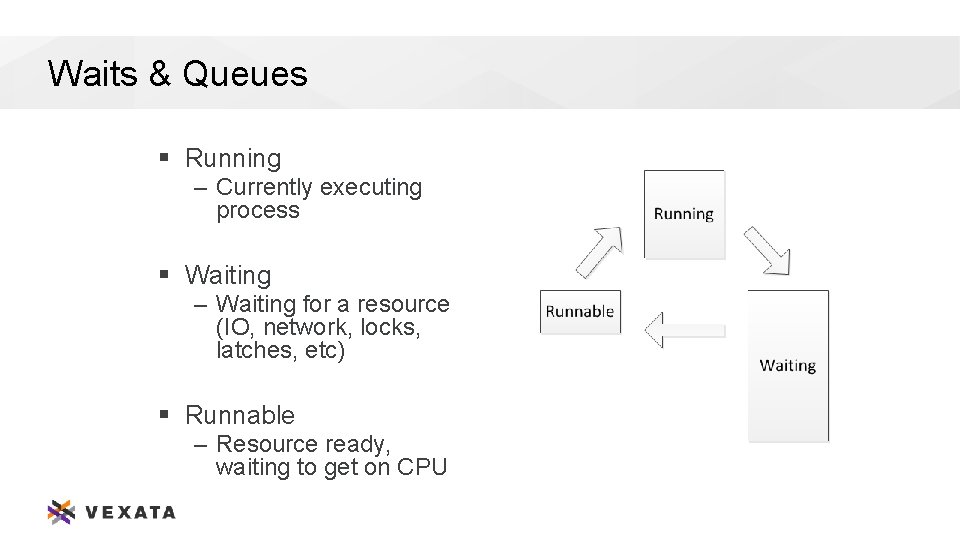
Waits & Queues § Running – Currently executing process § Waiting – Waiting for a resource (IO, network, locks, latches, etc) § Runnable – Resource ready, waiting to get on CPU 7

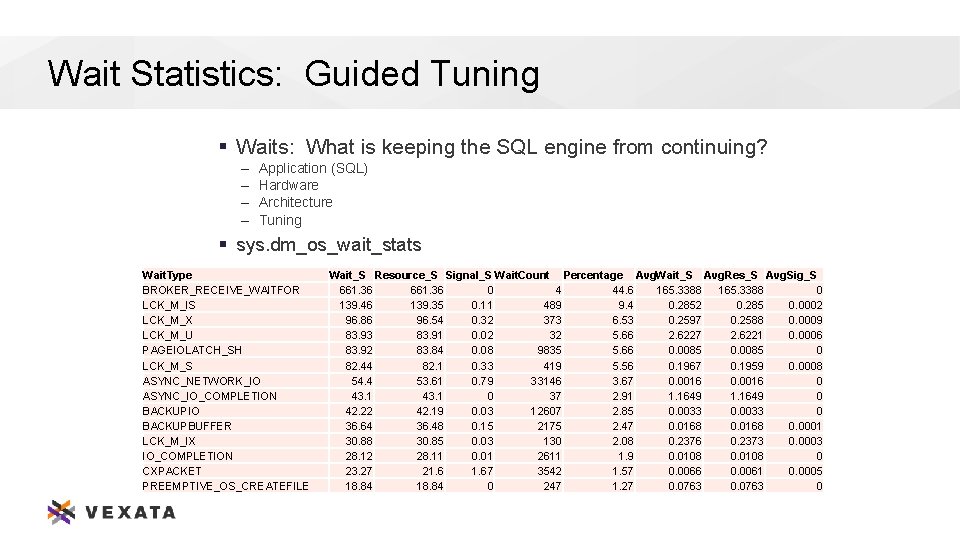
Wait Statistics: Guided Tuning § Waits: What is keeping the SQL engine from continuing? ‒ ‒ Application (SQL) Hardware Architecture Tuning § sys. dm_os_wait_stats Wait. Type BROKER_RECEIVE_WAITFOR LCK_M_IS LCK_M_X LCK_M_U PAGEIOLATCH_SH LCK_M_S ASYNC_NETWORK_IO ASYNC_IO_COMPLETION BACKUPIO BACKUPBUFFER LCK_M_IX IO_COMPLETION CXPACKET PREEMPTIVE_OS_CREATEFILE Wait_S Resource_S Signal_S Wait. Count Percentage Avg. Wait_S Avg. Res_S Avg. Sig_S 661. 36 0 4 44. 6 165. 3388 0 139. 46 139. 35 0. 11 489 9. 4 0. 2852 0. 285 0. 0002 96. 86 96. 54 0. 32 373 6. 53 0. 2597 0. 2588 0. 0009 83. 93 83. 91 0. 02 32 5. 66 2. 6227 2. 6221 0. 0006 83. 92 83. 84 0. 08 9835 5. 66 0. 0085 0 82. 44 82. 1 0. 33 419 5. 56 0. 1967 0. 1959 0. 0008 54. 4 53. 61 0. 79 33146 3. 67 0. 0016 0 43. 1 0 37 2. 91 1. 1649 0 42. 22 42. 19 0. 03 12607 2. 85 0. 0033 0 36. 64 36. 48 0. 15 2175 2. 47 0. 0168 0. 0001 30. 88 30. 85 0. 03 130 2. 08 0. 2376 0. 2373 0. 0003 28. 12 28. 11 0. 01 2611 1. 9 0. 0108 0 23. 27 21. 67 3542 1. 57 0. 0066 0. 0061 0. 0005 18. 84 0 247 1. 27 0. 0763 0 8

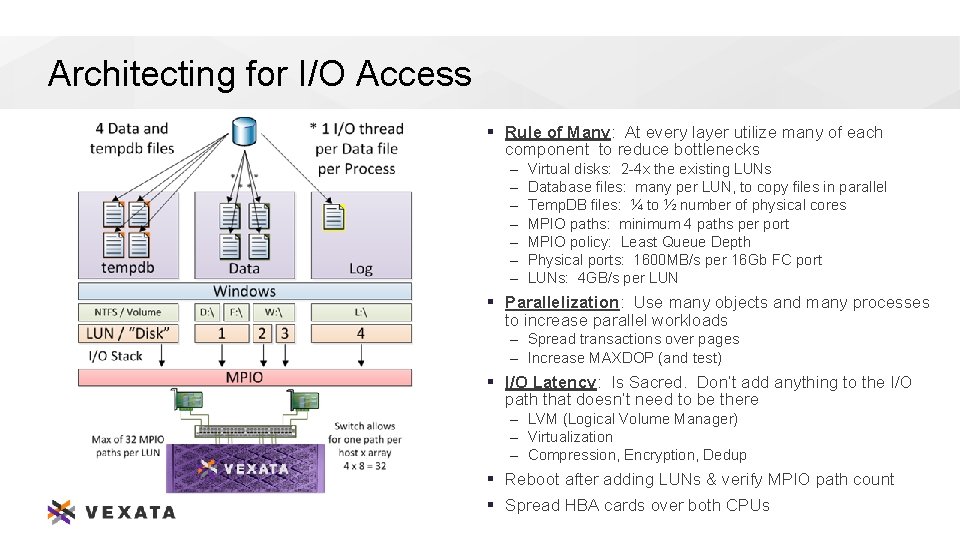
Architecting for I/O Access § Rule of Many: At every layer utilize many of each component to reduce bottlenecks ‒ ‒ ‒ ‒ Virtual disks: 2 -4 x the existing LUNs Database files: many per LUN, to copy files in parallel Temp. DB files: ¼ to ½ number of physical cores MPIO paths: minimum 4 paths per port MPIO policy: Least Queue Depth Physical ports: 1600 MB/s per 16 Gb FC port LUNs: 4 GB/s per LUN § Parallelization: Use many objects and many processes to increase parallel workloads ‒ Spread transactions over pages ‒ Increase MAXDOP (and test) § I/O Latency: Is Sacred. Don’t add anything to the I/O path that doesn’t need to be there ‒ LVM (Logical Volume Manager) ‒ Virtualization ‒ Compression, Encryption, Dedup § Reboot after adding LUNs & verify MPIO path count § Spread HBA cards over both CPUs 9

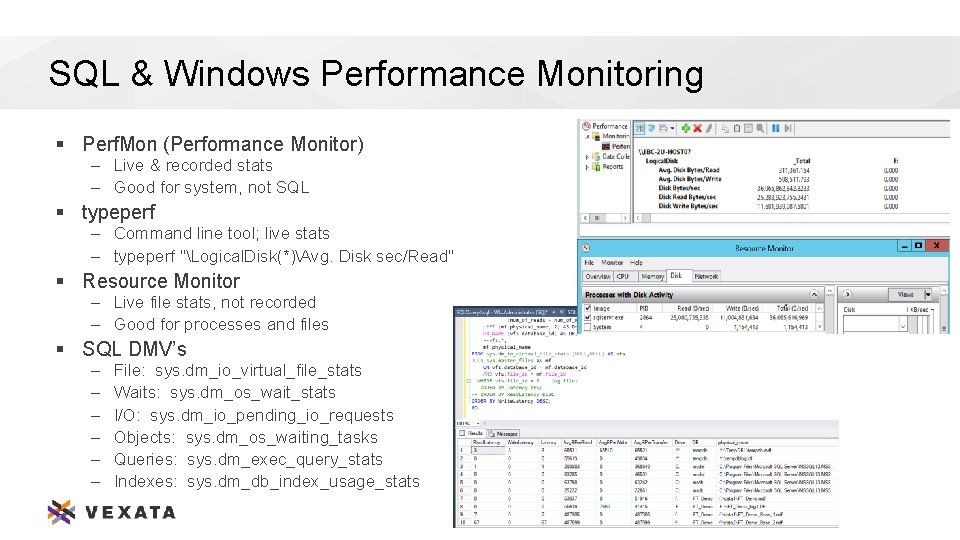
SQL & Windows Performance Monitoring § Perf. Mon (Performance Monitor) – Live & recorded stats – Good for system, not SQL § typeperf – Command line tool; live stats – typeperf "Logical. Disk(*)Avg. Disk sec/Read" § Resource Monitor – Live file stats, not recorded – Good for processes and files § SQL DMV’s – – – File: sys. dm_io_virtual_file_stats Waits: sys. dm_os_wait_stats I/O: sys. dm_io_pending_io_requests Objects: sys. dm_os_waiting_tasks Queries: sys. dm_exec_query_stats Indexes: sys. dm_db_index_usage_stats 10

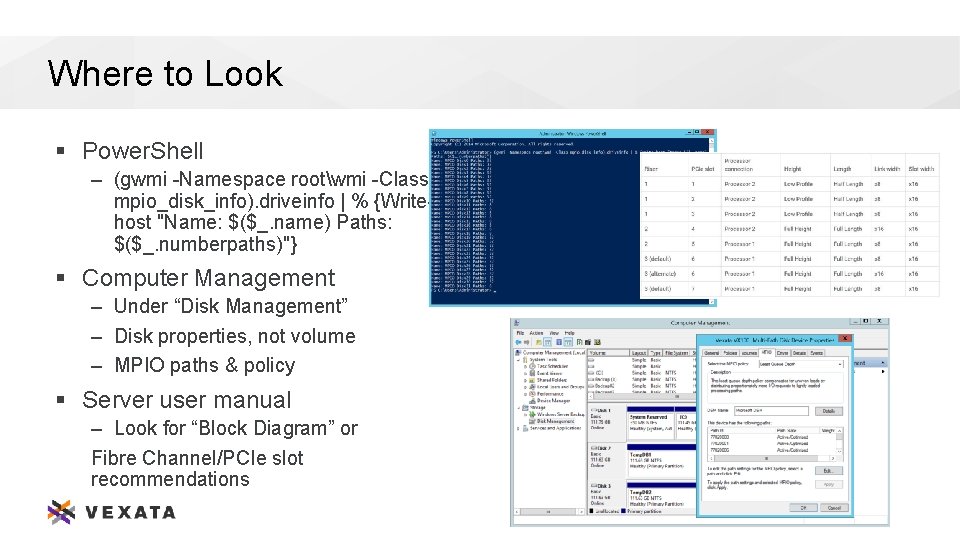
Where to Look § Power. Shell – (gwmi -Namespace rootwmi -Class mpio_disk_info). driveinfo | % {Writehost "Name: $($_. name) Paths: $($_. numberpaths)"} § Computer Management – Under “Disk Management” – Disk properties, not volume – MPIO paths & policy § Server user manual – Look for “Block Diagram” or Fibre Channel/PCIe slot recommendations 11

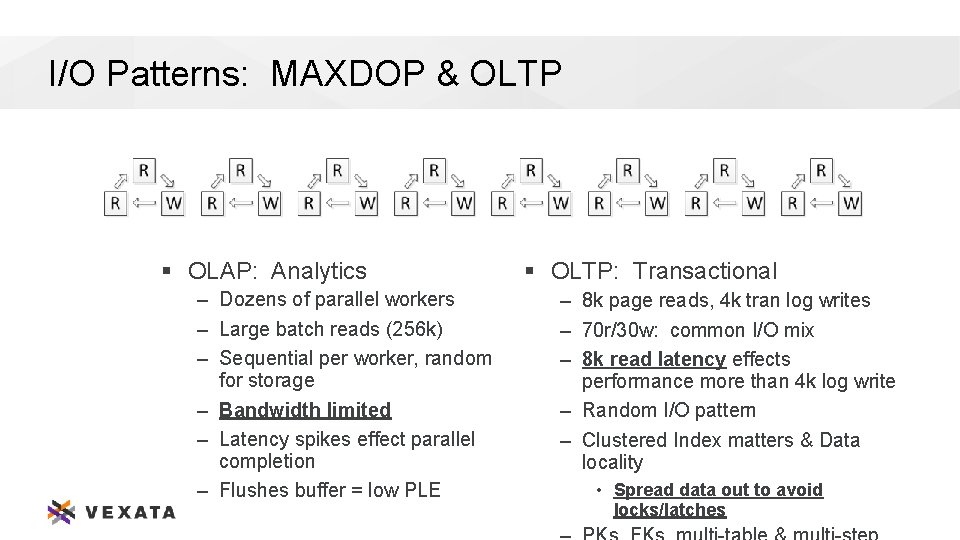
I/O Patterns: MAXDOP & OLTP § OLAP: Analytics – Dozens of parallel workers – Large batch reads (256 k) – Sequential per worker, random for storage – Bandwidth limited – Latency spikes effect parallel completion – Flushes buffer = low PLE § OLTP: Transactional – 8 k page reads, 4 k tran log writes – 70 r/30 w: common I/O mix – 8 k read latency effects performance more than 4 k log write – Random I/O pattern – Clustered Index matters & Data locality • Spread data out to avoid locks/latches 12

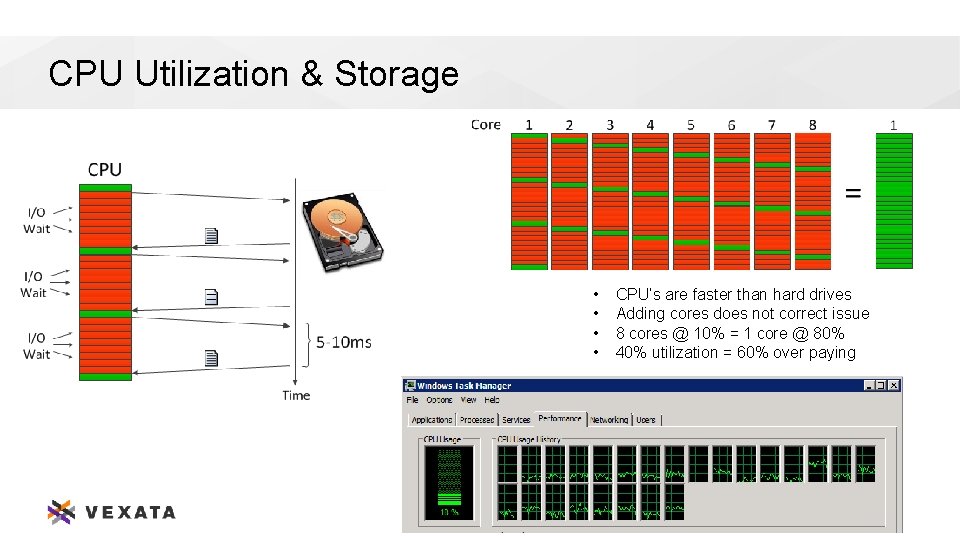
CPU Utilization & Storage • • CPU’s are faster than hard drives Adding cores does not correct issue 8 cores @ 10% = 1 core @ 80% 40% utilization = 60% over paying 13

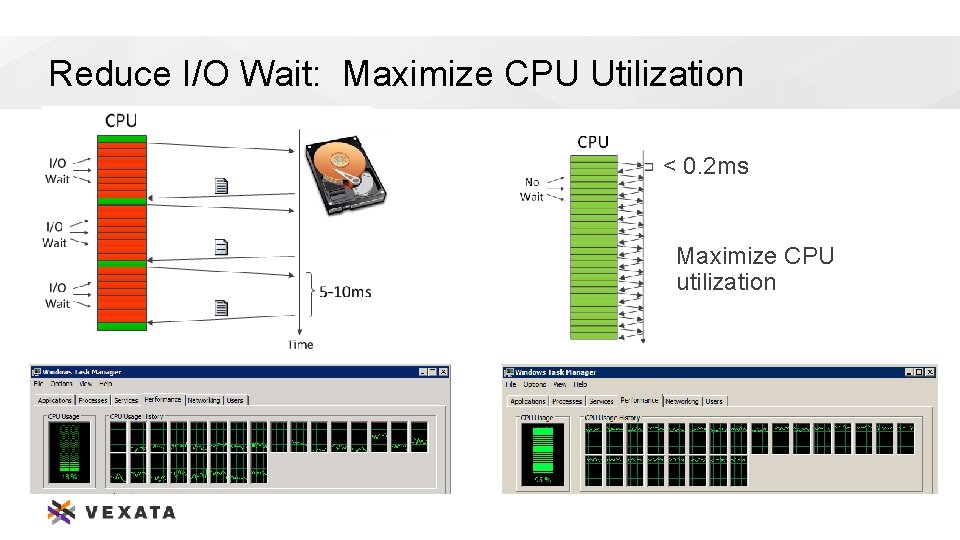
Reduce I/O Wait: Maximize CPU Utilization < 0. 2 ms Maximize CPU utilization 14

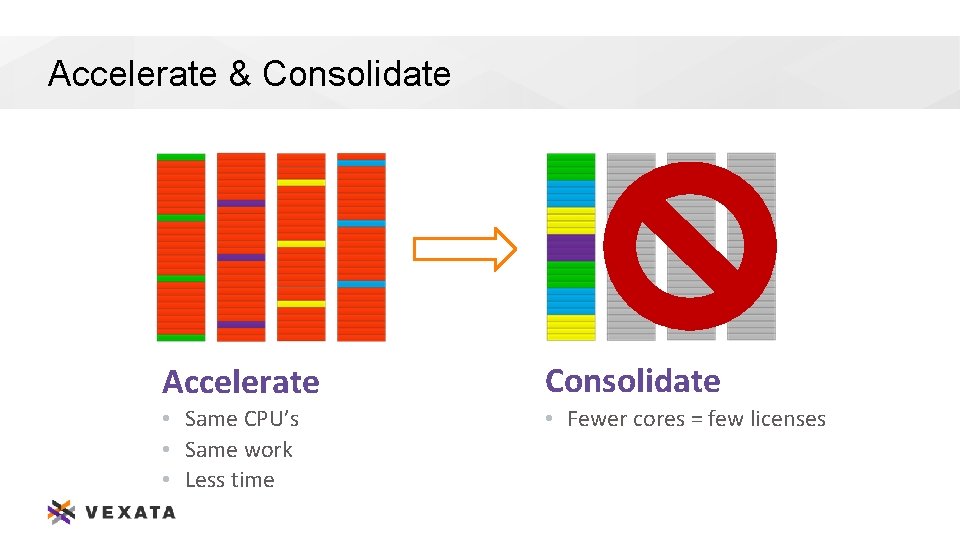
Accelerate & Consolidate Accelerate Consolidate • Same CPU’s • Same work • Less time • Fewer cores = few licenses 15

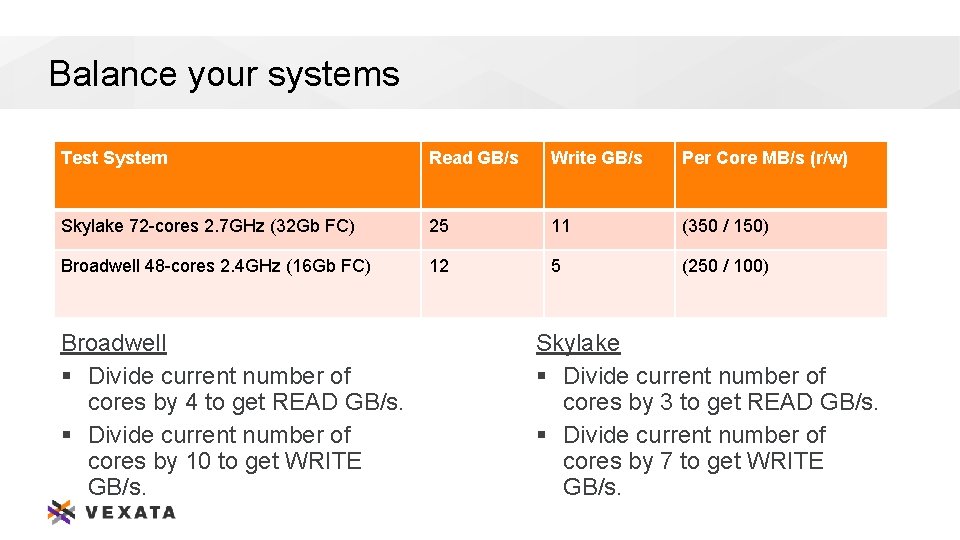
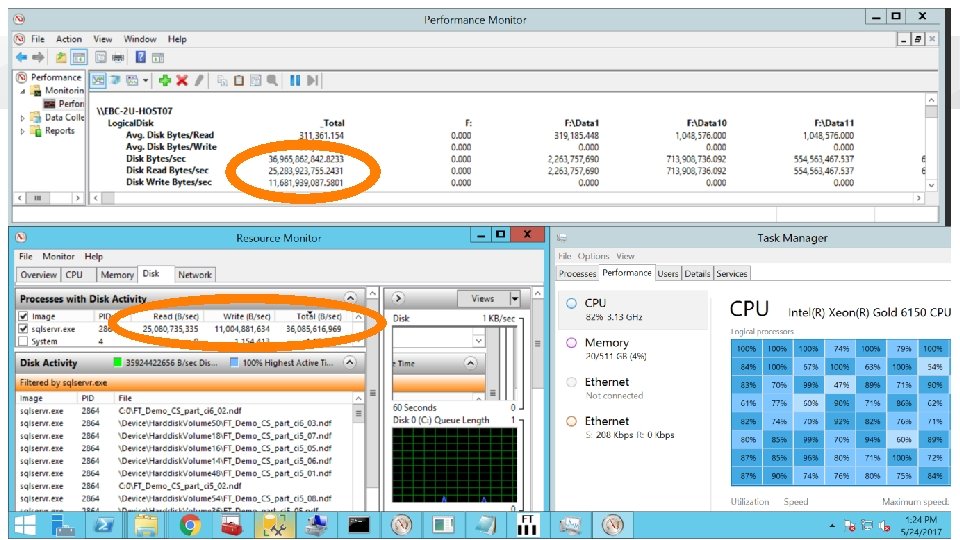
Balance your systems Test System Read GB/s Write GB/s Per Core MB/s (r/w) Skylake 72 -cores 2. 7 GHz (32 Gb FC) 25 11 (350 / 150) Broadwell 48 -cores 2. 4 GHz (16 Gb FC) 12 5 (250 / 100) Broadwell § Divide current number of cores by 4 to get READ GB/s. § Divide current number of cores by 10 to get WRITE GB/s. Skylake § Divide current number of cores by 3 to get READ GB/s. § Divide current number of cores by 7 to get WRITE GB/s. 16

17

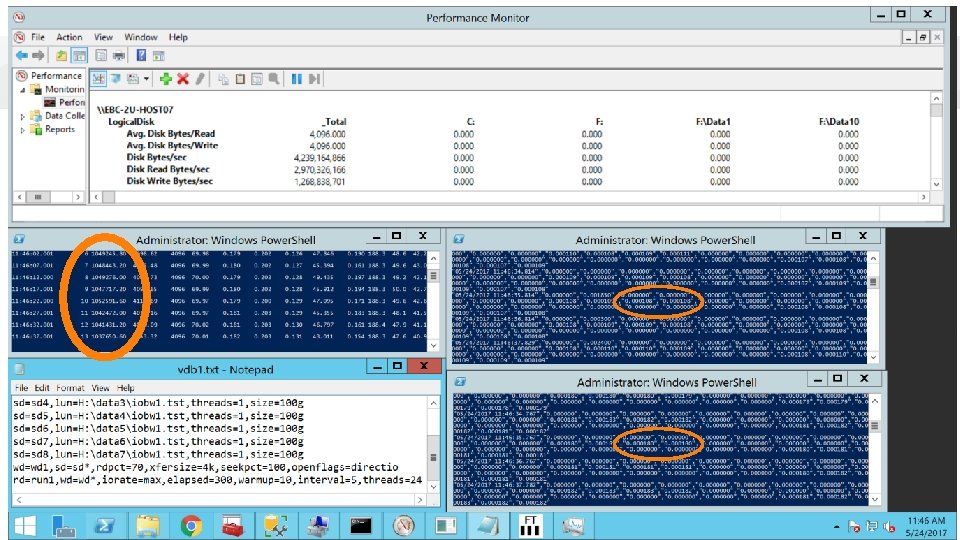
18

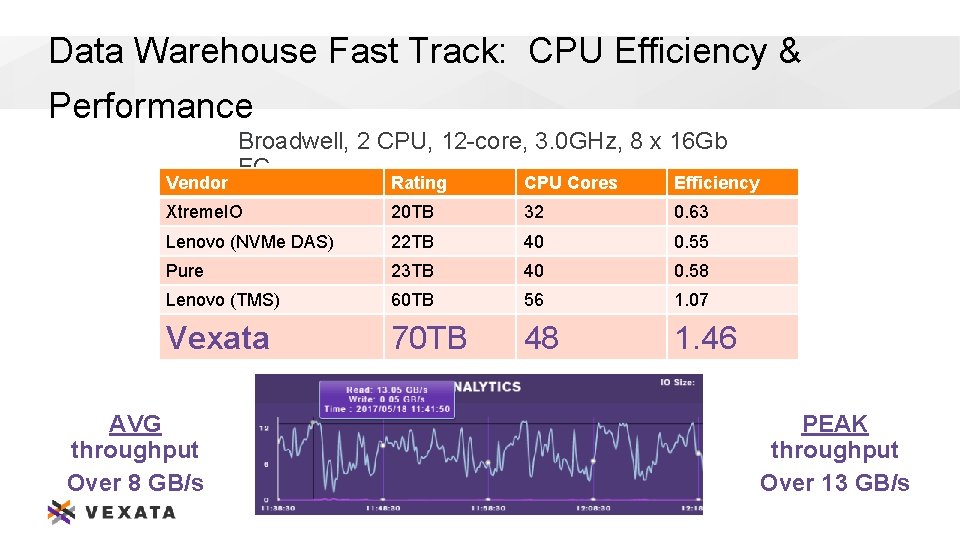
Data Warehouse Fast Track: CPU Efficiency & Performance Vendor Broadwell, 2 CPU, 12 -core, 3. 0 GHz, 8 x 16 Gb FC Rating CPU Cores Efficiency Xtreme. IO 20 TB 32 0. 63 Lenovo (NVMe DAS) 22 TB 40 0. 55 Pure 23 TB 40 0. 58 Lenovo (TMS) 60 TB 56 1. 07 Vexata 70 TB 48 1. 46 AVG throughput Over 8 GB/s PEAK throughput Over 13 GB/s 19

THANKS!!! 20

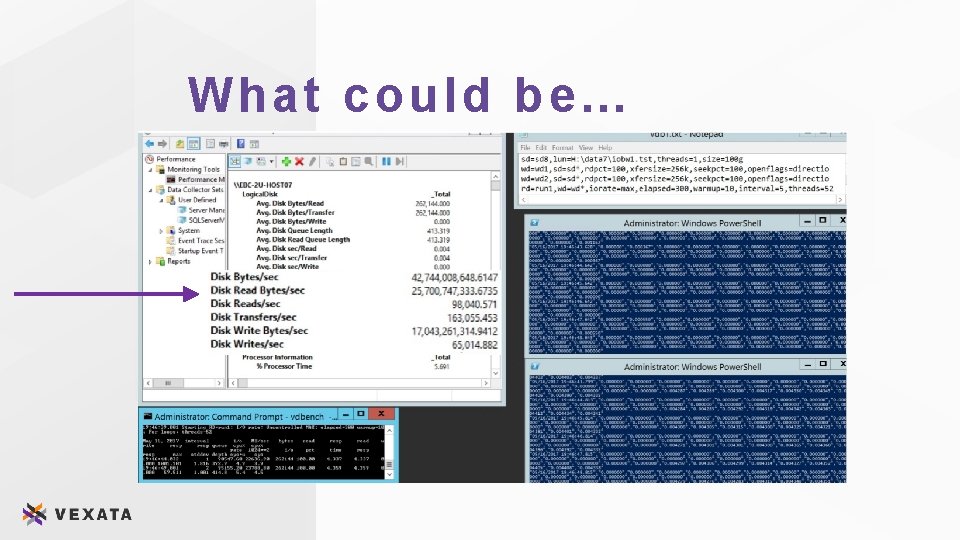
What could be… 21